
ABSTRACT
Log transformations of density values in the form log(count)/log(area), as used in a recent paper in this journal, do not preserve the rank order of the untransformed density values and are dependent on the units used for area. The appropriate log transformation of density is log(count/area).
Data transformations have a long history of use in the analysis of ecological data. They are used on data with non-normal error distributions with the aim of allowing the use of parametric methods of statistical analysis. Count data are usually log transformed, using log (x + c) where x is the variable and c is a constant included to allow the transformation of zero values (which are common in count data). More recently, the development of generalized linear models (GLMs) has allowed analyses using alternative error structures that may be a better fit for many types of ecological data. For count data, GLMs using Poisson or negative binomial error distributions generally perform better than analysing log transformed data with linear models (O’Hara & Kotze Citation2010, St-Pierre et al. Citation2018). These GLMs can accommodate density data by using area as an offset. However, poorly specified GLMs can have high Type I error rates (Ives Citation2015) and linear models using transformed data can still be useful (Warton et al. Citation2016).
A related, but separate, use of logarithmic functions occurs in exploratory analysis of datasets where the range of the variables spans orders of magnitude. In these situations, plotting axes on log scales can help the interpretation of patterns in the data. One example would be the analysis of relationships between population counts and site areas where the samples span a wide range of site sizes. This relationship can also be expressed as density, where density = count/area. However, while this relationship can be explored using graphs with log scales on both axes, log(count)/log(area) is not an appropriate method of transforming densities.
In a recent paper by Whittingham et al. (Citation2019), the relationship between Ruddy Turnstone Arenaria interpres densities and distances from offshore refuges was analysed using log(count)/log(area) to transform the density values. Here, I explain why this transformation was not appropriate and explore some of the mathematical properties of the transformation and how these influence data analyses using this transformation.
The correct log transformation of density values is log(count/area), which can also be expressed as log(count)-log(area). The log(count)/log(area) transformation simplifies to logarea(count): i.e. it is the power to which the area needs to be raised to give the numerical value of the count. This transformation is a ratio of powers: e.g. the log10(count)/log10(area) transformation of 10 birds in 100 ha (0.1 birds/ha) is 1/2 = 0.5. This means that the same density can have different transformed values: e.g. 1000 birds in 10,000 ha have the same density (0.1 birds/ha), but the log10(count)/log10 (area) transformation is now 0.75.
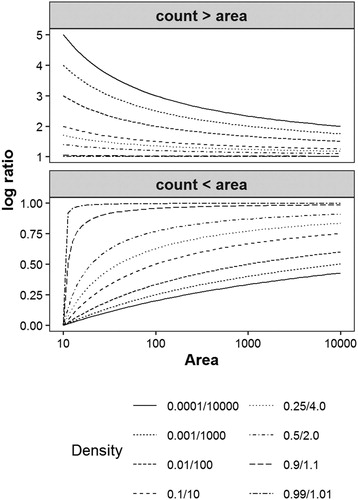
More generally, the log(count)/log(area) transformation does not preserve the rank order of the untransformed data (). As the transformed values are a ratio of powers, the relationship between the untransformed and transformed values depends upon the numerical values of the numerator and denominator, not the ratio between these values (). If the count values are greater than the area values then, for a constant density, the transformed values will decrease towards an asymptote of 1 as the numerical values of the count and area increase. Conversely, if the area values are greater than the count values then, for a constant density, the transformed values will increase towards an asymptote of 1 as the numerical values of the count and area increase. This means that the transformed values are heavily dependent on the units used for area because, in density calculations, the numerator will usually be the number of individuals so the choice of units is only required for the denominator. If a large unit such as hectares is used, the numerical value of the area will normally be less than the numerical value of the count and this will bias the transformed densities towards values from sites with smaller areas. Conversely, if a small unit such as m2 is used, the transformed densities will be biased towards values from sites with larger areas. Therefore, the rank order of the transformed densities differs depending on the units used for area ().
Figure 1. Rank order of log(count)/log(area/m2) transformed densities compared to rank order of untransformed densities, and compared to rank order of log(count)/log(area/ha) transformed densities, using data from Table 1 in Whittingham et al. (Citation2019).
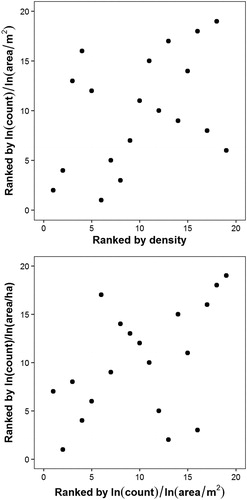
Figure 2. Effect of the numerical value of the area, and its difference from the numerical value of count, on the log(count)/log(area) transformation for constant densities, where area > count, or area < count.
In Whittingham et al.’s (Citation2019) dataset, the more distant sites tended to have larger areas. Therefore, the use of the log(count)/log(area) transformation inflated the transformed density values for these sites, resulting in a weaker relationship with distance, compared to the relationship with distance shown by the correct log(count/area) transformation (). Note, that while Whittingham et al. (Citation2019) analysed a mixed linear model, which included site and winter as random effects, the relationships in are based on the mean count values from Table 1 of Whittingham et al. (Citation2019). However, the regression line in their Figure 2 is almost identical to that in here. Therefore, the random effects included in their GLM analysis do not seem to have much influence on the outcome of their analysis, and do not affect the comparisons reported here.
Figure 3. Relationship between Turnstone density and distance from offshore refuges, using the log(count/area) transformation, the log(count)/log(area) transformation with area in m2 and the log(count)/log(area) transformation with area in ha. Fitted lines from linear regressions are shown. Pearson’s r values are: −0.66 (P = 0.002) for the log density; −0.52 (P = 0.023) for the log ratio transformation in m2; and −0.39 (P = 0.102) for the log ratio transformation in ha.
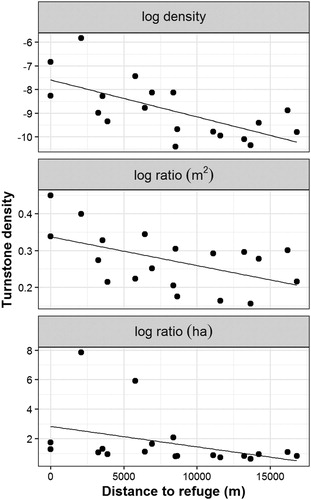
In the particular case of the Whittingham et al. (Citation2019) paper, the use of the log(count)/log(area) transformation does not affect the finding of a significant relationship between Turnstone density and distance from island refuges (). However, this could be purely by chance: if the sites with the highest transformed densities had been larger, and the sites with the lowest transformed densities had been smaller, the relationship would not have held, even if the densities had remained the same: e.g. multiply the counts and the areas of the three sites with the highest log(count)/log(area) values by 10, and the two sites with the lowest log(count)/log(area) values by 0.1. Furthermore, if the authors had used ha, rather than m2, as the units for area, they would not have found a significant relationship ().
The issue identified in this article is a simple mathematical mistake. However, it illustrates the importance of understanding the mathematical properties of a data transformation before employing it. While the use of the log(count)/log(area) transformation by Whittingham et al. did not affect the substantive finding of a negative relationship between Turnstone density and distance from island refuges, it means that the form of the relationship, and its statistical significance, have been incorrectly reported. It would also mean that any effect size estimates (e.g. the decrease in density with increase in distance) would be incorrect (the effect size was not reported by Whittingham et al. but could be estimated from their ). The use of the log(count)/log(area) transformation by Whittingham et al. (Citation2019) may also be used, incorrectly, as an example by other researchers looking for an appropriate way to transform density data. Conversely, those readers who do realize that the transformation is wrong may discount the actual relationship that does appear to existing between Turnstone density and distance from island refuges.
References
- Ives, A.R. 2015. For testing the significance of regression coefficients, go ahead and log-transform count data. Methods Ecol. Evol. 6: 828–835. doi: 10.1111/2041-210X.12386
- O’Hara, R.B. & Kotze, D.J. 2010. Do not log-transform count data. Methods Ecol. Evol. 1: 118–122. doi: 10.1111/j.2041-210X.2010.00021.x
- St-Pierre, A.P., Shikon, V. & Schneider, D.C. 2018. Count data in biology – data transformation or model reformation? Ecol. Evol. 8: 3077–3085. doi: 10.1002/ece3.3807
- Warton, D.I., Lyons, M., Stoklosa, J. & Ives, A.R. 2016. Three points to consider when choosing a LM or GLM test for count data. Methods Ecol. Evol. 7: 882–890. doi: 10.1111/2041-210X.12552
- Whittingham, M.J., McKenzie, A.J., Francksen, R.M., Feige, D., Cadwallender, T., Grainger, M., Fazaa, N., Rhymer, C., Wilkinson, C., Lloyd, P., Smurthwaite, B., Percival, S.M., Morris-Hale, T., Rawcliffe, C., Dewson, C., Woods, S., Stewart, G.B. & Oughton, E. 2019. Offshore refuges support higher densities and show slower population declines of wintering Ruddy Turnstones Arenaria interpres. Bird Study 66: 431–440. doi: 10.1080/00063657.2020.1713725