
ABSTRACT
In this reply, we confirm that the results of the original paper are robust and that our conclusions were correct: densities of Ruddy Turnstones Arenaria interpres were lower on sites located further from undisturbed refuges. There are two points of learning here: (i) taking the findings of a paper based purely on what is published is normal but there is an unpublished iterative process for analysis that is often hidden from a reader (described here), so we refute that our results were caused by chance; (ii) we published a result based on an incorrect method in the revision process. We hope that other researchers involved in long-term projects involving large and complex datasets can learn from our mistake, as we will endeavour to do.
We are grateful to Tom Gittings (Gittings Citation2020) for highlighting what he rightly terms ‘a simple mathematical mistake’ in our recent paper about Ruddy Turnstones Arenaria interpres and offshore refuges (Whittingham et al. Citation2019). We accept that the use of log(count)/log(area) was not the appropriate method for calculating bird density for the reasons set out by Gittings. However, our results did not occur by chance, as we outline below, but our data checking process was insufficient and this led to the use of erroneously transformed data.
Gittings (Citation2020) has reproduced our results using data from in Whittingham et al. (Citation2019). However, for reasons of brevity and readability, the results were a condensed summary of our full dataset which contained 2004 rows of data, which obviously could not be displayed in the paper. As such, Gittings’ reproduction of our result using data from our , while arriving at a similar result, does not provide the correct model result. For absolute clarity and transparency, we outline how the statistical results were derived in the published paper, and what the statistical results are when density is correctly transformed.
Table 1. Summary of four different methods used to confirm the result that Turnstone densities decline with distance to refuge. Although the magnitude of the negative relationship differs, the parameter estimates were not used to make predictions.
The result as presented in our paper states that ‘Turnstone densities were higher on sites at, or closer to, refuges (F1,19 = 9.0, P = 0.007)’. This was created using a general linear mixed-effect model specifying the predictor variable as ‘distance to the nearest offshore refuge’ (log-transformed to retain similar scales of variables), random effects as ‘site’ and ‘winter’ (i.e. year) and the Turnstone density response variable as log(mean Turnstone count)/log(area of rocky shore habitat). This model, using the incorrectly transformed density response variable, produced the model statistics as presented in our paper (Whinttingham et al. 2020), and a parameter estimate for Turnstone density of ˗0.017 (standard error ± 0.006). When this model is fitted using the same predictor variable and random effects, but a Turnstone density response variable calculated as log(mean Turnstone count / area of rocky shore habitat), the model statistics become F1,19 = 6.3, P = 0.021, i.e. still statistically significant. The parameter estimate for the distance to the nearest offshore refuge now becomes ˗0.22 (standard error ± 0.087). As such, when transformed correctly, there remains a significant negative relationship between Turnstone density and distance to the nearest offshore refuge. This error has had no effect on the main result in our paper, nor the conclusions deriving from this result (although note that we did not state parameter estimates in our published paper). In our study we also presented the P-values for a similar model incorporating weights to account for the unbalanced number of surveys conducted in each winter. In our paper we stated that this model showed that the relationship remained significant (P = 0.008), and this remains the case when density is correctly transformed (P = 0.018).
Gittings’ states that ‘if the authors had used ha, rather than m2, as the units for area, they would not have found a significant relationship’. This is true when Turnstone density is transformed as log(count)/log(area), but we wish to make it absolutely clear that when transformed as log(count/area), the significant result does not change. Using hectares (ha) instead of metres squared (m2) as the unit by which rocky shore is measured, the model parameters show that the relationship remains significant (F1,19 = 8.15, P = 0.01, parameter estimate ± se = −0.22 ± 0.078) and indeed using the other methods of analysis ().
We show here, therefore, that this mathematical mistake has not affected our results or any conclusions derived from them, and we are happy to provide the correct statistical results.
The log transformation of area
We agree with Gittings (Citation2020) that our use of log(count)/log(area) was not an appropriate way to transform bird density, and that we should have transformed density as log(count/area). It is true that the use of log(count)/log(area) does not affect the finding of a significant negative relationship between Turnstone density and distance from the nearest offshore refuge in our paper, but we agree with Gittings that it is important that this is calculated correctly for the reasons given in his paper.
However, there are a few aspects of Gittings’ paper which we would like to clarify and elaborate on. First, we wish to reiterate that this mathematical mistake has not affected any of the conclusions or findings in our paper: the result in question still holds when this mistake is corrected, and none of the other results in our paper were affected. Furthermore, whilst Gittings rightly points out that the rank order of sites was affected by our transformation, we did not base any of our conclusions on this, nor did we attempt to predict actual Turnstone densities at any site based on the transformed values or the associated modelled relationship.
Second, Gittings states that
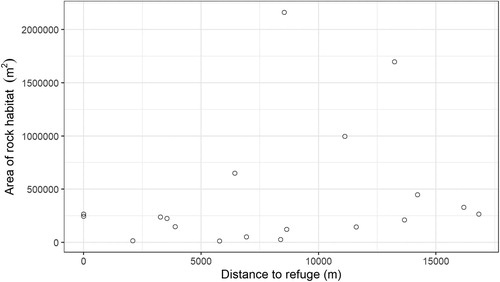
In Whittingham et al. (2020)’s dataset, the more distant sites tended to have larger areas [of rock habitat]. Therefore, use of the log(count)/log(area) transformation inflated the transformed density values for these sites, resulting in a weaker relationship with distance, compared to the relationship with distance shown by the correct log(count/area) transformation.
Figure 1. The relationship between the distance of 19 sites to the nearest offshore refuge and the area of rock habitat at these sites.
Third, Gittings states that
for count data, GLMs [generalised linear models] using Poisson or negative binomial error distributions generally perform better than analysing log transformed data with linear models (O’Hara & Kotze Citation2010, St-Pierre et al. Citation2018). These GLMs can accommodate density data by using area as an offset.
Lastly, readers of Gittings’ paper could be forgiven for concluding that our results are simply a product of our choice of unit for measuring rocky shore habitat. Whilst Gittings’ is correct that this would be the case if this had been used in a model with density transformed as log(count)/log(area), we would like to make it clear that when Turnstone density is correctly transformed, the choice of unit used does not affect our results or conclusions, as we have shown above. We would like to clarify that the choice of unit used to measure rocky shore (m2) was simply a product of how the data were derived, being provided in this unit from Google Earth, as outlined in our methods.
Changes needed to the original paper
The following paragraph should now be including with the results section of the original paper (Whittingham et al. Citation2019).
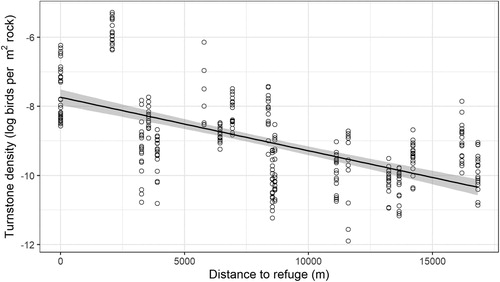
As expected, mean Turnstone counts per site (across all years) were significantly positively related to the area of rocky shore (r = 0.55, P = 0.015). Therefore, we used Turnstone density (mean number per unit area of rock in each winter) in our models from thereon. Turnstone densities were higher on sites at, or closer to, refuges (F1,19 = 6.3, P = 0.021; ). As the number of surveys in each year contributing to this analysis was unbalanced, we repeated the analysis using a weighted regression (number of surveys on which mean count in each year was derived was used to weight each data point) and this analysis also showed a significant impact of distance to refuge on Turnstone density (P = 0.018).
Figure 2. Corrected from original paper (Whittingham et al. Citation2019). Density of Turnstones was higher at sites closer to refuges (P = 0.021). Densities were calculated by log transforming mean Turnstone counts from 1998/1999 to 2015/2016, divided by the area of rocky shore at each site (data were missing for some years but note that weighted regression still showed the relationship to be significant (P = 0.018)). The solid line shows the best-fit line from the regression, and the shaded area shows the 95% confidence interval around the line.
What can we learn from this - how did we make this mistake?
We hope that it is clear from the above that the mistake we made in our transformation was unintentional and did not alter the conclusions of our paper. However, an important learning point from this analysis is that even when multiple methods all lead to the same answer () care needs to be taken when responding to reviewers’ comments that the methods in the final version of the paper are correct.
References
- Gittings, T. 2020. Offshore refuges support higher densities and show slower population declines of wintering Ruddy Turnstones Arenaria interpres: a comment on analysis. In Review. Bird Study 67: 261–263.
- O’Hara, R.B. & Kotze, D.J. 2010. Do not log-transform count data. Methods Ecol. Evolut. 1: 118–122.
- St-Pierre, A.P., Shikon, V. & Schneider, D.C. 2018. Count data in biology - data transformation or model reformation? Ecol. Evol. 8: 3077–3085.
- Whittingham, M.J., McKenzie, A.J., Francksen, R.M., Feige, D., Cadwallender, T., Grainger, M., Fazaa, N., Rhymer, C., Wilkinson, C., Lloyd, P., Smurthwaite, B., Percival, S.M., Morris-Hale, T., Rawcliffe, C., Dewson, C., Woods, S., Stewart, G.B. & Oughton, E. 2019. Offshore refuges support higher densities and show slower population declines of wintering Ruddy Turnstones Arenaria interpres. Bird Study 66: 431–440.