
ABSTRACT
Capsule:
Numbers of moulting Common Eiders Somateria mollissima counted in Shetland during surveys from 1977 to 2019 decreased from approximately 14,500 to an estimated 3600 individuals, a 75% population decline.
Aims:
To report results of extensive surveys of Eiders across Shetland during the annual complete moult period, review historical surveys, and evaluate long-term population changes and the possible underlying causes for change.
Methods:
Extensive areas of coastal Shetland were surveyed for Eiders during the annual moult period from July to September, every one to five years from 1977 to 2019. Spatial sampling was variable between surveys from 1977 to 1993 but more systematic and standardised during all surveys from 1996 to 2019. Overall population change, changes in numbers of birds within areas categorised as either exposed or sheltered coast, and change in the proportion of adult males to females/juveniles were assessed.
Results:
Surveys from 1977 to 1993 indicated a 55% decrease, from approximately 14,500–6500 individuals, and surveys from 1996 to 2019 showed a 45% decrease, from an estimated 6700–3600 individuals, indicating an overall population decrease of approximately 75% from 1977 to 2019. From 1996 to 2019, Eider numbers decreased in areas of exposed coast by approximately 90% but increased by at least 70% in the more sparsely populated sheltered areas, and the overall proportion of adult males to females/juveniles reduced by one-third.
Conclusion:
From 1977 to 2019, a substantial decline of approximately 75% occurred in the Shetland Eider population at the time of moult. Shetland Eiders are not S. m. mollissima but morphologically and genetically akin to S. m. faeroeensis, the Faroese subspecies, the rarest subspecies worldwide, so this decline is of high conservation concern. Causes of the decline largely remain unknown, but ecological datasets on Shetland Eiders are few and detailed studies, including remote tracking of individuals’ movements throughout the year, would be worthwhile.
Monitoring population change is an essential cornerstone in the conservation of rare and unusual populations, and those at high risk from anthropogenic threats such as pollution incidents. The Common Eider Somateria mollissima (hereafter Eider) occurs in shallow marine and coastal onshore habitats at mid to high latitudes around Eurasia and North America (Waltho & Coulson Citation2015). Eiders breeding in most of the UK are the nominate subspecies S. m. mollissima, however, in Shetland, genetic and morphometric analyses have shown that the population is distinct from S. m. mollissima and akin to S. m. faeroeensis, the subspecies of the Faroe Islands (Furness et al. Citation2010, Knudsen Citation2019). The total world population of S. m. faeroeensis has been estimated at approximately 14,000 individuals (excluding Shetland), in comparison with 150,000 individuals or higher for each of the other five Eider subspecies worldwide (Wetlands International Citation2012). In a UK context, the Shetland Eider population is, therefore, unusual and its conservation status an important consideration.
Eiders are susceptible to harm and mortality from oil pollution in the marine environment (Camphuysen & Heubeck Citation2016, Mullineaux & Keeble Citation2016). Construction of a major North Sea oil terminal at Sullom Voe on Shetland in the 1970s raised concern about the potential impacts of oil pollution on Shetland’s internationally important marine bird populations, including the Eider (Jones & Kinnear Citation1979). Consequently, Eider population counts in Shetland were initiated by the Nature Conservancy Council (NCC) in 1973, leading to the first large-scale survey in 1977, and large-scale surveys continued regularly thereafter, carried out by the Shetland Oil Terminal Environmental Advisory Group (SOTEAG) as part of its ornithological monitoring programme (Heubeck Citation1987, Dunnet & Heubeck Citation1995).
Eiders breed and winter widely around the coast of Shetland, but accurate large-scale surveys of nests and the wintering population are logistically highly challenging. The Shetland coastline is approximately 2700 km long. Extensive areas of coastal habitat are suitable for nesting, from rocky beaches to open moorland, and nests and incubating females are well camouflaged and easily overlooked; if disturbed, clutches are vulnerable to predation. In winter, sea conditions are generally too rough for accurate, large-scale (Shetland-wide) surveys of Eider. However, population surveys of moulting individuals in late summer, when conditions are more benign, provide an opportunity for large-scale monitoring. In the months immediately following breeding (July–September) adult Eiders assemble into flocks and carry out a full moult, becoming flightless during the period of wing moult, that lasts for approximately four weeks (Waltho & Coulson Citation2015). In Shetland, such flocks often occur in the same coastal locations each year, include immatures and juveniles as well as adults, and can be counted accurately; a novel approach, considering most surveys of Eider elsewhere have occurred during breeding or wintering (Waltho & Coulson Citation2015, Keller et al. Citation2020).
In this paper we present the results of all Shetland-wide moulting Eider population surveys. We review the initial surveys from 1977 to 1993, present the results of more standardised surveys from 1996 to 2019, evaluate long-term changes in the Eider population in Shetland, and examine factors that may underlie those changes.
Methods
Review of initial survey methods: 1977–1993
Eider counts and notes on breeding have been recorded in Shetland since 1700 (Pennington et al. Citation2004) but it was not until 1977 that a Shetland-wide population survey was first attempted, following small-scale pilot surveys of Eider moulting flocks during 1973–1976 by NCC in response to concerns about the Shetland oil terminal and the potential for oil pollution (Jones & Kinnear Citation1979). Between 1977 and 1993, locations where moulting birds were known to have occurred, plus any newly discovered locations, were surveyed at least once between mid-July and mid-September from either the land, 10–15 m hard-hulled boats, a Zodiac inflatable boat, a small fixed-wing aircraft or a small helicopter. Birds were either counted individually, estimated in blocks of five or 10, depending on flock size and structure, or counted later from aerial photographs (Jones & Kinnear Citation1979, Heubeck Citation1987, Citation1993a, Citation1993b). During this period, Shetland-wide moulting flock surveys were attempted every one-to-five years () and knowledge of Eider numbers and the locations and behaviour of moult flocks increased with each survey.
Table 1. Counts of individual Eiders during Shetland-wide moult flock population surveys in 1977–1993.
The aim of these surveys was to count as many Eiders as possible in Shetland, covering as many known moulting areas as possible (Jones & Kinnear Citation1979, Heubeck Citation1987, Citation1993a, Citation1993b). It was assumed that birds did not move around within Shetland during the survey period, given this coincided with the general moult period, including the shorter period of flightlessness, and that double-counting therefore did not occur. In general, few Eiders were seen during transit by boat and aircraft between the moulting areas, suggesting that a high proportion of the total Shetland population was found and counted during each survey, that took 10–20 days in total (Heubeck Citation1993a). However, coverage of the entire Shetland coastline was never complete, and only rarely was full coverage of the known moulting areas achieved (Jones & Kinnear Citation1979, Heubeck Citation1987, Citation1993a, Citation1993b). Therefore, the 1977–1993 counts are best considered as population indices for Shetland from large-scale focused sampling, rather than complete population census totals.
An important consideration is how the amount of coastline covered during the 1977–1993 surveys varied. Coverage gradually increased, as new sections of coast and new areas of sea were checked, and additional locations with birds were discovered and thereafter incorporated into subsequent surveys. Adverse weather, rough sea conditions, and transport and time limitations also affected coverage by preventing counts. These sources of sampling variation mean that the 1977–1993 surveys cannot be considered as standardised surveys. However, for the purpose of this study, to examine long-term patterns of change rather than year-to-year differences, they can be used, with caveats, to show population trends.
Survey method from 1996 to 2019
Building on the experience gained between 1977 and 1993, surveys at the time of moult continued from 1996. Some of the logistical challenges of the initial surveys still occurred, but the survey methodology and coverage of coastal habitats (spatial sampling) from 1996 to 2019 were more systematic and standardised.
Eiders were counted in up to 30 standard survey areas around Shetland from 1996 to 2019 (see and online Table S1 for locations). Five survey areas were added during this period in response to increasing sightings of birds in more sheltered, inshore locations with aquaculture sites (survey areas 5, 9, 17, 21 and 26; Heubeck & Mellor Citation2013). The boundaries of the survey areas were defined to include the locations of all records of Eiders recorded during surveys from 1973 to 1993, and for the five areas mentioned above, also the locations of casual records of birds up to 2004/2005 and locations of aquaculture sites in these areas (Shetland Biological Records Centre Citation1970–2021, Jones & Kinnear Citation1979, Heubeck Citation1987, Citation1993a, Citation1993b, Heubeck & Mellor Citation2013).
Figure 1. Map of Shetland showing the location of the 30 survey areas used for moulting Eider population surveys in 1996–2019 (see online Table S1 for additional details). Coastline and open water habitats were surveyed within the boundaries of each area (polygons or circles). Survey areas categorised as exposed coast are underlined (e.g. 1), those categorised as sheltered coast are not underlined (e.g. 2). Triangles indicate where counts significantly increased (pointing up) or decreased (pointing down) across years (1996–2019, P < 0.05; survey area 9 showed no significant trend). Fair Isle is situated 38 km southwest of the southernmost tip of Mainland Shetland. * indicates survey areas with no missing counts from 1996 to 2019.
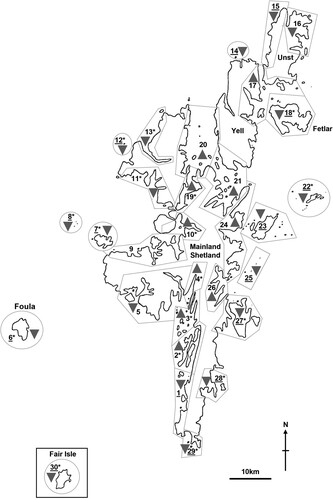
Counts of the survey areas were made in 1996, 1997, 2001, 2002, 2005, 2006, 2009, 2012, 2015 and 2019. The counting period each year was from the third week in July to the second week in September inclusive, encompassing the moulting period in Shetland (Heubeck Citation1987, Waltho & Coulson Citation2015). Within this period, survey areas were counted once, and included shoreline and coastal open water habitats, on days that weather and sea conditions were suitably calm, until either all the survey areas had been counted or the end of the second week in September was reached and the survey for that year ended. It was assumed that Eider movements within Shetland during this period were minimal and double counting of flocks/individuals did not occur.
Counts were made from land or a hard-hulled boat, using binoculars or (on land) a telescope, in conditions of calm or light sea swell, wind of Beaufort scale 3 or less and no rain. Occasionally, counts were made from land in more severe conditions, but only when Eider flocks were fully visible in relatively very calm and sheltered locations (e.g. the leeward side of islands in area 29). Generally, count methods (land or boat) were consistent in each survey area across years, but very rarely particularly remote locations within survey areas 7, 8, 12 and 15 were surveyed from a helicopter (on three dates in 1996, two in 1997, three in 2001 and two in 2002) and counts were then made by downwards scanning using binoculars or from high-resolution aerial photographs. Counts of very tightly grouped, unusually large or highly mobile flocks were repeated, usually by at least two observers, and a final figure estimated by consensus. Numbers of Eiders and the location of flocks and individuals were mapped, and the total count for each survey area then compiled. Each survey year, the number of adult male birds (individuals showing black plumage) and the number of female/juvenile birds (individuals with completely brown plumage, i.e. females and juvenile birds in their first calendar year) was also recorded, whenever conditions allowed, and from this sampling the overall percentage composition of adult males to females/juveniles was calculated for the year.
Complete coverage of areas 5 and 21 only began in 2005, and areas 9, 17 and 26 in 2006 (Heubeck & Mellor Citation2013). However, complete coverage in all survey years also did not occur in certain other survey areas because periods of poor weather and sea conditions occasionally prevented surveys. When a survey area was not visited during a survey year, or when coverage was entirely prevented or incomplete, then this was treated as a missing count in the dataset. In all such cases, we estimated missing counts using the linear regression of counts on year, using all the empirical counts for the particular survey area. The full dataset thus comprised empirical counts (259 in total) or estimated counts (41 in total) for all survey years (10 in total, a subset from 1996 to 2019) and all survey areas (1–30; ). An estimated overall total count was calculated for each survey year, which was the sum of all empirical counts and estimated counts from all 30 survey areas. A purely empirical total count was also calculated for each survey year, which was the sum of only the empirical counts, from the 17 survey areas with no missing counts ( & ). Thus, these two data series of total counts are indices of population size but from near-comprehensive, large-scale focused sampling, and in this form have not been published previously.
Table 2. Counts and estimated counts of Eiders during Shetland-wide population surveys at the time of moult (mid-July to mid-September), 1996–2019.
A shift in the distribution of moulting Eiders in Shetland, from exposed to sheltered coastal locations, was described by Heubeck & Mellor (Citation2013) but never statistically tested. To quantitatively assess and test whether population changes may have occurred within these two general habitat categories, each survey area (1–30) was defined as either exposed or sheltered coast. Areas where less than 50% of the total coastline formed part of inlets or channels enclosed on two or more sides by land, i.e. where most of the coastline was exposed to the open sea, were defined as exposed coast (). Areas where more than 50% of the total coastline formed part of inlets or channels enclosed on two or more sides by land, i.e. where most of the coastline was sheltered from the open sea, were defined as sheltered coast (). For each of these two categories separately, an estimated total count was calculated for each survey year, which was the sum of all empirical counts and estimated counts from all survey areas; additionally, an empirical total count was calculated for each survey year, which was the sum of all empirical counts, from the 17 survey areas with no missing counts.
A generalised linear model (GLM) with Poisson distribution and log link function was used to test whether Eider counts varied among years, for each survey area separately, for the estimated overall total count series, and overall empirical total count series separately, and for the estimated overall total count series and empirical count series for each of the two categories of coast separately. A linear model was used to test whether percentages of adult males and females/juveniles varied among years and for this percentages were arcsine transformed (ProgrammingR.com Citation2022). Estimated counts were not included in these models, except for the three GLMs used to test whether (1) the estimated overall total count series (estimated and empirical counts included) for all areas varied among years, (2) the estimated overall total count series for exposed areas varied among years, and (3) the estimated overall total count series for sheltered areas varied among years. Analyses were carried out using R version 3.6.2 (R Core Team Citation2019).
Results
Results of the initial surveys: 1977–1993
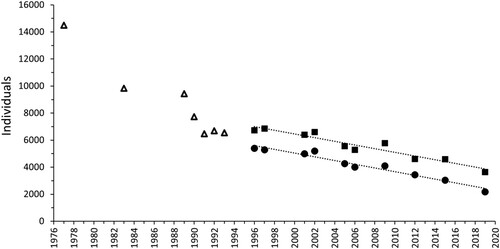
The Shetland-wide moult flock survey in 1977 recorded a total of 14,500 Eiders at 26 locations. This represented approximately 20% of the British population at the time, of all sub-species (; Jones & Kinnear Citation1979, Pennington et al. Citation2004). The 1980 survey recorded 8794 Eiders at 20 locations, however, Fair Isle and Foula were not covered in this survey, meaning that the decline was overestimated (). The results of further surveys to 1993 are presented in , with the total counts for the years that Fair Isle and Foula were included presented in . These counts indicate that a substantial decrease in the number of Eiders occurred during this period. The total count for Shetland in 1993 was 6544 Eiders, representing an apparent 55% decrease in numbers since 1977 ( & ). The total counts suggest a possible stepwise pattern of population decrease, but with the moulting population relatively stable at between 9000 and 10,000 individuals from 1983 to 1989, and relatively stable again at between 6000 and 7000 individuals from 1991 to 1993 ( & ).
Figure 2. Eider counts from Shetland-wide population surveys at the time of moult (mid-July to mid-September), 1977–2019. Dotted lines = linear regressions of counts on year. Triangles = total counts from surveys in 1977–1993. Squares = estimated overall total counts from surveys in 1996–2019 (β = −136.2 individuals per year, z = −41.2, df = 9, P < 0.001). Circles = empirical total counts from surveys in 1996–2019, from the 17 survey areas with no missing counts (see methods; β = −138.2 individuals per year, z = −48.3, df = 9, P < 0.001). These data series are indices of population change from large-scale focused sampling of the Shetland coast.
Survey results from 1996 to 2019
Between 1996 and 2019, the number of Eiders decreased significantly in 19 of the 30 survey areas (P < 0.05 for all tests; & , ). Numbers significantly increased across years in 10 survey areas (P < 0.05 for all tests; & , ). In only one survey area was there no significant increase or decrease in counts across years (survey area 9, P = 0.823; & , ). The largest decreases occurred in survey area 27, where 2201 birds were counted in 1996 but 61 in 2019, and survey area 29, where there were 1322 birds in 1997 but 101 in 2019 (). There were no increases of similar absolute magnitude. The largest increase occurred in survey area 2, where 171 birds were counted in 1996 and 721 in 2019.
Estimated overall total counts decreased by approximately 45% between 1996 and 2019, from 6727 individuals in 1996 to 3639 in 2019 ( & ). The decrease was highly significant across years and showed a general pattern of linearity (; β = −136.2 individuals per year, z = −41.2, df = 9, P < 0.001). Estimated overall total counts incorporated 259 empirical counts and 41 estimated counts (13.7% of the total dataset) from 13 survey areas with missing counts for up to five survey years in any one area (). The empirical totals, from the 17 survey areas with no missing counts, also decreased significantly across years, by approximately 50% (5417 individuals in 1997, 2188 in 2019) and with a similar general pattern of linearity (; β = −138.2 individuals per year, z = −48.3, df = 9, P < 0.001).
During the 1996–2019 surveys, geographical coverage was less variable than previously, though some variability was unavoidable due to factors such as severe weather. There was only one survey area (area 9) where missing counts were estimated from a fitted linear model where P > 0.05 (for all other estimated counts P < 0.05; ). The five counts estimated for area 9 were all proportionally low (<1%) in comparison with respective estimated overall total counts (), and did not influence the overarching pattern of substantial, highly significant, linear population decrease shown by the 1996–2019 estimated overall total counts (area 9 values included: β = −136.2 individuals per year, z = −41.2, df = 9, P < 0.001; area 9 values excluded: β = −136.3 individuals per year, z = −41.5, df = 9, P < 0.001). The linear pattern and rate of population decrease shown by the estimated overall total counts, and the pattern and rate of decrease shown by the empirical total counts, were very similar and did not contradict each other (). Overall, all evidence indicated that a population decrease of approximately 45% between 1996 and 2019 had occurred.
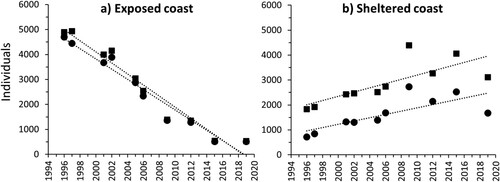
In areas categorised as exposed coast (15 in total), estimated overall total counts and empirical total counts both decreased significantly by approximately 90% between 1996 and 2019, respectively from 4898 and 4697 individuals in 1996 to 529 and 515 individuals in 2019, with a general pattern of linearity ((a); total counts, β = −221.1 individuals per year, z = −92.7, df = 9, P < 0.001; empirical counts, β = −204.3 individuals per year, z = −88.7, df = 9, P < 0.001). In contrast, in areas categorised as sheltered coast (15 in total), estimated overall total counts increased significantly, by approximately 70% between 1996 and 2019, from 1829 individuals in 1996 to 3110 in 2019 ((b); β = 84.9 individuals per year, z = 35.9, df = 9, P < 0.001); also, empirical total counts increased significantly, by approximately 130% between 1996 and 2019, from 720 individuals in 1996 to 1673 in 2019 ((b); β = 66.2 individuals per year, z = 36.9, df = 9, P < 0.001). Furthermore, in each individual survey area categorised as exposed coast, counts significantly decreased across years ( & ), whereas in most, but not all, survey areas categorised as sheltered coast counts significantly increased across years ( & ). The exceptions were survey areas 5, 11, 13 and 16 which were categorised as sheltered coast but where counts significantly decreased from 1996 to 2019, and survey area 9, which was categorised as sheltered coast but where there was no significant change in counts across years (). These results demonstrate that alongside an overall population decrease in the moulting Eider population in Shetland from 1996 to 2019, distinct general changes in distribution occurred.
Figure 3. Eider counts at the time of moult (mid-July to mid-September) in areas categorised as exposed coast and sheltered coast, 1996–2019. Dotted lines = linear regressions of counts on year. Squares = estimated overall total counts (Exposed: β = −221.1 individuals per year, z = −92.7, df = 9, P < 0.001; Sheltered: β = 84.9 individuals per year, z = 35.9, df = 9, P < 0.001). Circles = empirical total counts, only including survey areas with no missing counts across years (Exposed: β = −204.3 individuals per year, z = −88.7, df = 9, P < 0.001; Sheltered: β = 66.2 individuals per year, z = 36.9, df = 9, P < 0.001).
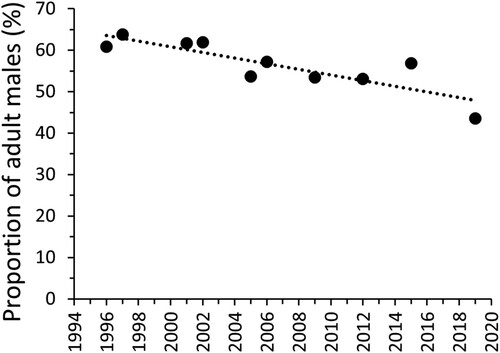
In each survey year, at least 86% of all Eiders counted were classified as either adult male or female/juvenile. The small proportion that could not be identified as one of these two categories in each survey were excluded from the analysis of ratio of males to females/juveniles, and there was no linear trend in this unidentified proportion across years, or in the total identified proportion (Unidentified: t = −0.78, df = 9, P = 0.460; total identified: t = 0.89, df = 9, P = 0.396). The percentage composition of adult males to females/juveniles changed significantly across years, with the percentage of adult males decreasing (; β = −1.24 per cent per year, t = −4.62, df = 9, P = 0.002) and females/juveniles increasing (β = 1.24 per cent per year, t = 4.51, df = 9, P = 0.002). The percentage of adult males decreased by approximately one third, from 60.9% in 1996 to 43.5% in 2019 ().
Figure 4. Proportion of Eiders that were adult male (%) among the sample of birds identified as adult male or female/juvenile during Shetland-wide moulting Eider population surveys in 1996–2019. Dotted line = linear regression of proportion of adult males on year (β = −1.24 per cent per year, t = −4.62, df = 9, P = 0.002). In each survey year, ≥ 86% of all Eider counted were categorised as either adult male or female/juvenile.
Discussion
Population declines
Large-scale Eider surveys carried out in mid-July to mid-September since 1977 indicate substantial declines in the numbers of moulting Eiders around Shetland, with an apparent 55% decrease from 1977 to 1993 (Jones & Kinnear Citation1979, Heubeck Citation1987, Citation1993a, Citation1993b) and a further 45% decrease from 1996 to 2019. In combination, the results from these two periods indicate a decline in the Shetland moulting Eider population of approximately 75% occurred from 1977 to 2019.
This study used large-scale sampling of the Shetland coast, focusing on the localities and areas where moulting Eiders were known to occur, to obtain indices of population size. None of the surveys covered the entire Shetland coast, so some Eiders were probably missed from the total population present in Shetland during surveys. However, the coastal locations consistently and deliberately excluded from surveys were sections and areas of generally unsuitable habitat where, to date, very few or no Eiders have been recorded (Shetland Biological Records Centre Citation1970–2021, Pennington et al. Citation2004). Therefore, numbers missed were probably low, survey sampling likely captured a high proportion of the total population, and the possibility that the observed decrease between 1977 and 2019 could have been caused by thousands of birds having relocated year-by-year to the relatively few coastal areas consistently omitted from surveys is not plausible.
During the 1977–1993 surveys, most of the locations where the largest moult flocks had occurred previously were included in all surveys, with the aim to minimise birds missed (Heubeck Citation1993a). Qualitative, retrospective estimates have been made, however, of the numbers of birds thought to have been missed during these surveys (Jones & Kinnear Citation1979, Heubeck Citation1987, Citation1993a, Citation1993b). A minimum of 2000 birds missed was estimated for the 1977 survey (Heubeck Citation1987, Citation1993a), but otherwise estimates of missed birds have been relatively small in comparison to respective survey totals (10% or less of total counts) and none have contradicted steep declines between 1977 and 1993 (Jones & Kinnear Citation1979, Heubeck Citation1993a). The variation in survey coverage between 1977 and 1993 is a source of uncertainty for assessing population change across this period. However, it seems likely that the magnitude of this variation, and consequent potential variation in the number of birds missed, was insufficient for the substantial long-term population declines suggested by the 1977–1993 surveys to be false.
Despite the incomplete coverage of the surveys from 1977 to 1993, it is important to acknowledge them as a substantial achievement. Given the magnitude of the Shetland coastline, ruggedness of the coastal terrain and, even in late summer, the frequency of rough seas and harsh weather conditions, these surveys were a pioneering and ambitious undertaking. Each survey covered a large proportion of the Shetland coast (over 50%) and it was always fully acknowledged that potentially birds were being missed during these surveys (Jones & Kinnear Citation1979, Heubeck Citation1987, Citation1993a, Citation1993b). The 1977–1993 surveys are an extremely valuable contribution to the long-term monitoring of Shetland’s moulting Eider population.
Comparative population data from the UK and Europe are few, because most other population counts and estimates pertain to either breeding or wintering status, rather than numbers at the time of moult. In the UK, the total breeding Eider population was recently estimated at 36,000 pairs and wintering population at 81,500 individuals (Woodward et al. Citation2020). A decrease of approximately 40% in the wintering population (not including Shetland) was recorded by the British Trust for Ornithology’s Wetland Bird Survey from 1989 to 2019, but long-term changes in the UK breeding population and the UK population at the time of moult are unknown (Woodward et al. Citation2020, British Trust for Ornithology Online Data Citation2021).
The core European breeding distribution of the Eider extends from the Netherlands northwards around the coasts of Germany, Fennoscandia (which includes the Faroes and Iceland), up to Svalbard and Franz Josef Land in the high Arctic (Waltho & Coulson Citation2015, Keller et al. Citation2020). Breeding population declines of similar magnitude to those seen in the Shetland moulting population have occurred around the Wadden and Baltic Seas and the coast of Norway (Ekroos et al. Citation2012, Kilpi et al. Citation2014, Kurvinen et al. Citation2016, Bjørnås Citation2017, Tjørnløv Citation2019, Keller et al. Citation2020). For example, in the Netherlands, Sweden, Finland, Estonia and Norway, Eider breeding populations decreased by approximately 50% between 2000 and 2009, and in Europe the species is now Red-listed and classified as Endangered by BirdLife International and the International Union for Conservation of Nature (IUCN) (Ekroos et al. Citation2012, BirdLife International Citation2021). In the Faroes, small local declines have occurred on the islands of Nólsoy and Skúvoy but changes in the overall population size are unknown, whereas in Iceland breeding populations appear relatively stable (Olsen Citation2011, Wetlands International Citation2012, Hammer et al. Citation2014, Kilpi et al. Citation2014, Aldará & Jensen Citation2019, Hammer pers. comm. 2020). Where decreases in breeding populations have occurred in Europe, similar decreases have been reported in the wintering populations, though are less certain, and changes in population size at the time of moult are unclear (Durinck et al. Citation1994, Skov et al. Citation2011, Ekroos et al. Citation2012, Kilpi et al. Citation2014).
A key question regarding the Shetland surveys is whether moult population counts made in late summer are representative of breeding and wintering population sizes. Currently, this is unknown. There have been no equivalently large-scale breeding or wintering population surveys in Shetland with which the results of this study can be compared. Eider flocks are counted each winter, but only in a few localities, with long-term increases and decreases recorded in different areas but no universal trend (Miles & Mellor Citation2019, Citation2020, Citation2021). If the Shetland Eider population is entirely resident, then the results of this study are indicative of changes in the breeding and wintering population. However, seasonal movement by Shetland Eiders has never been studied in detail, and the possibility of emigration and immigration between Shetland and other regions of the UK and Europe cannot be eliminated. Eider ‘moult migrations’ to distant sites used specifically for moult are common in Scandinavian, Greenlandic, Canadian and Russian breeding Eider populations at similar latitudes to Shetland (Waltho & Coulson Citation2015). In these countries winters average much colder than in Shetland, but annual migrations also occur in areas with similar winter temperatures, such as the Wadden Sea and the northeast coast of the UK, although in these areas movements between breeding and wintering sites tend to be more direct and total migration distances shorter (Waltho & Coulson Citation2015).
Only small numbers of Eiders have been ringed in Shetland (on average fewer than 4 per year from 1970 to 2020) and there have been no recoveries away from the isles (Pennington et al. Citation2004, Shetland Bird Club Annual Report 2000-2020). However, a juvenile female ringed in Aberdeenshire in 1980 was found dead on Fair Isle in 1989 (Pennington et al. Citation2004). The only relatively large-scale effort to track Shetland Eiders was 63 males wing-tagged on Linga island, in Bluemull Sound, in November 1984. Re-sightings were few but demonstrated that dispersal occurred away from Bluemull to other areas in north Shetland, also that individual males moulted in different locations within Shetland in different years (Heubeck Citation1993a, Pennington et al. Citation2004). Remote tracking of Faroese Eiders between 2014 and 2019 showed some individuals moved between the Faroes and northern Scotland, occasionally including Shetland waters, and a small number of drakes showing bill and plumage characteristics of the Arctic Atlantic subspecies S. m. borealis are seen annually in winter in Shetland, all implying that movements between Shetland and other areas occur (Seatrack Citation2021, Shetland Bird Club Annual Report 2000-2019). If, for example, Eiders from other locations come to Shetland purely to winter, arriving after the moult season and departing prior to the breeding season, then the Shetland moulting population is likely to reflect the breeding population. But this is unknown, and it is conceivable that migrations occur at other times of year and the situation is more complex. The identical plumage features and only slight morphometric differences of S. m. faeroeensis and S. m. mollissima preclude separation of these subspecies by field observation, meaning any seasonal movements involving both subspecies occurring together in the same place, for example in Shetland, would likely go undetected. A study using remote tracking devices to investigate the movements of Shetland Eiders and the extent of overseas interchange at different times of year, especially with the Faroes, would be very worthwhile in the context of population declines. Such studies would also help establish the extent to which movements within and away from Shetland may occur in July to September (though outwith times when the birds are flightless) and might help clarify the exact timing of the flightless period and potential for double-counting and under-counting during surveys.
Causes and potential causes of population change
Major oil spills occurred in Shetland in December 1978 from the Esso Bernicia tanker and in January 1993 from the Braer tanker, killing at least 570 and 70 Eider, respectively (Heubeck & Richardson Citation1980, Foxton & Heubeck Citation1995, Ritchie & O’Sullivan Citation1994). These totals are the number of oiled Eider corpses found during intensive, daily beach surveys for oiled wildlife done after each spill; the true mortality was probably much higher, since many corpses likely dispersed on currents and tides and did not wash ashore. Eider mortality from the Esso Bernicia spill was a contributing cause of the decrease in population size recorded from 1977 (14,500 individuals) to 1983 (9860 individuals; Heubeck Citation1987, Citation1993a). Another likely contributing cause though was unusually high mortality in northeast Shetland in the winter of 1979/1980, when approximately 100 Eiders were found dead on beaches around Bluemull Sound, the cause of death unknown, but possibly disease given that none were contaminated with oil or other obvious pollutants, and prior weather conditions had not been particularly severe (Heubeck Citation1987). Regarding the Braer, the Eider population survey results in 1992 and 1993 show close similarity () and indicate that this spill, that occurred in the winter between these two surveys, did not cause a major decrease in overall numbers. In addition to the intensive surveys done after each major spill, since July 1978 a systematic survey for beached birds and oil of up to 90 beaches across Shetland has been done every month (Heubeck Citation1995). Other than during the Esso Bernicia spill and the Bluemull Sound mortality event (1978–1980), Eider corpses have been found comparatively rarely during these surveys (1980–2019 average = 16 per year, representing less than 1% of the total corpses found of all species per year) and very few found oiled (1980–2019 average = 1 per year; SOTEAG Ornithological Monitoring Reports Citation1978–Citation2020). Overall, the evidence from population and beach surveys from 1977 to 2019 collectively indicates that, in Shetland to date, the only contributing cause of a major Eider population decline attributable to oil was the Esso Bernicia spill.
No other instances of sustained mass-mortality of Eiders have been identified in Shetland, and factors responsible for the declines since 1986 remain unknown (Heubeck Citation1987, Citation1993a, Heubeck & Mellor Citation2013). However, the decrease in population size recorded from 1996 to 2019 was distinctly linear (), suggesting that population change during this period was not driven by density-dependant factors such as disease, lethal parasites or the availability of essential resources. There are few data on the movements of Shetland Eiders (see above) and although seemingly unlikely, the possibility of mass-emigrations and long-term relocation away from Shetland cannot be dismissed. Clues from other demographic variables are few because demographic and phenological data have not been systematically collected in Shetland, other than the measures of population size and adult male to female/juvenile ratios included in this study.
Substantial long-term decreases in Eider numbers occurred between 1996 and 2019 in areas categorised as exposed coast, whereas increases occurred, albeit of lower magnitude, in areas categorised as sheltered coast. It is unclear when these changes began, but commercial aquaculture sites farming Salmon Salmo salmar and Mussels Mytilus edulis became increasingly common in Shetland through the 1990s and 2000s, and appear to be attractive to Eiders; by 2012 such sites had been built in at least 12 of the 15 survey areas that were categorised as sheltered coast in this study, but in none of the areas categorised as exposed coast (Heubeck and Mellor Citation2013). The artificial structures at these sites – floating salmon cages and mussel lines – may afford Eiders protection from bad weather and marine predators, such as gulls, skuas and Orcas Orcinus orca, particularly during chick-rearing and moult, and increased feeding opportunities, particularly on molluscs (Heubeck & Mellor Citation2013, Smith Citation2006). These apparent advantages, and the current presence of aquaculture sites in many sheltered locations, potentially offer a plausible explanation for the observed increase in Eider numbers in sheltered areas between 1993 and 2019. However, although apparently likely, this possibility remains unsubstantiated simply because the behaviour of Eiders at Salmon and Mussel farms has never been quantitively measured or analysed in Shetland, including how exactly they use these farms for shelter and feeding, where, and for how much time. Quantitative investigation of these behavioural considerations would provide a fundamental first step towards understanding how Eiders may interact with aquaculture in Shetland. The strikingly linear increase in numbers in sheltered areas and decrease in exposed areas from 1996 to 2019 suggests that density-independent factors such as environmental variables, for example pertaining to climate and ocean conditions, have to some degree influenced Eider numbers in these two general habitats. An analysis of such variables in relation to the observed population changes was outside the scope of this study but would be extremely useful in the context of global climate change.
The surveys from 1996 to 2019 showed the proportion of observed adult males to females/juveniles decreased by approximately 33%, from 61% adult males in 1996 to 44% in 2019. The associated proportional increase in females/juveniles represents a relative increase in either the abundance of adult females, juvenile females or juvenile males, or a combination of these birds, but we do not know which because these ‘brown’ individuals could not be differentiated in the field during surveys. Although seemingly unlikely, one possibility, for example, is that the ratio of adult males to adult females might have remained constant from 1996 to 2019 but the number of ducklings produced and that survived as juveniles through to September increased. The various considerations regarding ‘brown’ individuals greatly limit how these results can be interpreted, because we cannot assess whether changes occurred in the sex-ratio of adults, sex-ratio of juveniles or in recruitment across years, each of which could have major different demographic implications. In the context of European population declines, a decrease in the relative abundance of adult males was unexpected though, given that between 1979 and 2005 sex-ratios among declining Eider populations around the Baltic Sea switched from female-bias to male-bias, from approximately 40% to 60% (Lehikoinen et al. Citation2008, Ramula et al. Citation2018). Were the juvenile cohort in the female/juvenile proportion of our dataset to be defined and excluded, this would give us the adult male to adult female ratios and result in our percentages of adult males being higher (e.g. over 61% in 1996 through to more than 44% in 2019). Proportional male-bias is the norm in birds, but male bias above 55% is uncommon in Eider populations (Lehikoinen et al. Citation2008, Pipoly et al. Citation2015, Waltho & Coulson Citation2015, Ramula et al. Citation2018). Reasons for male-bias in Shetland (prior to 2019) are unknown, but one theoretical explanation might be if some males dispersed from the Faroes early in the breeding season and came to Shetland to moult. Measurements of additional demographic variables in Shetland, for example sex-ratios among ducklings, juveniles and adults, annual recruitment, nesting density in different habitats, clutch size, and adult and chick survival, would be interesting and facilitate population modelling and greater insight into the population changes.
It has long been speculated that population declines in Shetland might be due to predation or anthropogenic causes (Heubeck Citation1987, Citation1993a, Heubeck and Mellor Citation2013). Eider predation has not been studied in Shetland, but there are frequent reports of predation of ducklings and juveniles by gulls and skuas, of young and adults by Otters Lutra lutra, and of juveniles and moulting adults by Orcas (Smith Citation2006, Heubeck & Mellor Citation2013). There are also casual reports of predation of eggs, young and adults by Shetland’s non-native introduced mammals, including Polecat-Ferrets Mustela furo x putorius, Hedgehogs Erinaceus europaeus, Stoats Mustela erminea and Feral Cats Felis catus. Predation has caused substantial Eider population declines elsewhere, for example in western Finland where breeding females have been heavily predated by resident White-tailed Eagles Haliaeetus albicilla and American Mink Neovison vison (both absent from Shetland), but whether it has driven the declines in Shetland is unknown (Lehikoinen et al. Citation2008, Kurvinen et al. Citation2016). However, if heavy predation occurred during the breeding season in Shetland and was biased towards females, as occurred in Finland, then the proportion of males in the population would be expected to have increased, rather than decreased.
Potential anthropogenic causes of mass-mortality in Shetland, other than oil spills, are hard to conceive. One possibility is shooting and lethal trapping to reduce Eider numbers at aquaculture sites, but lethal action against Eiders has rarely been observed and been widely condemned in the Shetland community (for example a license for control by shooting issued by the Scottish Executive in 2001 was soon revoked following protests), Eider numbers have generally increased in the vicinity of aquaculture sites, and since 1980 relatively few Eider corpses have been found washed ashore, so it seems unlikely that these practices could have caused major long-term declines (Heubeck & Mellor Citation2013).
Conclusions
Substantial declines have occurred in the size of the Shetland Eider population measured at the time of moult. Survey results from 1977 to 1993 indicated a 55% decrease and results from 1996 to 2019 a 45% decrease, and overall showed an apparent total population decrease of approximately 75% from 1977 to 2019. Alongside the 1996–2019 decrease, counts substantially decreased in exposed areas of coast and increased in sheltered areas, where commercial Salmon and Mussel farms are sited and which may provide refuge and foraging opportunities to Eiders. The Shetland Eider population is unusual in that it is morphologically and genetically akin to S. m. faeroeensis, the Faroese subspecies, and is not S. m. mollissima that occurs across mainland UK. Globally, S. m. faeroeensis is by far the rarest subspecies and, therefore, is of high conservation importance. The Esso Bernicia oil spill in 1978 and a high mortality event in Bluemull Sound of unknown cause in 1979/80 contributed to the population decline in Shetland between 1977 and 1983. Otherwise, however, causes of long-term declines remain unknown. Diagnosis of causes is limited by an absence of ecological information, for example detailed demographic, movement, predation, and behavioural data. Ecological studies of Shetland Eiders, including remote tracking of individual movements throughout the year, would be extremely worthwhile in the context of the long-term major declines shown by this study, determining causal factors, and conservation of the rarest subspecies of Eider worldwide.
Supplemental Material
Download MS Word (19.5 KB)Acknowledgements
For coordinating and/or assisting with counts we are grateful to Martin Heubeck, Roger Riddington, Rory Tallack, Howard Towll, Helen Moncrieff and Newton Harper (Shetland), David Parnaby, Deryk Shaw, Nick Riddiford, Iain Robertson and Roger Broad (Fair Isle), and Penny Gear and Bob Furness (Foula). We are also grateful to the following boat skippers: the late Jim Dickson, Brian Edwardson, Victor Gray, Phil Harris, Peter Hunter, Robbie Leask, Alan Longmuir, Edmund Nicolson, Jerry Ramsay, George Lamont Williamson and Jonathan Wills. Shetland Islands Council kindly allowed access to their oil pollution surveillance flights, and Shetland Coastguard to a helicopter training exercise. Thanks go to Mike Harris, Sarah Wanless, Martin Heubeck and Roger Riddington for providing useful comments and feedback to improve the draft, and to Sjúrður Hammer for helpful information and discussions on Eider in the Faroes.
Additional information
Funding
References
- Aldará, J. & Jensen, J.-K. 2019. Gongdin hjá æðu, teista og heiðafugli í Nólsoy. FRØÐI 2/2019, Tórshavn.
- Birdlife International. 2021. Somateria mollissima. The IUCN Red List of Threatened Species, 2021. www.iucnredlist.org/species/22680405/166206891.
- Bjørnås, K.L. 2017. Population trends of breeding birds along the Swedish coast. MSc Thesis, Faculty of Science, University of Lund.
- British Trust for Ornithology Online Data. 2021. Wetland Bird Survey: indices and trends download, Eider – UK annual population index. British Trust for Ornithology, Thetford. https://www.bto.org/our-science/projects/wetland-bird-survey/publications/webs-annual-report.
- Camphuysen, K. & Heubeck, M. 2016. Beached bird surveys in the North Sea as an instrument to measure levels of chronic oil pollution. In Carpenter, A. (ed) Oil Pollution in the North Sea, 193–208. Springer International Publishing, Cham.
- Dunnet, G.M. & Heubeck, M. 1995. The monitoring of breeding seabirds and Eider. Proceedings of the Royal Society of Edinburgh 103: 137–164.
- Durinck, J., Skov, H., Jensen, F.P. & Pihl, S. 1994. Important Marine Areas for Wintering Birds in the Baltic Sea, Report to the European Commission. National Environmental Research Institute, Copenhagen.
- Ekroos, J., Fox, A.D., Christensen, T.K., Petersen, I,K, Kilpi, M., Jónsson, J.E., Green, M., Laursen, K., Cervencl, A., Boer, P., Nilsson, L., Meissner, W., Garthe, S. & Öst, M. 2012. Declines amongst breeding Eider Somateria mollissima numbers in the Baltic/Wadden Sea flyway. Ornis Fenn. 89: 81–90.
- Foxton, P. & Heubeck, M. 1995. Response to the Esso Bernicia oil spill. Proc. Roy. Soc. Edinburgh 103B: 233–245.
- Furness, R.W., Mable, B., Savory, F., Griffiths, K., Baillie, S.R. & Heubeck, M. 2010. Subspecies status of Common Eider Somateria mollissima in Shetland based on morphology and DNA. Bird Study 57: 330–335.
- Hammer, S., Madsen, J.J., Jensen, J.-K., Pedersen, K.T., Bloch, D. & Thorup, K. 2014. The Faroese Bird Migration Atlas. Faroe University Press, Tórshavn.
- Heubeck, M. 1987. Changes in the status of the Common Eider in Shetland, 1977-1984. Scott. Birds 14: 146–152.
- Heubeck, M. 1993a. Moult flock surveys indicate a continued decline in the Shetland Eider population, 1984-92. Scott. Birds 17: 77–84.
- Heubeck, M. 1993b. SOTEAG Ornithological Monitoring Programme 1993 Summary Report. Shetland Oil Terminal Environmental Advisory Group, University of Aberdeen, Aberdeen.
- Heubeck, M. 1995. Shetland beached bird surveys: national and European context. Proc. Roy. Soc. Edinburgh 103B: 165–179.
- Heubeck, M. & Mellor, M. 2013. Recent changes in the status and distribution of moulting Common Eider Somateria mollissima in Shetland. Seabird 26: 71–86.
- Heubeck, M. & Richardson, M.G. 1980. Bird mortality following the Esso Bernicia oil spill, Shetland, December 1978. Scott. Birds 11: 97–108.
- Jones, P.H. & Kinnear, P. 1979. Moulting Eider in Orkney and Shetland. Wildfowl 30: 109–113.
- Keller, V., Herrando, S., Voříšek, P., Franch, M., Kipson, M., Milanesi, P., Martí, D., Anton, M., Klvaňová, A., Kalyakin, M.V., Bauer, H.-G. & Foppen, R.P.B. 2020. European Breeding Bird Atlas 2: distribution, abundance & change. European Bird Census Council & Lynx Edicions, Barcelona.
- Kilpi, M., Lorentsen, S.H., Petersen, I.K. & Einarsson, A. 2014. Trends and Drivers of Change in Diving Ducks. Nordic Council of Ministers, Copenhagen.
- Knudsen, E. 2019. On the origin of the Common Eider, Somateria mollissima, in the Faroe Islands and Iceland. MSc Thesis, Faculty of Life and Environmental Sciences, University of Iceland.
- Kurvinen, L., Kilpi, M., Nordström, M. & Öst, M. 2016. Drivers of decline and changed nest-site preference of the Baltic Eider: an island-level analysis from south-western Finland. Ornis Fenn. 93: 55–66.
- Lehikoinen, A., Christensen, T.K., Öst, M., Kilpi, M., Saurola, P. & Vattulainen, A. 2008. Large-scale change in the sex-ratio of a declining Eider Somateria mollissima population. Wildl. Biol. 14: 288–301.
- Miles, W.T.S. & Mellor, R.M. 2019. SOTEAG Ornithological Monitoring Programme in Shetland, Annual Report 2019. Shetland Oil Terminal Environmental Advisory Group, University of St Andrews, St Andrews. www.soteag.org.uk.
- Miles, W.T.S. & Mellor, R.M. 2020. SOTEAG Ornithological Monitoring Programme in Shetland, Annual Report 2020. Shetland Oil Terminal Environmental Advisory Group, University of St Andrews, St Andrews. www.soteag.org.uk.
- Miles, W.T.S. & Mellor, R.M. 2021. SOTEAG Ornithological Monitoring Programme in Shetland, Annual Report 2021. Shetland Oil Terminal Environmental Advisory Group, University of St Andrews, St Andrews. www.soteag.org.uk.
- Mullineaux, E. & Keeble, E. 2016. BSAVA Manual of Wildlife Casualties, 2nd ed. British Small Animals Veterinary Association, Quedgeley.
- Olsen, B. 2011. Heiðafuglur í Skúvoy 2010. Frágreiðing frá Havstovuni, Tórshavn.
- Pennington, M., Osborn, K., Harvey, P., Riddington, R., Okill, D., Ellis, P. & Heubeck, M. 2004. The Birds of Shetland. Christopher Helm, A&C Black Publishers Ltd., London.
- Pipoly, I., Bokony, V., Kirkpatrick, M., Donald, P.F., Székely, T. & Liker, A. 2015. The genetic sex-determination system predicts adult sex ratios in tetrapods. Nature 527: 91–94.
- ProgrammingR.com. 2022. Arcsine Transformation in R. ProgrammingR.com, beginner to advanced resources for the R programming language. www.programmingr.com/tutorial/arcsine-transformation.
- R Core Team. 2019. R: A language and environment for statistical computing. R Foundation for Statistical Computing, Vienna, Austria. https://www.R-project.org/.
- Ramula, S., Öst, M., Lindén, A., Karell, P. & Kilpi, M. 2018. Increased male bias in eider ducks can be explained by sex-specific survival of prime-age breeders. PLOS ONE 13: e0195415. doi:10.1371/journal.pone.0195415
- Ritchie, W. & O’Sullivan, M. 1995. The Environmental Impact of the Wreck of the Braer. The Scottish Office, Edinburgh.
- Seatrack. 2021. Seatrack Seabird Tracking Online Data: Common Eider, Faroe Islands, all seasons, all years 2014 to 2020. Seatrack, SEAPOP, Norwegian Institute for Nature Research / Norwegian Polar Institute / Tromsø University Museum, Tromsø. https://seapop.no/en/seatrack/.
- Shetland Biological Records Centre. 1970–2021. Database of Eider Records in Shetland, 1970 to 2021 (Archive Data, Unpublished). Shetland Biological Records Centre, Shetland Amenity Trust, Lerwick, Shetland .
- Shetland Bird Club Annual Reports. 2000-2020. Bird Ringing in Shetland Annual Report, 2000 to 2020. Shetland Bird Club, Lerwick.
- Skov, H., Heinänen, S., Žydelis, R., Bellebaum, J., Bzoma, S., Dagys, M., Durinck, J., Garthe, S., Grishanov, G., Hario, M., Kieckbusch, J.J., Kube, J., Kuresoo, A., Larsson, K., Luigujoe, L., Meissner, W., Nehls, H.W., Nilsson, L., Petersen, I.K., Roos, M.M., Pihl, S., Sonntag, N., Stock, A., Stipniece, A. & Wahl, J. 2011. Waterbird Populations and Pressures in the Baltic Sea. Nordic Council of Ministers, Copenhagen.
- Smith, W.E. 2006. Moulting Common Eider devoured by Killer Whales. Br. Birds 99: 264.
- SOTEAG (Shetland Oil Terminal Environmental Advisory Group) Ornithological Monitoring Reports. 1978 to 2020. SOTEAG Ornithological Monitoring Programme in Shetland Annual Reports 1978-2020 (Heubeck, M., Mellor, R.M. & Miles, W.T.S.). SOTEAG. University of Aberdeen & University of St Andrews. www.soteag.org.uk.
- Tjørnløv, R.S. 2019. Population dynamics of a declining flyway population of Common Eider Somateria mollissima. PhD Thesis, Department of Bioscience, University of Aarhus.
- Waltho, C. & Coulson, J. 2015. The Common Eider. T & AD Poyser, Bloomsbury Publishing, London.
- Wetlands International. 2012. Waterbird Population Estimates, Fifth Edition. Summary Report. Wetlands International, Wageningen. http://wpe.wetlands.org/bundles/voidwalkerswpe/images/wpe5.pdf.
- Woodward, I., Aebischer, N., Burnell, D., Eaton, M., Frost, T., Hall, C., Stroud, D. & Noble, D. 2020. Population estimates of birds in Great Britain and the United Kingdom. Br. Birds 113: 69–104.