
Abstract
The year 2022 got off to a relatively optimistic start for Indonesia’s economic managers. Notwithstanding the serious health and social outcomes inflicted by the Covid pandemic, the government had successfully minimised the economic fallout. It could reasonably contemplate a period of sustained economic recovery and rising prosperity in preparation for the 2024 national elections. However, the outlook began to deteriorate in the face of heightened global economic volatility and uncertainty: the economic and geostrategic ramifications of the Ukraine War, a sudden slowdown in the global economy, rising interest rates, historically high and volatile prices for some key commodities, international trade and transport disruptions, uncertainty about China’s current economic trajectory and persistent if (so far ) manageable Covid challenges. Nevertheless, the Indonesian economy is continuing its steady post-Covid progress: the return to 5% growth in late 2021 continued through to second quarter 2022, inflation remains moderate and living standards are slowly recovering. However, there are potentially major macroeconomic challenges on the horizon. In fiscal policy, there are many demands on the budget, yet there is limited fiscal space, and much of the increased budget revenue this year is again being allocated to subsidies. In monetary policy, there is concern that, as in many countries, the monetary authorities could be ‘behind the curve’ of rising inflationary pressures. In his 16 August 2022 speech, President Joko Widodo (Jokowi) emphasised the importance of the industrial sector and of ‘downstreaming’ as a means of accelerating industrial growth. Against this backdrop, and the sector’s sluggish growth for much of this century, the paper also surveys recent patterns of industrialisation and prospects for the future.
Para pelaku ekonomi Indonesia memulai tahun 2022 dengan optimisme. Tanpa mengesampingkan dampak serius kesehatan dan sosial yang diakibatkan oleh pandemi Covid, pemerintah telah berhasil meminimisasi keruntuhan ekonomi. Pemerintah dapat berfokus pada pemulihan ekonomi secara berkelanjutan dan peningkatan kemakmuran sembari menyongsong Pemilihan Umum 2024. Namun demikian, prospek ekonomi kembali memburuk di tengah naiknya gejolak ekonomi global dan ketidakpastian: ramifikasi ekonomi dan geostrategi dari perang di Ukraina, perlambatan mendadak perekonomian global, kenaikan suku bunga, tinggi dan bergejolaknya harga barang bagi beberapa komoditas utama, disrupsi perdagangan internasional dan transportasi, ketidakpastian mengenai arah ekonomi China dan persistensi tantangan-tantangan Covid. Perekonomian Indonesia meneruskan pertumbuhannya yang stabil pasca Covid: kembalinya pertumbuhan ke tingkat 5% pada akhir 2021 terus berlanjut ke Triwulan II – 2022, inflasi realtif rendah dan tingkat kelayakan hidup mulai pulih kembali. Namun, ada potensi tantangan makroekonomi besar di depan mata. Pada kebijakan fiskal, terdapat banyak permintaan untuk belanja, namun hanya sedikit ruang fiskal, dan banyak kenaikan penerimaan anggaran tahun ini dialokasikan untuk subsidi. Pada kebijakan moneter, terdapat kekuatiran bahwa otoritas moneter berada di belakang kurva kenaikan tekanan inflasi, sebagaimana terjadi juga di banyak negara lain. Pada pidato di 16 Agustus 2022, Presiden Joko Widodo menekankan pentingnya sektor industri dan hilirisasi sebagai alat akselerator pertumbuhan industri. Dengan latar belakang ini dan lambatnya pertumbuhan sektor industri sepanjang abad ini, tulisan ini juga mensurvei pola industrialisasi terkini serta prospek masa depannya.
SETTING THE SCENE: INDONESIA AND A TURBULENT GLOBAL ECONOMY
Indonesia is currently facing a period of heightened economic and geostrategic turbulence and uncertainty that is much more challenging than was evident when the three previous BIES Surveys were written. At the beginning of 2022 there was every prospect of a sustained economic recovery: Covid appeared to be transitioning from pandemic conditions to a manageable endemic, vaccination rates were rising in Indonesia and among its neighbours, domestic and international mobility restrictions were being eased quickly, and consumer and investor confidence was on the rise. The Indonesian economy grew at 5.2% and 5.4% in the first and second quarters of 2022 (year on year) and that momentum is very likely to be maintained throughout 2022.
However, a succession of serious economic and geostrategic shocks has clouded the international outlook. The latest forecasts indicate a significant slowing in global economic activity in 2022.Footnote1 First, the Ukraine War, which commenced on 24 February, triggered immediate and volatile price spikes in a small number of commodities—gas, wheat, fertiliser—in which Russia, and to a lesser extent Ukraine, are sizeable exporters.Footnote2 These prices rose because of trade sanctions (actual or prospective), deliberate withdrawal of supplies (the so-called friend-shoring behaviour ), and disruptions to production and transport networks. Trade with these two countries has been severely disrupted.
Second, inflationary pressures began to emerge in the second half of 2021, mainly in the advanced economies, in addition to several emerging market economies that have severe macroeconomic imbalances. The initial response of most major monetary authorities in these countries was cautious, mainly owing to concern that any monetary tightening could jeopardise the fragile economic recoveries then underway. However, by early 2022 it was evident that many monetary authorities were ‘behind the curve’ in their responses, and this in turn has prompted aggressive monetary tightening, most notably in the United States. These sharply rising interest rates have had two principal effects: a downward revisions in forecast global growth for 2022 and 2023, especially in advanced economies, and an increased likelihood of debt distress, and possibly default, in several highly indebted countries, mostly among the low-income group.Footnote3 The rising rates have also induced capital inflows into the advanced economies in search of higher yields (and also a flight to safety), resulting in the US dollar peaking at its highest rate in almost 30 years, on a tradeweighted basis. As a corollary, the resulting exchange rate depreciations (at least relative to the US dollar) have increased the nominal value of domestic-currency debt in the affected economies, especially those that borrow in foreign-currency denominated loans (the majority of poor countries). Moreover, this debt distress is occurring after two years of negative growth and rising indebtedness as a result of expanded fiscal support measures during the Covid pandemic.
A third factor has been the disruptions to international trade and commercial relations. The Ukraine War has seriously escalated pre-existing global trade tensions and disruptions. The effects have been especially serious in the case of wheat, where some major suppliers (notably India) have announced export restrictions, adding to rising prices and global food insecurity, as well as gas insecurity, particularly in relation to Russian exports to Europe. In this highly unstable environment there have also been secondary trade effects, particularly in food. These trade disruptions have further exacerbated pre-existing logistics problems that arose during the Covid pandemic. Rising transport costs and slowing supply-chain deliveries have forced firms to carry significantly larger inventories and, particularly in the globally integrated East Asian industrial supply chains, further disrupted output and added to inflationary pressures.
Fourth, the Chinese economy is slowing significantly, principally due to its pursuit of a ‘zero Covid’ strategy. The economy hardly expanded in the second quarter of 2022, while the latest estimates suggest that growth for the year may be less than 3%, the lowest in 40 years. China’s slowing growth will reverse the ‘locomotive effect’ that supported global economic activity during the Covid pandemic. Although its mobility restrictions mainly affect the movement of people, production and international trade have also been curtailed. Outward tourism from China is currently just a trickle. The inflamed geostrategic tensions across the Taiwan Straits that occurred in August 2022, the most serious of their type in over a decade, are further disrupting regional commerce.
A final point to emphasise is the highly uncertain nature of this outlook. The Ukraine War could end abruptly, although such a scenario currently appears very unlikely. When China relaxes its Covid restrictions its economy will likely bounce back quickly, although its domestic debt levels and property slump are cause for concern. The aggressive monetary policy in the United States and elsewhere may control inflation more quickly than is currently anticipated, especially if (as now appears evident) global food and energy prices begin to ease. The high transport costs and supply-chain disruptions may be a temporary disequilibrium that is overcome in 2023. But these are all conjectures.
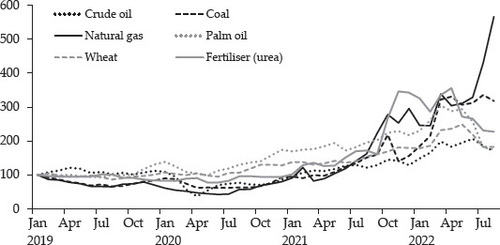
These developments necessarily frame our analysis of recent Indonesian economic developments and the immediate outlook. We examine the implications throughout the Survey. Here we briefly make five scene-setting observations, which together explain why, in 2022 at least, Indonesia is an exception to the gathering global economic gloom. First, for reasons discussed below, Indonesia’s inflation outcomes have to date differed from those of the advanced economies, particularly the United States (). Second, Indonesia has not been significantly affected by commodity price volatility (). As a net energy exporter, it has benefited from high coal and gas prices, as well as that of palm oil. On the downside, however, it is also a major wheat importer.Footnote4 Moreover, the benefits of high palm oil prices have been substantially lessened by the four-week export ban in April–May (see box 1).Footnote5 Further, as we discuss in detail below, the escalating fuel subsidies highlight a problem that has bedevilled successive administrations and they currently impose a major fiscal policy constraint as the government transitions back to its 3% fiscal deficit limit.
FIGURE 1 Global Inflation (%), January 2019 – August 2022
Source: Bloomberg (https://www.bloomberg.com/professional/datasets/).
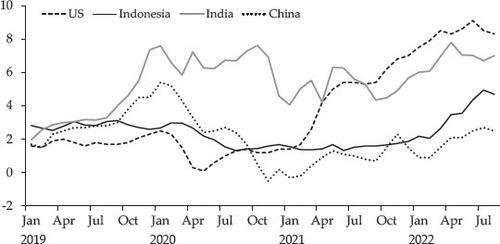
FIGURE 2 Commodity Prices ($), January 2019 – August 2022 (January 2019 = 100)
Source: World Bank (Citation2022).
Note: Crude oil price reflects the average spot price of Brent, Dubai and West Texas Intermediate, equally weighted. Natural gas index (Laspeyres), average of Europe, United States and Japan (LNG, liquefied natural gas), weights based on 5-year average consumption volumes. Coal (South Africa), from January 2015, FOB (free on board) Richards Bay, NAR (net as received), 6,000 kcal/kg, sulfur less than 1%, forward month 1; 13 February 2017 – December 2017, thermal NAR netback assessment FOB Richards Bay 6,000 kcal/kg; during 2006 — 10 February 2017 thermal NAR; during 2002–05, 6,200 kcal/ kg (11,200 btu/lb), less than 1%, sulfur 16% ash; years 1990–2001, 6,390 kcal/kg (11,500 btu/lb). Palm oil (Malaysia), from January 2021, RBD, FOB Malaysia Ports; December 2001 – December 2020, RBD, CIF Rotterdam; previously Malaysia 5%, CIF Northwest Europe, bulk, nearest forward. Wheat (United States), no. 2 hard red winter Gulf export price; June 2020 backwards, no. 1, hard red winter, ordinary protein, export price delivered at the US Gulf port for prompt or 30-days shipment. Urea (Ukraine), prill spot FOB Middle East, beginning March 2022; previously, FOB Black Sea.
Palm oil is one of Indonesia’s main export commodities, but it sometimes creates a dilemma for the government as it is also the raw material for cooking oil. When the global palm oil price started rising in May 2020, accelerating sharply with the onset of the Ukraine War, Indonesian producers responded by increasing their export volumes, diverting supplies from the less profitable domestic market, where the domestic price for cooking oil was constrained by government decree. The retail cooking oil price ceiling was set by the government at Rp 14,000 per litre for premium packaged oil and Rp 11,500 per litre of bulk oil, effective 1 February 2022. The government also imposed a domestic market obligation (DMO) and a domestic price obligation to ensure domestic supplies. Not surprisingly, the low retail price resulted in a scarcity in the domestic market. Cooking oil disappeared from supermarket shelves. Social anxiety spread across the country as cooking palm oil is an important food commodity in Indonesia, owing to Indonesians’ love of gorengan (fried food). In response, on 28 April President Widodo ordered a ban on the export of certain palm oil products to ensure the domestic supply. A one-month export ban resulted in forgone export revenue of about $2 billion (equivalent to Rp 30 trillion) and, in turn, Rp 6 trillion of export tax revenue forgone. With the ban, there were also shortages in the global market, while Indonesian farmers received a lower price. Because of Indonesia’s dominant position in the global palm oil market, the short-term effect was another price hike globally. Subsequently, on 23 May the government lifted the export ban and sought to control exports by requiring exporters (mainly crude palm oil producers that also produce cooking oil) to supply the domestic market as a condition for securing an export quota. The government used an IT-based system to connect cooking oil producers and the National Single Window export platform. Initially, the government allowed a 1:3 DMO : export composition, which was later increased to 1:9. However, setting up the monitoring system took some time, and by the time the system was up and running the global market had adjusted, and the price had already started to decline sharply. By July 2022, however, export volumes had already recovered and exceeded those of April. The temporary export ban had further ramifications, as the trade minister was replaced, and for a period Indonesia had contributed to the growing sense of panic in global food markets.
A third positive for Indonesia is that rising global interest rates are not a major concern owing to its history of fiscal prudence. During the pandemic, public debt (narrowly defined) rose from 30.2% of GDP in 2019 to 38.1% as of June 2022, one of the lowest among emerging market economies. In addition, foreign ownership of government securities, which was a source of potential vulnerability in the 2013 ‘taper tantrum’ episode, has fallen sharply from 40% prior to the pandemic to less than 14% in September 2022. Fourth, as in the 2008 global financial crisis, Indonesia is less affected by global economic volatility and trade and cross-border mobility restrictions because it is less internationally oriented than most of its ASEAN and East Asian neighbours. Finally, Indonesia’s commercial relations with Russia (and Ukraine) are minimal. Pre-Covid, the two countries accounted for a minuscule share of Indonesian trade.
ECONOMIC RECOVERY IN TURBULENT TIMES
Introduction
Indonesia now appears to have regained its pre-Covid economic momentum of approximately 5% annual economic growth. The economy has not registered the post-Covid ‘bounce’ that some other developing economies (notably India) have, but that in part reflects the fact that Indonesia’s economic downturn was not as large as many of its neighbours. The fact that Indonesia has so far successfully navigated the deteriorating global economic environment marks a continuation of the credible management of economic shocks that was also evident during the three most recent episodes of global financial turbulence: the onset of the Covid pandemic in early 2020, the 2013 taper tantrum and the 2008 global financial crisis.
As Indonesia approaches the end of the Jokowi period, and when much of the national public discourse focuses on the manoeuvrings for the 2024 elections, the economy is therefore in relatively good shape. As was the case pre-Covid, however, with bolder reforms—some of which are highlighted in this Survey—the economy could grow faster. With the worst of the Covid era hopefully behind it, and with moderate debt and the country’s macroeconomic fundamentals remaining sound in spite of the many external shocks, this will constitute the principal challenge for Indonesian economic policymakers in the final year of the Jokowi era and in the next administration. The comparative economic growth figures during the 21st century are a reminder that Indonesia could grow faster. The total factor productivity estimates (that is, output growth less the growth in capital and labour inputs), as reported in for the period 1990–2020, reveal that, over the medium term, Indonesia is tending to lag several dynamic East Asian economies, most obviously China but also some of its ASEAN neighbours, notably Vietnam.
FIGURE 3 Comparative Total Factor Productivity, 1990–2018 (Index, 1990 = 1)
Source: Global Productivity Database, World Bank (https://www.worldbank.org/en/research/publication/global-productivity/).
Note: Adapted from Dieppe, Kilic Celik and Kindberg-Hanlon (Citation2020).
As a backdrop to economic recovery, Covid remains an ever-present factor in the transition from pandemic to endemic status. Covid cases rose sharply in the first quarter of this year, peaking at similar magnitudes to those of mid-2021 ().Footnote6 However, mortality estimates have been much lower during the latest episode, even though Indonesia has now largely phased out mobility restrictions.Footnote7 Like most of the world (with the notable exception of China), Indonesia has decided to ‘live with Covid’.
FIGURE 4 Covid-19 Update, January 2020 – September 2022
Source: WHO (https://covid19.who.int/data).
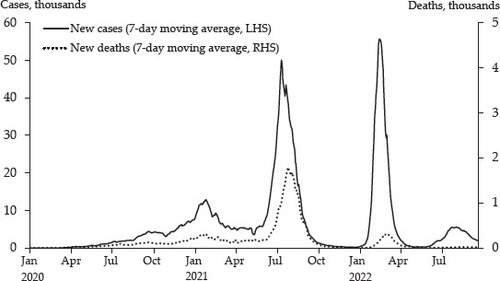
The difference between these two peak episodes is both striking and reassuring. Three main factors explain the lower mortality rates in the second period: higher vaccination rates, various preventive health measures and the fact that the Omicron variants have not been as serious as the earlier Delta variants. As of 1 September, as a percentage of the population aged six years and above, Indonesia’s vaccination rates are 86.7% and 72.9% for the first and second doses, respectively. However, the booster rate remains relatively low, at 25.9%.
The various health measures, instigated by a more activist minister of health from late 2020, include the rising use of telehealth and the use of masks in the cities. Aided by mobile phone technology, there is also progressive implementation of the requirement that persons using public transport and entering public buildings must show evidence of their Covid status and vaccination records, including booster shots. The use of the pedulilindungi app is being integrated within the Covid-19 monitoring system.
Economic Growth
The stronger economic momentum of 2022 is indicated by the fact that the economy grew by 5.0% and 5.4% (year on year) in the first and second quarters, respectively. Indonesia is also one of the few developing economies currently with a brightening economic outlook.Footnote8
With the recovery underway, it is useful to look back through the Covid and recovery eras to understand how the main economic sectors have performed. The intersectoral variations are substantial and, in some cases, may be a portent of future structural change. In we track these changes in sectoral output across four points in time. These are the second-quarter national accounts statistics for the latest period (that is, April–June 2022), with the recovery well underway; for 2021, corresponding to the pandemic’s low point; and for 2020, at its early stage. They are all indexed to second-quarter 2019 output, that is, prior to the pandemic. On the basis of their post-2019 output trajectories, we further classify the sectors into four groups: ‘resilient’, in which output consistently remained above pre-Covid levels; ‘quick recovery’, in which output initially dipped but had recovered by Q2/2021; ‘slow recovery’, in which output fell, in some cases significantly, but by Q2/2022 had recovered to pre-Covid levels; and the one case, construction, where output remains (very marginally) below that of Q2/2019.
Table 1. Sectoral Economic Growth, 2019–22 (2010 Constant Prices, Rp Million, Output in 2019 Q2 = 100)
The picture that emerges more or less confirms casual observations and reflects the interplay of demand- and supply-side influences. Covid massively accelerated the transition to the digital world, so that ‘contactless’ and low-contact economic activities boomed. Hence the information and telecommunications sector grew rapidly, continuing the trend of fast growth. Agriculture, forestry and fisheries also remained resilient, owing to both supply-side factors (less disruption to production) and consumer demand for essentials. This resilience continues a pattern from previous crisis episodes, most notably the Asian financial crisis (AFC), albeit with the difference that a ’back-to-the-farm’ survival strategy during Covid was limited owing to mobility restrictions and the now much smaller agricultural share in the economy. In addition, several smaller sectors grew quite fast: health and social services, for obvious reasons, and the essential utilities sectors. The adjustment to working from home explains outcomes in the education and real estate sectors.
Four sectors had small declines in output followed by quick recovery. These include mining, buoyed also by rising prices since 2021; the public sector, once the transition to remote work and the introduction of the fiscal stimulus measures were effected; trade, again following the transition to online shopping; and other utilities. Manufacturing, to be discussed in detail in the following section, also recovered as factories reopened and international trade resumed.
The sectors most adversely affected by the mobility restrictions were transport, accommodation and restaurants. They also declined as consumers deferred spending on ‘non-essential’ items. However, they recovered quickly once the mobility restrictions and shutdowns were lifted, and output now exceeds pre-Covid levels. Tourism, both domestic and increasingly international, is rebounding strongly, especially with the phasing out of international entry restrictions. Indonesia received 13 million foreign tourists in 2019, a number that collapsed to 141,000 in 2021. The numbers through to April this year have already exceeded the total for 2021, and by end-July had exceeded 1.2 million. Inbound tourism is growing rapidly and will accelerate further once China’s travel restrictions are eased.Footnote9
We then apply the same methodology to the expenditure accounts (). Two outcomes deserve particular comment. First, as the net export figures show, the international trade sector has been a positive economic contributor through the pandemic and recovery phases. Both exports and imports declined as the pandemic hit, but imports declined faster, as consumers deferred certain expenditures and firms ran down their inventories. However, by mid-2021 both had fully recovered, exports especially. The strong growth has continued into 2022, with exports benefiting from rising commodity prices. We look at these trade outcomes in more detail below. The second observation is that government consumption has evidently not provided a major economic stimulus. Initially it declined in line with GDP as a whole. It recovered modestly in 2020–21 as stimulus measures took effect, but then tapered off as these initiatives were wound back. Household consumption has closely followed movements in GDP throughout the period, indicating that, unlike some crisis episodes, there has not been any pronounced inter-temporal consumption smoothing. The significant government transfers to households cushioned poor and vulnerable households to some extent. The government injected Rp 216.6T in 2020 and Rp 167.7T in 2021, mainly to the lowest-income households. As would be expected, investment fell faster as the pandemic hit, but it has slowly recovered since.
Table 2. GDP by Expenditure, 2019–22 (2010 Constant Prices, Rp Million, Output in 2019 Q2 = 100)
Monetary Conditions
Consumer price inflation has been increasing in Indonesia but, as noted in , at a slower rate than in most advanced economies and several developing economies. Consequently, Bank Indonesia has not been under pressure to raise interest rates as aggressively as in these economies. That is, it has been able to delay its monetary tightening strategies until quite late in the year and the economic recovery cycle. Liquidity in the banking sector has been ample, so there has not been the imperative to adopt exceptionally loose monetary policy. During the pandemic, from early 2020 to July 2022, the growth of ‘third-party’ funds in the banking sector was 10% on average, and higher still for demand deposit (18.5%) and savings (12%). The growth of third-party funds was much higher than the average growth in 2019 of 6.9%.
We now briefly examine several dimensions of current monetary conditions and policy. Four factors explain Indonesia’s moderate inflation to date (). First, the Covid-era fiscal stimulus measures were quite modest, certainly compared to most rich economies, with the increment to the fiscal deficit of about four percentage points of GDP in 2020, and they have been wound back quickly (see next section). Second, Indonesia’s labour market conditions differ from those in advanced economies, in which large stimulus measures have led to very tight labour markets and rising wages. Indonesia is still a ‘surplus labour’ economy in many respects, and there is no evidence of significant wage pressure. Third, the high energy subsidies (see next section) are moderating some of the inflationary pressures that would otherwise have emerged. In budgetary terms, this is a costly anti-inflation strategy, but at least in the short run it enables Bank Indonesia to maintain lower interest rates than would otherwise be the case, and thus its stimulative monetary policy settings during the economic recovery. Fourth, rice prices have remained fairly stable thanks to recent weather conditions contributing to good Indonesian harvests and global market conditions. The earlier worry that they would follow wheat prices upwards has not materialised. Even though the weight of rice in the consumer price index (CPI) basket has declined to 3.3%, rice prices remain a sensitive barometer of economic welfare.
The moderately rising aggregate inflation shown in in fact conceals considerable price volatility in certain market segments. This is shown in , which decomposes the average into various components. The fastest increase is occurring in producer prices. This reflects the influence of (unsubsidised) rising commodity prices, mainly for certain mineral commodities. Since consumer prices have risen more slowly, it suggests the possibility that some business profitability is being squeezed, and that there could be pent-up inflationary pressures that may surface in the near future.
FIGURE 5 Inflation (%, Year on Year ) and Bank Indonesia Policy Rate (%, Annual), January 2019 – September 2022
Source: Bank Indonesia, 2022 (https://www.bi.go.id/id/default.aspx).
Note: The latest data for inflation are for August 2022.
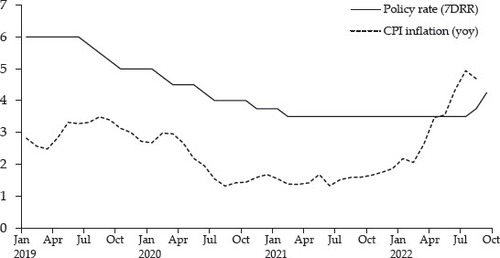
FIGURE 6 Inflation by Type (%, Year on Year ), January 2020 – September 2022
Source: Bank Indonesia, 2022 (https://www.bi.go.id/id/default.aspx).
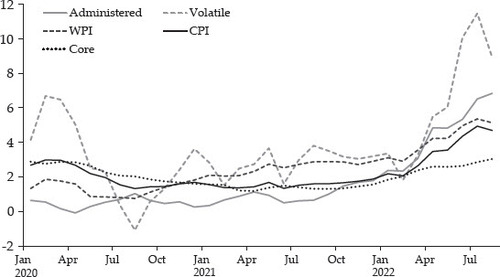
All the CPI series are trending upwards, albeit at varying rates of increase. The ‘volatile’ series mainly reflects price movements in unsubsidised food and energy prices. (To an extent that puzzles outsiders, movements in chilli and onion prices continue to register in headline news.) Administered prices have been held down by government decree but are inevitably rising somewhat. Reassuringly for Bank Indonesia, the ‘core’ series is showing only a moderate rate of increase.
Bank Indonesia maintained its policy rate of 3.5% through until August 2022 when it was raised to 3.75%. Rates were raised again in September, this time by 50 basis points, a move thought to be triggered in part by the government’s decision to raise subsidised fuel prices in early September. Bank Indonesia has therefore maintained its negative real interest rate settings, either marginally or substantially depending on which price series it is measured against. Is it ‘behind the curve’, as was evident in the case of the US Fed and others earlier in the year? It is too early to be definitive. On the one hand, there is some price pressure in the pipeline. However, the international economy is slowing, global food prices are easing, and further steep energy price increases are considered unlikely. Moreover, the August– September rate rises can be expected to restrain inflationary expectations. In effect, Bank Indonesia is sending a signal that it will be prepared to act if inflation does not moderate.
Managing the exchange rate in this turbulent global environment has been challenging. Formally Bank Indonesia continues to adhere to its floating rate regime with limited intervention in the foreign exchange market. A quarter century after the AFC, however, policymakers remain nervous about sudden downward movements (depreciations) in the closely watched Rp–US dollar rate. As noted, the US dollar is currently at historically high levels. Therefore, pegging closely to the dollar has meant that, since the rupiah has declined only marginally (3.1%) against the dollar in the year to late August, it has consequently appreciated against the currencies of most of its other major trading partners. The appreciation is particularly evident in the case of the yen and the euro, rising by about 16% and 12%, respectively, over this period. (Movements in the Rp:yen rate are shown in .) Indeed, among the G20 economies, only the currencies of resourcerich Saudi Arabia, Canada, Brazil and the special case of Russia have appreciated against the rupiah.
FIGURE 7 Exchange Rates, Rupiah against Japanese Yen and US Dollar
Source: Bank Indonesia, 2022 (https://www.bi.go.id/id/default.aspx).
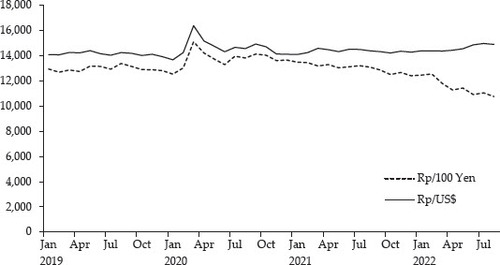
In fact, Bank Indonesia has been intervening modestly in the market to support the currency. Since Indonesia’s balance of payments have been in surplus in recent months, the decline in its foreign exchange reserves approximately indicates the magnitudes of Bank Indonesia’s intervention. For example, between February and July reserves fell by about $9 billion; almost half the decline occurred in the month of July as aggressive US Fed interest rate policy attracted mobile capital to that country. Further interventions in the foreign exchange market are thought to have occurred in September as the rupiah breached the psychological threshold of 15,000 to the dollar. The rupiah appreciation is modest and also broadly consistent with Indonesia’s rising terms of trade during the commodity boom. Whether this intervention was necessary or desirable is debatable. In its absence, tradable goods activities would have enjoyed a slight improvement in their competitiveness. But the episode does serve as a reminder that, although Bank Indonesia is a professional and independent agency, the authorities still worry about downward movements in the Rp:US dollar rate. Memories of the traumatic events of 1997–98 persist, and the ‘fear of floating’ syndrome has not altogether disappeared.
The balance of payments during the Covid-era recession and recovery reflect the interplay of various domestic and international factors (). The current account deficit initially shrank in 2020 as exports held up surprisingly well, mainly owing to the resilience of China and other Northeast Asian economies, while imports contracted with the declining GDP. These trends continued into 2021 and 2022, with strong export growth and recovering imports, resulting in small current account surpluses from third-quarter 2021 onwards. We examine one component of the export story—the performance of manufacturing—in more detail in the following section. The capital account displayed the expected crisisrelated patterns. Prior to the crisis there were strong inflows of both direct and portfolio investment. However, they diverged during the crisis: direct investment was reasonably stable, while portfolio investments have been volatile. They were negative at the outset of the crisis, followed by small positive inflows, then turned negative again in 2022 as interest rates rose in the US and elsewhere. Overall, then, the balance of payments has not been a source of major concern for policymakers after the April 2020 market turbulence. As noted, in spite of the rising global interest rates there is no evidence to date of a repeat of the 2013 taper tantrum episode that initially caught policymakers by surprise.
Table 3. Balance of Payments
The Fiscal Outlook
The fiscal outlook is comfortable for now. Given the turmoil of the past three years and the rising incidence of debt distress among developing countries, this is a major achievement. As noted, owing to the government’s history of fiscal prudence, Indonesia is emerging from the crisis with public debt equivalent to less than 40% of GDP. Moreover, since the 2013 taper tantrum episode there has been a concerted effort to reduce the reliance on foreign borrowings to finance the deficit, and the percentage of the debt that is foreign owned has fallen to less than 14%.Footnote10 The emergency fiscal stimulus measures over the three budget years 2020–22 were actually quite small and, with economic recovery proceeding, a return to the discipline of the Fiscal Law’s deficit below 3% of GDP in 2023 will therefore not be particularly onerous. These developments also illustrate another important dimension of Indonesian macroeconomic management, namely that fiscal deficits are not generally hostage to the electoral cycle.
The medium-term budgetary challenge is ongoing fiscal consolidation in the context of ever-increasing expenditure demands on the government. In this context there are two key parameters. The first and most ‘straightforward’ is a rate of economic growth that is at least equivalent to the size of the fiscal deficit relative to GDP. All else being equal, this ensures a stable debt position. Except for the Covid era, this has been the outcome ever since the Fiscal Law was introduced in 2003. The second and more difficult challenge is public sector resource mobilisation, both lifting the weak revenue base, currently just 10% of GDP, and spending the revenue efficiently. The fiscal outcomes in 2022 illustrate this challenge: the government is enjoying windfall gains from higher-than-expected commodity prices, but most of the increase is being allocated to subsidies, thus forgoing the opportunity to increase more productive investments.
The initial budget for 2022 envisaged total expenditure of Rp 2,714.2T and a deficit of 4.85% of GDP. In June the budget was revised to take account of the higher commodity prices. Forecast revenue was increased to Rp 2,266.2T (from an initial Rp 1,846.1T), while the expenditure estimate rose to Rp 3,106.4T, resulting also in a lower deficit of 4.5% (see ). The 2022 tax reforms (the 1% increase in VAT beginning April 2022 and voluntary asset declarations, among other things), increased coal royalties and other measures are also expected to boost revenue, by about Rp 61T. Meanwhile, Bank Indonesia’s ‘burden sharing’ role during the pandemic, through the purchase of government securities, is steadily declining as the deficit is lowered. By the end of 2022 they are likely to revert to zero, marking the end of a successful episode in ‘unorthodox’ monetary policy.
Table 4. The Budget
Looking forward, the 2023 budget deficit is projected to be 2.85% of GDP, based on revenue of about Rp 2,443.6T (83% of it from taxes) and expenditure of Rp 3,041T. Forecasting revenue in these turbulent times is a hazardous exercise, but the assumptions on which the estimates are made appear to be as sound as can reasonably be expected.Footnote11 On the expenditure side, 73% of the budget will be undertaken by the central government (including subsidies), while the residual (of Rp 811.7T), a slight increase on 2022, will be spent by local and village governments. In his 16 August address, the president emphasised five priorities: human capital; infrastructure, including the national capital project; bureaucratic reform and regulatory simplification; revitalisation of industry; and the green economy. All these sectors will receive significant allocations: education, Rp 608T; social protection, Rp 479T; health, Rp 170T; and infrastructure (including digital infrastructure), Rp 392T.
Most of the increased revenue has gone on subsidies. This reverses the trend of recent years. The Jokowi administration inherited subsidies equivalent to 3.7% of GDP, but these were reduced to 1.6% of GDP in 2015 and remained below 2% until 2021. In 2022, at an estimated Rp 502T, they are back to around 3% of GDP and in fact exceed the infrastructure budget (). How to protect the citizenry, especially the poor and near poor, in the face of rapidly rising food and energy prices and an uncertain economic outlook, is an issue that has bedevilled governments around the world. Ideally there would be temporary, targeted and needs-based programs. Indonesia in fact introduced targeted social assistance programs in the wake of the AFC, and these have been credited with partially protecting the poor in 2020 (Suryahadi, Izzati and Yumna Citation2021). However, these social protection measures were designed for ‘normal’ times and not the highly abnormal events of the past three years. A key consideration here is that, notwithstanding the progress to date, Indonesia’s national Unified Database (UDB) remains a work in progress, and it has not been possible to employ it for large-scale emergency subsidy allocations.
FIGURE 8 Subsidies
Source: Ministry of Finance (https://web.kemenkeu.go.id/en).
Note. The figure for 2022 is based on Presidential Regulation 98/2022 on Revised Budget.
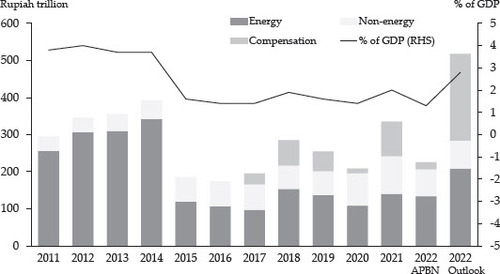
While ameliorating social tensions and assisting with lower inflation outcomes, these subsidies are a blunt and regressive instrument, as the minister of finance has reminded the DPR and the general public on several occasions. They also run counter to the government’s green economy objectives. For example, the poorest 40% of households consumed just 21% of the subsidised ‘petalite’ in 2020. With subsidies currently equivalent to almost 30% of total government revenue, growthpromoting investments have had to be trimmed. This includes the president’s cherished infrastructure and national capital projects and, in an era of heightened strategic uncertainty, some high-priority defence investments.
With any luck this will be a transitory problem, and more effective targeting will be feasible in the future. Global energy prices appear to have plateaued, and reform of the social protection system, including the establishment of a socio-economic registry based on a more complete UDB, is progressing. Reflecting this, subsidies for 2023 have been trimmed back to an estimated Rp 297T.
Taking a longer-term view over the past 50 years, these budgetary outcomes have again highlighted two enduring features of the political economy of Indonesian fiscal policy in both the democratic and Soeharto eras. These are fiscal prudence and a very cautious approach to debt, and limited fiscal space, further constrained by sometimes sizeable subsidies. The first has been an effective guard against economic crises, while the second has arguably somewhat constrained economic growth. As long as domestic energy prices are not allowed to move with international prices, the government will continue to be (unfairly) blamed for any price increases. There is no indication as yet that either of these features is about to change, even as Indonesia ascends through the ranks of the upper-middle-income group of countries.
A political economy challenge for the government remains—namely, how to permanently remove the subsidies in the least costly manner possible. A staged approach to subsidy reductions, accompanied by appropriate social protection measures, and ideally undertaken during a period of moderate international energy prices, is still arguably the best approach. But even over the past decade, when these conditions have been present, and governments have been politically secure, the reform has not been possible. Presumably a concerted public education campaign will be an essential precondition for reform. A similar set of arguments applies to efforts to permanently increase the tax effort. The government will need to persuade the community of the case for paying more tax, to fund improved healthcare, better education, a more extensive social welfare net, upgraded infrastructure, stronger national defence and much else, otherwise all these vital services will remain underfunded.
INDONESIA’S INDUSTRIALISATION OVER THE MEDIUM TERM
The focus of the Survey thus far has been economy wide. To gain additional insights, in this section we examine recent developments and key policy issues in the manufacturing sector.Footnote12 Manufacturing is the subject of much government attention, in particular the sector’s perceived malaise and the phenomenon of ‘deindustrialisation’. President Widodo’s 16 August speech this year was explicit on this issue, citing it as one of his five big agendas. To quote, ‘downstreaming and industrialisation must be done in our homeland to maximise added value’. Further, he pointed to what he considered a success story: ‘downstreaming [in the] nickel industry [which] has multiplied export of iron and steel by 18 times’.Footnote13 The inference is that this approach should be a guide for how Indonesia could industrialise on the basis of its natural resource endowments.
More broadly, the issue of industrialisation and industrial policy connects to a wide array of contemporary policy issues: how and by what means should the Indonesian government direct the allocation of resources across sectors; how should Indonesia engage with the global economy, and is it missing out on the opportunities created by globalisation; to what extent should sectoral policy be employed to advance particular policy goals, including balanced regional development, technological upgrading, employment generation, poverty reduction, gender equity and the economic advancement of pribumi business interests.
A review of recent industrial developments is also timely for this Bulletin since they have not been examined for some time. We focus on industrial developments during the recent pandemic as well as some broader medium-term issues.
Recent Developments
The recovery in manufacturing is evident through to the second quarter of 2022, growing at an annual rate of 4–5% over the past year. A recovery in demand, especially from domestic consumption since the last quarter of 2021, and stronger private investment since the beginning of 2022, have driven much of this growth. The World Bank (Citation2022) also highlighted the shift towards private consumption and private investment since the beginning of 2022. There has been strong growth in capital imports, cement sales and commercial vehicle sales over this period.
We examine developments in more detail with reference to the same four points in time annually as in . This is provided in with the raw data presented in . groups the industries by their recovery status relative to their output level in the second quarter of 2019, that is, ‘resilient’, ‘quick recovery’, ‘slow recovery’ and ‘not yet recovered’.
Table 5. Manufacturing GDP Growth (%, Year on Year ), Q1 2019 – Q2 2022
Table 6. Manufacturing Growth by Major Industry, 2019–22 (2010 Constant Prices, Rp Million, Output in 2019 Q2 = 100)
Consistent with the national accounts data presented above, most manufacturing sectors are resilient, recovered or on the way to recovery. The resilient sectors are chemicals and pharmaceuticals, basic metals, and food and beverages, while the sectors that have recovered after an initial downturn are furniture, machinery and equipment, transport equipment, leather and footwear, and paper products.
Some of these industries weathered the pandemic because of the inelastic demand for their products, especially so in the case of food and beverages. The recovered industries reflect the strong recovery in domestic consumption. The switch to work and school from home has likely been a positive for the furniture industry, while the high demand for masks and other health products sustained demand for paper products and the chemicals industry. In the case of transport equipment, fiscal incentives for the automotive industry have likely contributed.Footnote14
Several industries have recovered more slowly while a few are not yet back to their second quarter 2019 output level. The former includes wood products, electronics, rubber products, and textiles and garments. The slow recovery in textiles and garments, as well as in electronics, is because of the lagged consumer response as these products are not deemed necessities.
The picture at the company level more or less reflects the pattern at the industry level, although there is some variation by firm characteristics. While microdata for manufacturing are not yet available, the World Bank (Citation2022) has reported some variation in recovery rates across firm characteristics. For example, larger firms recovered more quickly than small and medium enterprises, probably because of their deeper pockets or established access to credit lines, while export-oriented manufacturers fared much better than domestically oriented firms. Also, not surprisingly, firms that adopted digital technology have been more resilient.
Productivity
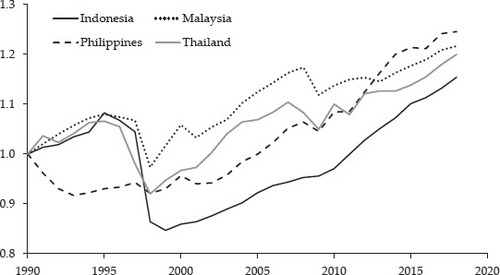
So much for the pandemic and immediate recovery. What are the prospects for manufacturing in the medium and longer term? A key variable here is Indonesian manufacturing productivity performance. reports the comparative picture for Indonesia and several other East Asian economies over the past three decades. Unlike the economy-wide estimates above, these refer just to labour productivity, owing to incomplete sectoral estimates for capital stock. In fact, the manufacturing picture is similar to that for the economy as a whole. With regard to productivity growth, Indonesia lags well behind China, and also Vietnam, but it is comparable to the Philippines and Thailand. In terms of levels, Indonesia is above only Vietnam. This slower growth is also reflected in the relatively small share of bank loans disbursed to the Indonesian manufacturing sector.
FIGURE 9 Manufacturing Labour Productivity, 1990–2021
Source: Asian Productivity Organization (https://www.apo-tokyo.org/wedo/productivity-measurement); Economist Intelligence Unit (https://viewpoint.eiu.com/data).
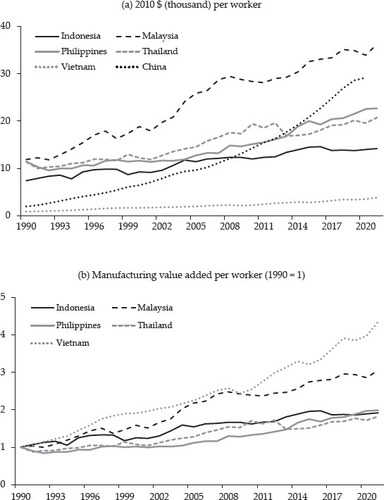
These numbers highlight a major challenge for Indonesia. Several factors explain the indifferent record. A key consideration is Indonesia’s rather weak participation in East Asia’s dynamic global value chains (GVCs) and production networks. Putra and Narjoko (forthcoming), for example, found that export intensity in the early 2000s was just 13.9%, a figure that is unlikely to have increased since then. This low participation rate reduces the incentive for local manufacturers to innovate. We return to this issue shortly.
Deindustrialisation
These comparative statistics on slow productivity growth and limited participation in East Asian production networks have triggered a vigorous policy debate, including as we have seen at the highest levels of government, on Indonesia’s alleged ‘deindustrialisation’. We now turn to this issue.
First a note on terminology. The term ‘deindustrialisation’ is invariably used loosely. In popular parlance, the definitions embrace an absolute decline in real manufacturing output (or employment), a declining share of manufacturing in GDP (or employment), or simply a slower growth of manufacturing output (or employment). In Indonesia, as elsewhere, the public discussion can and does include all three definitions.
presents trends in Indonesian manufacturing growth, and the share of manufacturing in GDP and employment since the early 1980s. Three general trends are evident. First, real manufacturing output has recorded positive growth in every year except for 1998 and 2020, that is, during the two economic crisis events since the late 1960s. Second, real manufacturing growth has slowed since the AFC. Prior to 1997–98, double-digit growth was the norm, whereas since 1999 longterm average annual growth has been closer to 5%. Third, since manufacturing has been growing more slowly than the rest of the economy in the latter period, its share of GDP has been steadily declining, from a peak of 32% in 2002 to the current figure of 19%. Interestingly, while the manufacturing employment share has always been lower than the output share, it has been relatively stable. In other words, manufacturing continues to be more capital-intensive than the other sectors, but its relative capital intensity has been declining this century.
FIGURE 10 Size and Growth of Indonesian Manufacturing, 1983–2021
Source: World Development Indicators, World Bank (https://databank.worldbank.org/reports.aspx?source=World-Development-Indicators).
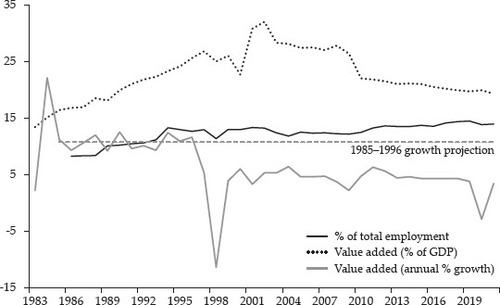
Whether Indonesia is experiencing deindustrialisation therefore depends on what definition is used. With reference to the three definitions above, Indonesia is not deindustrialising according to the first, but it is if the second or third definitions are employed. The above discussion could be extended further, for example by decomposition analysis, to examine the structural determinants of industrial composition.Footnote15
To be clear, and contrary to much popular discussion, there is no analytical case for targeting a particular share of manufacturing in GDP, or even a goal of an enlarged manufacturing sector share. The more important interrelated questions are why Indonesian manufacturing growth has slowed and why productivity growth is lagging. On this there is a general consensus about the causes of the slowdown after the AFC, especially in the first decade of the 21st century (see, for example, Aswicahyono, Hill and Narjoko Citation2011; Aswicahyono and Hill Citation2017): the business environment has become less certain, labour regulations have become more rigid, public investment in infrastructure has declined, barriers to the international movements of goods have risen and there has been ongoing ambivalence about the benefits of globalisation. Then there are a broader set of factors at work. One is China’s growing industrial prominence that has lowered the global price of manufactures, especially for middle-income competitor countries like Indonesia. Another is periodic resource booms that have had the familiar ‘Dutch disease’ effects of squeezing the profitability of other tradable sectors, including manufacturing.Footnote16
Global Production Networks
Indonesia’s indifferent performance in East Asian global production networks highlights one explanation for the slower industrial growth. These networks dominate the region’s economic landscape, accounting for more than half of intra-ASEAN and intra-East Asian merchandise trade. There is a large body of theoretical, empirical and methodological literature on this topic, and here we aim to distil the lessons from it as they apply to Indonesia.
There are generally four methods to account for a country’s participation GVCs (see Putra, forthcoming, for discussion). Among these, accounting for GVC trade through the product classification method provides the most comprehensive picture since it uses trade data, compared to alternatives that use less up-to-date, multi-country, input–output data. The product classification method assumes that a country’s trade in intermediate products more likely represents GVC trade than the country’s trade in final products. Thus, for example, the literature using this method typically employs trade in the machinery goods sector, since the product descriptions in this sector are quite explicit in separating machinery intermediates (often referred to as ‘parts and components’ or ‘PC’) and machinery final goods as compared to other sectors.Footnote17 It also needs to be noted that the machinery sector is among the top sectors traded through the GVC mechanism.Footnote18
, which shows shares in global PC exports and PC share of machinery exports, summarises our main results. In the discussion we also draw on additional empirical material that is available on request from the authors. With regard to the global share of PC and machinery exports for each of five ASEAN countries, Indonesia’s PC trade had fallen after the first wave of the Covid-19 pandemic, from around $10.9 billion in 2019 to $10 billion in 2020, but it then recovered to $12.8 billion in 2021. Over the longer term, Indonesia’s limited connection to the machinery GVCs is evident from the fact that its share of global PC exports in 2000–21 was just 0.38%. By comparison, Vietnam’s share has risen from 0.08% in 2000 to 2% in 2020, while Malaysia has maintained its historically substantial global share, of 3.1% in 2000 and 2.9% in 2021.
FIGURE 11 Country Share of Global Parts and Components (PC) Exports (%) and PC Share of Total Machinery Exports (%)
Source: UNComtrade (https://comtrade.un.org/); authors’ calculation.
Note: Classification of machinery parts and components (and final goods) is based on Kimura and Obashi (Citation2010).
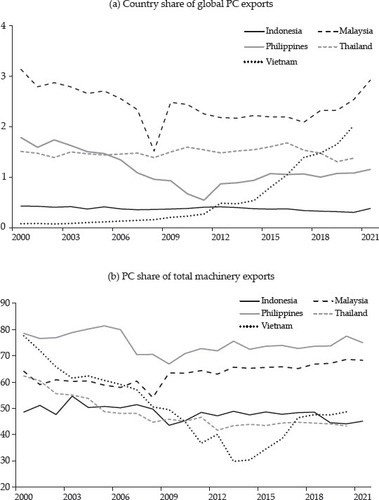
Indonesia has, however, performed better in some other sectors. Its land transportation equipment industry (HS 87) has made notable progress, from a global PC export share of 0.2% in 2000, rising to 0.8% in 2021.Footnote19 Indonesia is now becoming an increasingly important regional player in the automotive industry, following the regional leader Thailand. Likewise, the musical instruments industry (HS 92) has increased its global share of PC exports from 2.4% in 2000 to 4.2% in 2021, albeit with exports on a much smaller scale. (In 2021, musical instrument PC exports were just 2% of the value of land transportation equipment PC exports.)
There were disruptions to machinery GVC exports in 2020 and, although the recovery was swift in 2021, more disruptions are likely as high energy prices and the looming global economic slowdown will likely affect demand for these products. Beyond the immediate horizon, the longer-term challenge will be how to improve Indonesia’s competitiveness in these GVCs. The country could also seek to optimise the benefits from its numerous free trade agreement involvements, including the Regional Comprehensive Economic Partnership, which the DPR finally ratified in late August. Nevertheless, the major trade policy framework for these goods will continue to be the Information Technology Agreement, ITA II, introduced under the auspices of the World Trade Organization.
The broader picture is that the pandemic has not adversely affected manufacturing exports in aggregate (). In fact, exports jumped over the years 2020–22, reflecting their diversified structure. The major source of growth has been in two groups, food and beverages and basic metals. The former was driven by palm oil, at least until the April 2022 export restrictions (see box 1). In the case of the latter, it has been the export of the slightly processed nickel, in the form of nickel pig iron and ferronickel. There were both price and quantity effects at work in these cases. The surge in processed nickel exports has been caused by the export ban on raw nickel that was first implemented from 2014 to 2017 and was then reimposed in 2020. Among other manufactured exports, the general pattern was a decline in the early stages of the pandemic, followed by fairly quick recoveries from late 2020 onwards. The biggest contraction was in textiles, garments and automotive products, as consumers deferred the purchase of these non-essentials and overseas demand dried up. The China travel restrictions and the rising China–US trade and related geostrategic tensions are also encouraging firms to more actively pursue ‘China + 1’ trade and investment strategies, including to Indonesia.
Table 7. Export of Manufacturing Products, Q1 2019 – Q2 2022
Industrial Policy
The surge in the export of processed nickel deserves comment in the context of the government’s industrialisation strategy. The intention of the raw nickel export ban has been to build a battery and electric vehicle industry. On his trip to the United States in May this year, President Widodo had a widely publicised meeting with Elon Musk, the owner of Tesla. The issue is whether the export ban will effectively achieve this goal, or whether it will create an inefficient upstream industry that imposes high costs on downstream users. This is not a new policy approach for Indonesia, as ‘downstreaming’ (or hilirisasi) has been attempted in the past, for example in the wood and rattan sectors. The evidence from earlier episodes is mixed, with enforced export substitution often resulting in rent dissipation and inefficiency. The protected sector often results in a short-term boost to exports, but there is the risk of creating a high-cost manufacturing sector that is unable to compete in the GVCs. For example, in the case of the export ban on unprocessed rattan, introduced in 2012, and following a similar experiment in the 1980s, the benefits were enjoyed only by high-end furniture factories in Java. Smuggling and corruption also proliferated (Myers Citation2015).
As in some earlier periods, Indonesian industrialisation is at the crossroads. The issue is policies for industrial progress rather than industry policy. As historical experience has clearly shown, various trade policy interventions, a focus on domestic value added as a policy objective, enforced local subcontracting and other similar programs may accelerate industrial growth in the short run. But the danger is that these initiatives embed an uneconomic domestic cost structure that gets passed on to downstream users, not to mention the costs imposed on the non-favoured sectors elsewhere in the economy and the incentives created for rent-seeking. What is required is a rigorous and independent analytical scrutiny of these industrial policy interventions, alongside attention to the general business and regulatory environment and enhanced supply-side competitiveness.
SUMMING UP
As it navigates its way through a turbulent global economic and political environment, Indonesia is benefiting from its past macroeconomic prudence. Aided by strong commodity prices and a stable polity, the economy is back to, and for now slightly exceeding, its pre-pandemic trajectory, and living standards have mostly recovered. In the very near future Indonesia will again join the ranks of the upper-middle-income group of countries. It has emerged from the pandemic with very modest public debt levels by international standards, and so far has only moderate inflation. So, for now, the economic outlook is comfortable.
But there are storm clouds on the horizon. Most of the windfall revenue gains accruing to the government from the current commodity boom are going on subsidies that are inequitable, inefficient and contrary to the government’s green agenda. The subsidies are squeezing more productive supply-side investments and will therefore slow future growth. This year they will exceed the government’s entire infrastructure budget, frustrating several of President Widodo’s cherished investment projects. They are also inhibiting the delivery of the government’s social assistance programs, in particular its ability to target subsidies to the most-needy citizens. In effect, the government is captive to the country’s historic reluctance to allow domestic energy prices to be determined by the international marketplace. When prices rise, as at present, the government gets blamed unfairly for the effects of international developments over which it has no control. It is yet another illustration of the proposition that Indonesian policymakers prefer ‘stability’ (both economic and political) over ‘growth’.
Moreover, the country’s tax effort remains weak, with subsidies equivalent to more than a quarter of government revenue. Put simply, the government does not have the fiscal space to provide many of the goods and services that the community expects from it. In addition, given the uncertain outlook abroad, and the tightening fiscal and monetary policy settings at home, it will be difficult to maintain the current economic momentum in the run up to the 2024 elections.
The vigorous debate about industrialisation illustrates some of the current policy dilemmas. Manufacturing growth remains sluggish and the president is intent on ‘revitalising’ the sector. But the industrial policy debate is ambivalent and arguably directionless, as it has been in the past. Much of the policy narrative focuses on ‘downstreaming’, ‘hilirisasi’, and ‘maximising domestic value added’. Inevitably there is a tension between these objectives and the imperative of participation in the global economy, another of the government’s objectives. Indeed, with the partial exception of the automotive industry, Indonesia continues to play a relatively minor role in global production networks, which account for more than half of intra-ASEAN and intra-East Asian merchandise trade.
ACKNOWLEDGMENTS
The authors would like to acknowledge the excellent research assistance by Eko Wicaksono, Pyan Muchtar and Militcyano Sapulette. The opinions expressed in this article are those of the authors alone. For helpful comments and discussions, we thank without implicating the editors, participants at the ANU 2022 Indonesia Update, particularly our discussant, Riyana Miranti, and also Prema-Chandra Athukorala, Chatib Basri, Anne Booth, Howard Dick, Natasha Hamilton-Hart, Peter McCawley, Chris Manning, David Nellor and Arief Yusuf.
Notes
1 At the beginning of the year the IMF forecast global economic growth of 4.4%. By July this had been revised downward to 3.2%, with further downgrades likely, and the distinct possibility of a recession in several major economies.
2 For example, Russia is the world’s largest exporter of fertiliser (12.6% of the total), and the third-largest of mineral fuels (8.7%) and cereals (7.8%). Its global share of daily crude oil production is 11.3%. Ukraine is the second-largest exporter of cereals (7.9%) and third-largest exporter of vegetable oil (5.6%). See Trademap, 2022, https://www.trademap.org/Index.aspx
3 As of 31 July 2022, eight countries were in debt distress, 29 countries were considered to be at high risk and 25 countries were at moderate risk. See https://www.imf.org/external/Pubs/ft/dsa/DSAlist.pdf
4 Indonesia is the third-largest importer of wheat; in 2021 it imported 11.5 million tons. It is also a major global player in the instant noodle market. With its ubiquitous ‘Indomie’ brand, Indofood is the world’s largest instant noodle producer, with operations in several countries, mainly in Africa.
5 Indonesia is the world’s largest exporter of palm oil, accounting for 53.1% of the global trade.
6 As has been noted in previous Surveys, these numbers are almost certainly significant underestimates of both cases and mortality. The various ‘excess deaths’ estimates provide a more accurate estimate of the latter. For a comprehensive analysis of Indonesia’s Covid experience, see Witoelar and Utomo (Citation2022).
7 During the 2021 peak, mortality rates were about 3–4% of total reported case numbers, whereas during the 2022 peak the figure had fallen to around 0.5%.
8 One illustration of this improved outlook is the Asian Development Bank’s 2022 growth forecasts, prepared for its flagship Asian Development Outlook (ADO) publication. Although the differences are small, Indonesia was one of only three sizeable developing Asian economies for which the forecast was raised between the ADO’s December 2021 and July 2022 rounds.
9 This recovery is particularly important for tourism-dependent regional economies like Bali, which experienced the sharpest economic contraction of any province in the first year of Covid.
10 In principle, of course, with Indonesia’s open international capital market, domestic bond holders could also suddenly exit the market in times of increased financial volatility. However, in practice this is unlikely, as the major domestic bond holders are in fact the country’s large banks, which are majority government owned, and the central bank. In effect, therefore, these transactions are occurring within the extended public sector domain.
11 The assumptions are economic growth of 5.3%, inflation of 3.3%, the 10-year government bond rate of 7.9%, an exchange rate of Rp 14,759 per US dollar, an oil price of $90 per barrel, oil lifting of 660 barrels per day and gas lifting of 1,050 oil-equivalent barrels per day.
12 We use the terms ‘manufacturing’ and ‘industrialisation’ interchangeably, although, technically, in the national accounts, ‘industry’ includes manufacturing, mining, utilities and construction. But in the domestic policy context, and the general literature, ‘industrialisation’ generally refers to the manufacturing sector.
13 ‘State of the Nation Address of the President of the Republic of Indonesia’, 16 August 2022, https://cdn.setneg.go.id/_multimedia/document/20220816/2553ENG._PIDATO_PRESIDEN_KENEGARAAN_2022.pdf
14 In the first quarter of 2021 the government temporarily removed the luxury tax on the purchase of vehicles that are assembled domestically and with an engine size up to 1,500 cc.
15 See, for example, Tregenna (Citation2013), who used cross-country data over the period 1985–2005.
16 The China and resource-boom effects have, of course, applied to all resource-rich, middle-income economies, in some cases with even greater force. For example, the share of manufacturing in Brazilian GDP has declined much faster than in Indonesia, from 34% in the mid-1980s to just 11% in 2020 (The Economist, 5 March 2022).
17 For more detail see, for example, Kimura and Obashi (Citation2010), Athukorala and Menon (Citation2010), and Sturgeon and Memedovic (Citation2011).
18 This is based on the GVC measurement employed by Borin and Mancini (Citation2019), who use the OECD’s inter-country input–output table for the year 2018. Note that sectors like chemicals are also among the top traded sectors through GVCs, but they are less amenable to the product classification method since the sector’s intermediate and final products are not explicitly described in product codes.
19 The term ‘land transportation equipment’ is used here instead of ‘automotive’ since many of the parts and components of tractors, buses, trucks, cars and special purpose vehicles are combined in several single coded six-digit HSs.
REFERENCES
- Aswicahyono, H., H. Hill and D. Narjoko. 2011. ‘Industrialisation after a Deep Economic Crisis: Indonesia’. Journal of Development Studies 46 (6): 1084–108. doi: 10.1080/00220380903318087
- Aswicahyono, H. and H. Hill. 2017. ‘Indonesian Industrialization and Industrial Policy Catching Up, Slowing Down, Muddling Through’. In The Indonesian Economy, edited by L. Y. Ing, G. H. Hanson and M. Indrawati, 89–113. London: Routledge.
- Athukorala, P. and J. Menon. 2010. ‘Global Production Sharing, Trade Patterns, and Determinants of Trade Flows in East Asia’. Asian Development Bank Working Paper Series on Regional Economic Integration, no. 41. Manila: ADB.
- Borin, A. and M. Mancini. 2019. ‘Measuring What Matters in Global Value Chains and Value-Added Trade’. Policy Research Working Paper, no. 8804. Washington, DC: World Bank.
- Dieppe, A., S. Kilic Celik and G. Kindberg-Hanlon. 2020. ‘Global Productivity Trends’. In Global Productivity: Trends, Drivers, and Policies, edited by A. Dieppe, 49–82. Washington, DC: World Bank.
- Kimura, F. and A. Obashi. 2010. ‘International Production Networks in Machinery Industries: Structure and Its Evolution’. ERIA Discussion Paper Series 2010-09. Jakarta: ERIA.
- Myers, R. 2015. ‘What the Indonesian Rattan Export Ban Means for Domestic and International Markets, Forests, and the Livelihood of Rattan Collectors’. Forest Policy and Economics 50: 210–19. doi: 10.1016/j.forpol.2014.07.009
- Putra, C. T. Forthcoming. ‘GVC Indicators: A Survey and Application to RCEP’. ERIA Discussion Paper Series. Jakarta: ERIA.
- Putra, C. T. and D. Narjoko. Forthcoming. ‘Product Quality and Decision to Export: Case Study of Indonesian Manufacturing’. ERIA Discussion Paper Series. Jakarta: ERIA.
- Sturgeon, T. J. and O. Memedovic. 2011. ‘Mapping Global Value Chains: Intermediate Goods Trade and Structural Change in the World Economy’. Development Policy and Strategic Research Branch Working Paper 05/2010. Vienna: UNIDO.
- Suryahadi, A., R. A. Izzati and A. Yumna. 2021. ‘The Impact of Covid-19 and Social Protection Programs on Poverty in Indonesia’. Bulletin of Indonesian Economic Studies 57 (3): 267–96. doi: 10.1080/00074918.2021.2005519
- Tregenna, F. 2013. ‘Deindustrialization and Reindustrialization’. In Pathways to Industrialization in the Twenty-First Century: New Challenges and Emerging Paradigms, edited by A. Szirmai, W. Naudé and L. Alcorta, 76–101. Oxford, UK: Oxford University Press.
- Witoelar, F. and A. Utomo, eds. 2022. In Sickness and in Health: Diagnosing Indonesia. Singapore: ISEAS Publishing.
- World Bank. 2022. Indonesia Economic Prospects, June 2022: Financial Deepening for Stronger Growth and Sustainable Recovery. Washington, DC: World Bank.