
Abstract
Protectionism in Indonesia has been returning since the mid-2000s following a brief period of deregulation and liberalisation after the Asian financial crisis (AFC). This Survey reviews recent developments in Indonesia’s trade policy. It argues that the current approach to trade appears to vacillate between ambivalence, pragmatism and nationalism. Three cases are used to demonstrate the interplay between these characterisations: ‘downstreaming’ and local content requirement policies, Indonesia’s relationship with the World Trade Organization (WTO) and the proliferation of trade agreements, and the commodity balance sheet approach to trade. The paper argues that increasing trade and integrating further into the global value chains are important to have faster economic growth and one way to facilitate that is by improving logistics infrastructure.
BACKGROUND: STABLE INSIDE, SHAKY OUTSIDE
The global economy continues to face strong pressures. Despite slowly waning inflation, interest rates might remain high for the foreseeable future. As such, growth forecasts have been scaled back. For example, the Organisation for Economic Co-operation and Development (OECD) has revised its 2024 forecast of world economic growth from 2.9% in May to 2.7% in September (OECD 2023) and the International Monetary Fund (IMF) adjusted its forecast from 3% in July to 2.9% in October (IMF 2023a). The World Bank revised its 2024 growth forecast for East Asia and the Pacific from 4.8% in April to 4.5% in October (World Bank Citation2023a). In the United States, one of the most consequential policies introduced in August 2022 is the Inflation Reduction Act (IRA). The law aims to improve US competitiveness, innovation and industrial productivity, with clean energy being a focus. While the law should help the United States to honour its pledge to reduce greenhouse gas emissions, it is very protectionist, with policies on domestic sourcing and final assembly requirements frustrating US trade partners, and breaking World Trade Organization (WTO) rules (Kaufman, Saha and Bataille Citation2023). The IRA offers subsidies in the form of tax credits for companies whose clean energy production (such as those in the electric vehicle [EV] industry) takes place in the United States or whose materials (such as key minerals for EV batteries) are sourced from a country with which the United States has a trade treaty. As the world’s largest producer of nickel, Indonesia will be disadvantaged as it does not have a free trade agreement with the United States. Therefore, the Indonesian government is proposing a limited free trade agreement for its minerals shipped to the United States.Footnote1 However, this effort has proved challenging: the IRA also restricts access from ‘foreign entities of concern’, which includes China.Footnote2 Given that Indonesia’s battery-related projects benefit from big Chinese investment, it might be difficult to secure a special deal with the United States (Maulia Citation2023).
In contrast to most other countries that are still struggling with inflation, China is facing deflationary pressure. For the first time in more than two years, China’s headline consumer price index fell, by 0.3% in July, compared to the same month last year—although it rose back to 0.1% in August. As the world’s second-largest economy, China’s lacklustre post-pandemic demand will likely affect the rest of the world in two ways: it will help curb rising prices in other countries (especially those with significant imports from China) and it will hurt countries whose exports rely heavily on Chinese demand. Currently, 25% of Indonesia’s exports go to China and 30% of its imports come from China. Thus, overall, the current slowdown in China might not pose a severe threat to the Indonesian economy, although Indonesia’s trade flows might slow down a bit.
In addition to what is happening in the United States and China, as well as the continuing war in Ukraine (with upward pressure on world oil and food prices), another challenge is posed by a natural phenomenon: the El Niño climate pattern. The far warmer temperatures expected between late-2023 and mid-2024 might affect the rice harvest in Indonesia, which risks inflationary pressure. Some estimates, based on past experiences with El Niño, point to a cut of 3%–6% in paddy production, or a reduction in rice production of 1.1 million to 1.9 million tonnes this year (Tumangguang 2023). High rice prices will have a significant impact on poor and vulnerable people (Patunru Citation2021). In response to this threat, the Indonesian government planned to import 2 million tonnes of rice this year.Footnote3 By August 2023, it had imported around 1.2 million tonnes. Now the country is facing a significant increase in the world rice price after India banned the export of its rice.Footnote4 Despite these external challenges, the Indonesian economy is relatively sound. The next section summarises recent developments in economic growth, inflation, exchange rates, the stock market and the national budget.
ECONOMIC DEVELOPMENTS
Economic Growth
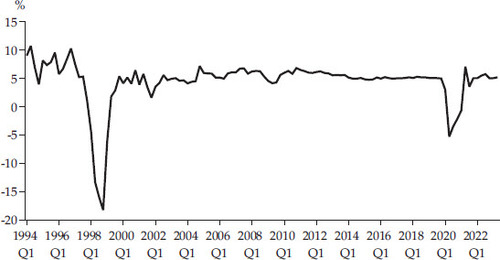
shows Indonesia’s economic growth trajectory since 1994. Three notable points are observed from this long series. First, the economy has clearly recovered from the Covid-19 pandemic. Growth in the second quarter of this year was the same as that in the last quarter of 2018 (in the second quarter of 2021, growth appeared to be much higher, but this was due to a ‘base effect’; that is, a rebound from negative growth in the previous quarters). Second, the Covid pandemic hit the economy much less severely than the Asian financial crisis (AFC) did. The deepest contraction due to Covid was –5.3% growth in the second quarter of 2020, compared to the –18.3% growth in the last quarter of 1998. Third, after the AFC, the growth rate has averaged around 5% for 20 years. While this rate is stable, it is clearly below the rate seen before the AFC.Footnote5 Some studies have noted that the main reason for this slow growth is increasing inefficiency, as reflected in the capital-to-output ratio (Gupta, Patunru and Gretton Citation2022).
FIGURE 1 GDP Quarterly Growth (% year on year), 1994–2023
Source: Statistics Indonesia (BPS).
The government, through the National Development Planning Agency (Bappenas), has launched a draft law of the National Long-Term Development Plan (RPJPN) 2025–45.Footnote6 It forecasts that Indonesia’s per capita income will reach around $23,000 per annum in 2045. This year, Indonesia regained its World Bank status as an upper middle-income country when its per capita income reached $4,580. The current threshold for classification as a high-income country is a per capita income of $13,845, implying that Indonesia would need a GDP growth rate of 6% to reach it. However, the country would need a growth rate even higher than that to meet the Bappenas income target of $23,000 per capita. Regardless of long-term projections like those in the RPJPN, Indonesia needs to maximise the growth of its national income to eradicate poverty more effectively.Footnote7
shows a breakdown of recent quarterly GDP growth. In terms of expenditure, consumption continues to be the main driver of the economy. In contrast to the large contraction in government spending in 2022 due to fiscal consolidation, government spending increased in the first two quarters of 2023, with growth in the second quarter exceeding 10%.Footnote8 Investment, too, has recovered (although there are dramatic differences across categories), with vehicles leading the growth.Footnote9 However, trade is slowing down: both export and import growth contracted in the second quarter. Export growth contracted owing mostly to the declining prices of coal and crude palm oil, while import growth contracted owing mainly to lower demand for raw materials and intermediate goods. This is consistent with trade dynamics at the global level. While world trade in goods and services rebounded in the first quarter of 2023, persistent inflation, financial vulnerabilities, the war in Ukraine and other geopolitical tensions suppressed trade in the second quarter, as projected in June by the United Nations Conference on Trade and Development (UNCTAD 2023).
Table 1. Components of GDP Growth (% year on year, 2010 prices)
In terms of sectors, transport and communication continue to drive the nontradable sector, indicating improving mobility (compared to mobility during the pandemic). Construction seems to have recovered too. Meanwhile, mining and quarrying, and manufacturing, grew faster than agriculture in the tradable sector. As noted in the previous Survey, the mining and quarrying sector is still driven by coal mining. As for manufacturing, the biggest contributors are crude palm oil production and the food and beverage industry.
Inflation
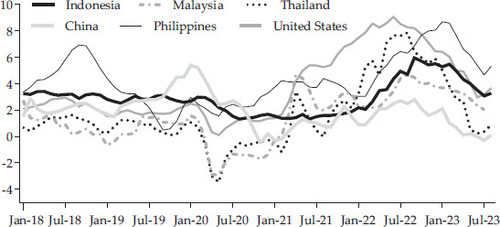
Compared with many other countries, Indonesia experienced only mild inflation during and after the Covid pandemic. Unlike in many advanced economies, the discussion about a ‘hard or soft landing’ has been virtually unheard of in Indonesia. compares Indonesia’s moderate inflation rate with the rates of the United States, Thailand and the Philippines, which all reached rates of close to 8% or above. Indonesia’s inflation has also been less volatile than Malaysia’s. On the other hand, China, as noted, experienced deflationary pressure in July. Threats of higher inflation in Indonesia for the final quarter of 2023 include El Niño (as discussed above), an increase in the prices of non-subsidised fuels (Pertamax Turbo, Dexlite and Pertamina Dex) in September, and the continuing volatility of world prices of oil and grain (for example, volatility due to oil production cuts by Saudi Arabia and Russia, and Russia’s suspension of its participation in the Black Sea Grain Initiative).
FIGURE 2 Monthly Inflation Rates (% year on year), January 2018 – August 2023
Source: Respective central banks through the CEIC database.
Exchange Rates
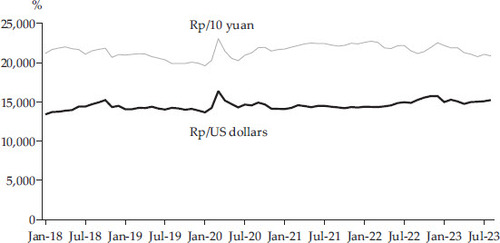
In terms of exchange rates, the rupiah is relatively stable (). During the pandemic, the highest depreciation (more than 10%) of the rupiah happened in March 2020, following two huge rate cuts by the US Federal Reserve of 50 and 100 basis points, respectively. Since March 2022, however, the Fed has been raising its interest rates. This includes four consecutive increases of 75 basis points from June to November 2022. shows, however, that the rupiah has remained stable during this time.Footnote10 As discussed in the previous Survey, Bank Indonesia has been intervening modestly in the market to support the rupiah. By the end of August 2023, the official foreign exchange reserve was $137.1 billion, only slightly down from $137.7 billion in July.
FIGURE 3 Exchange Rates: The Rupiah against the Yuan and US Dollar, January 2018 – August 2023
Source: Bank Indonesia.
Stock Market
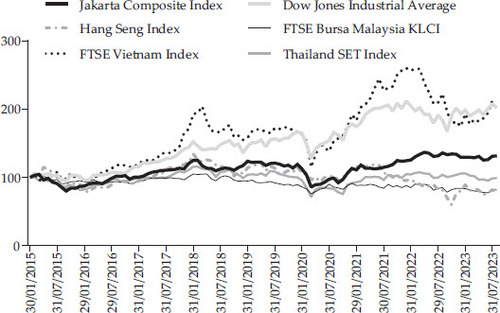
The exchange rate stability has been mirrored in the stock market. As shown in , the Indonesia Stock Exchange has been less volatile than some other markets. This relative stability continued even after the Covid pandemic was declared in March 2020.Footnote11 Since 2022, the Indonesia Stock Exchange has been driven primarily by industrial and consumer sectors. The Jakarta Stock Exchange Composite Index was recognised as the best-performing major index in Southeast Asia in 2022 (Karyza Citation2023).
FIGURE 4 Stock Market Indices (January 2015 = 100)
Source: Respective stock market indices through Bloomberg.
National Budget
shows the national budget for 2019 to 2022, along with revenue and expenditure estimates for 2023 and proposals for 2024.Footnote12 While the government appears to be on track to keep the budget deficit under 3% of GDP, there is a major drawback in the current budget: the return of big subsidies for energy, especially the fuel subsidy. The proposed energy subsidy in 2024 amounts to almost Rp 186 trillion— consisting of a fuel subsidy of Rp 26 trillion, a gas (LPG) subsidy of Rp 84 trillion and an electricity subsidy of Rp 76 trillion. In addition, there is ‘compensation for fuel and electricity’ of about Rp 136 trillion.
Table 2. Budget (Rp trillion), Selected Items
shows that the allocation for energy subsidies as a share of central government expenditure has been larger than that for social assistance. The latter includes funding for conditional cash transfers through the Family Hope Program (PKH), food aid through the Non-cash Food Assistance (BPNT) program, cash for poor students through the Smart Indonesia Program, higher education scholarships for the poor through Bidikmisi and a subsidy for health insurance premiums. Related to this, the increasing price of rice (as discussed above) might also have some fiscal consequences. The inflation pressure might not be completely offset by imports as the world supply of rice is also limited. Thus, the government needs to focus its fiscal resources on social protection programs such as PKH and BPNT. Considering that the fuel subsidy is regressive while most of the social protection programs are progressive, the budget posture appears to be socially suboptimal. In addition, the budget presents a disincentive for the energy transition away from fossil fuels to renewable energy, undermining Indonesia’s efforts to mitigate the worsening impact of climate change, as the previous Survey discussed.
TRADE DEVELOPMENT AND POLICY
The review of the key indicators above shows that the Indonesian economy has recovered from the pandemic and returned to a stable rate of growth of around 5%. However, Indonesia needs to grow faster if it is to become a rich country by 2045. This paper argues that one way to achieve a higher growth rate is through further engagement in global trade. Studies have suggested that countries that liberalise their trade regimes increase their economic growth significantly (Wacziarg and Welch Citation2008). Furthermore, there is unrealised potential for additional trade through global value chains (GVCs) (World Bank Citation2020). This section reviews current developments in trade policy in Indonesia.
Between Ambivalence, Pragmatism and Nationalism
Indonesia’s trade policy has been evolving for almost 80 years. Recent assessment of trade policy in Indonesia includes research by Pangestu, Rahardja and Ing (Citation2015), Patunru and Rahardja (Citation2015), and Patunru, Pangestu and Basri (2018).Footnote13 These studies all characterise Indonesia’s trade policy as being trapped between openness and protectionism for well over 50 years, since the beginning of the New Order regime. Recent developments show that this characterisation is still apt. That is, Indonesia’s recent approach to trade appears to vacillate between ambivalence, pragmatism and nationalism.
Hill and Pane (Citation2018) discuss the continuing widespread ambivalence towards globalisation that has resulted in missed opportunities for Indonesia, such as better job generation and poverty reduction. Such ambivalence is also reflected in Indonesia’s implementation of liberalising policies in some sectors but ‘harmful’ ones in other sectors.Footnote14 Furthermore, while pursuing numerous trade agreements, Indonesia is also becoming more protectionist. Recent examples include Indonesia’s effort to engage with countries such as Australia to secure the supply of lithium to develop the Indonesian EV battery industry while banning the export of Indonesian nickel ores.
The omnibus labour law (Law 11/2020 on Job Creation) shows the pragmatic face of Indonesia’s trade policy (Surianta and Patunru Citation2021). The law is intended to encourage trade and investment by improving the ease of doing business in Indonesia. It is arguably the most important institutional change after the reforms made in response to the AFC. Its broad coverage has made the law controversial, especially because it was introduced without extensive public consultation during the Covid pandemic. In November 2021, the Constitutional Court of Indonesia decided that the law was ‘conditionally unconstitutional’ and ordered the government to restart the legislative process. Failure to do so would result in permanent revocation of the law. It is not clear what the government has done to remedy the procedural flaws, but some of the current regulations addressing trade and investment have been issued without referring to the omnibus law—such as the regulation on the commodity balance sheet (neraca komoditas) discussed below.
Finally, nationalism in Indonesia’s recent trade policy is most obvious in the case of resource management (Warburton Citation2017; Aspinall Citation2018; Patunru Citation2018)—as illustrated by the nickel export ban discussed below.Footnote15 Often, this new nationalism is framed in anti-colonial and anti-imperialist tones. A recent example includes the government’s response to the recommendation from the IMF to unwind the mineral export ban (IMF 2023b). The minister of investment Bahlil Lahadalia told the press that President Joko Widodo had instructed him to fight and that the country’s sovereignty ‘must not be encroached by anyone, including the IMF’, while the coordinating minister for economic affairs Airlangga Hartarto called the IMF’s efforts ‘regulatory imperialism’ (Hadi Citation2023). The president reiterated his stance in a speech to the Indonesian Employers Association (APINDO) in July 2023, saying that ‘we should proceed with downstreaming at all cost, even if we are sued by WTO and warned by the IMF’ (State Secretariat 2023).Footnote16
As these characterisations are not mutually exclusive in that they often appear around the same time and under the same objective of industrialisation, we should not take each quote too literally. Nor is it possible to associate a policy or regulation with a single character. Instead, I use three recent developments to illustrate the interplay of these features of trade policy. They are the downstreaming strategy and local content requirements (LCRs), Indonesia’s approach to trade agreements, and the commodity balance sheet approach to trade. Prior to that, I review some recent trends in Indonesia’s trade, increasing protectionism and low participation in the GVCs.
Recent Trends
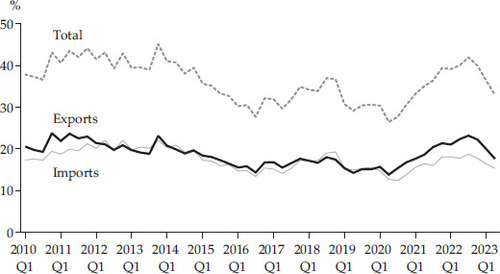
shows Indonesia’s exports and imports of goods and services as a share of GDP from 2010 to 2023. It indicates four facts. First, comparable to trade in other large countries with a big domestic market, trade as a share of GDP in Indonesia is around 45% at its highest.Footnote17 Second, exports and imports move closely together, suggesting that Indonesia’s exports are supported by imports of intermediate and capital goods (as discussed below). Third, the pandemic had only a brief negative impact on Indonesia’s trade flows. While Indonesia’s trade contraction was consistent with the global trend, it was milder, with trade down by only four percentage points in the second quarter of 2020 and recovering quickly in the third and fourth quarters.Footnote18 Fourth, since the third quarter of 2022, trade has been declining again. As noted, this is consistent with the global trend. In particular, trade in the second quarter of this year was affected by inflation and rising geopolitical tensions (UNCTAD 2023).
FIGURE 5 Exports and Imports of Goods and Services (% of GDP), 2010 Q1–2023 Q2
Source: BPS.
shows a breakdown of exports and imports in 2018 and 2022. Consistent with , it shows the importance of manufacturing and mining in exports (and the lesser importance of agriculture). At a further level of disaggregation, the share of base metal products increases significantly, suggesting a link to the claimed success of the downstreaming strategy (see below). Meanwhile, the share of coal also increased strongly, indicating a continuing contribution of this commodity, despite the objective of reducing Indonesia’s reliance on coal.
Table 3. Major Exports and Imports (% of total)
On the import side, the traditional pattern continues; that is, Indonesia’s imports are dominated by raw materials (intermediate goods) and capital goods. This implies that production in Indonesia still relies on imported content and, by extension, Indonesia’s exports are strongly dependent on imported materials, as noted above. This means promoting exports requires greater access to intermediate inputs to increase production. Pane and Patunru (Citation2023) demonstrate that an increase in the variety and total value of imported inputs increases the productivity of Indonesian manufacturing firms. The main benefits come from broader access to alternative inputs. These benefits are greater when the inputs originate from developed countries (such as Japan, the source of more than 15% of Indonesia’s intermediate inputs), suggesting that Indonesian firms also experience technology and product quality improvement. Newman, Rand and Tarp (Citation2023) discuss a similar result in the case of Vietnamese manufacturing firms. They find a positive association between imports into a sector and firm productivity, and a productivity premium for firms using imported inputs. Unfortunately, policies such as LCRs (discussed below) often deny domestic producers access to imported inputs. It is also often overlooked that a higher level of imports may indicate a larger inflow of foreign direct investment. Gupta, Patunru and Gretton (Citation2022) show that a growing trade deficit—imports exceeding exports—coincides with a rapid increase in investment in response to an improved business environment.
Increasing Protectionism
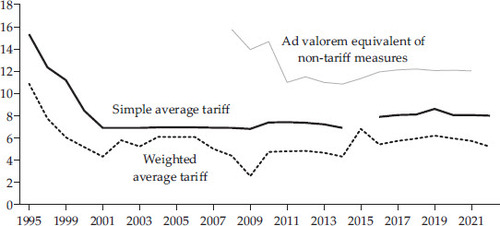
Protectionism in Indonesia has been on the rise again since the mid-2000s (Patunru and Rahardja Citation2015).Footnote19 While tariffs decreased after the mid-1990s, the use of nontariff measures (NTMs) has increased. More recently, even tariffs have risen again (). At the same time, the use of NTMs remains high, as shown by the bold black line representing the tariff equivalent of the measures.Footnote20 The tariff equivalent of NTMs in 2021 was 12%, far higher than the simple average tariff rate of 8%. If the NTMs are decomposed into their components (not shown), quantity restriction has the highest tariff-equivalent rate—around 30%.Footnote21
FIGURE 6 Tariffs and Non-tariff Measures (%)
Source: World Bank, WTO, World Tariff Profiles.
Notes: Simple average tariff data for 2015 are not available. NTMs include sanitary and phytosanitary measures, technical barriers to trade, pre-shipment inspections and other formality measures, quantity control measures, price control measures and other measures.
shows a breakdown of trade restrictions, based on the Global Trade Alert database.Footnote22 Relative to Malaysia, Thailand and Vietnam, Indonesia appears to be very protectionist. China, on the other hand, is even more protectionist, but most of its measures are classified as bailouts or state aid. In terms of export bans, export taxes, import bans, investment measures and LCRs, Indonesia has the most frequent use.
Table 4. Number of ‘Harmful’ Trade Measures Since 2015
Low Participation in the Global Production Network
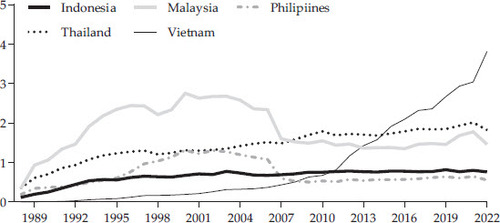
As noted, participation as a manufacturer in GVCs provides opportunities for economic growth driven by trade. Almost two-thirds of global trade now runs through GVCs. Thus, if Indonesia is to pursue a higher economic growth rate through trade, it must integrate further into GVCs or global production networks. While Indonesia’s export of commodities and raw materials is still relatively large, its participation in GVCs is limited mainly to simple manufacturing production chains.Footnote23 However, participation is still very low. As shows, Indonesia’s participation rate is comparable to the Philippines, but much lower than the rates of Malaysia, Thailand and especially Vietnam, which overtook Indonesia in 2011. The main reason for Indonesia’s lack of participation in the GVCs is the domestic policy environment and poor logistics (Surianta and Patunru Citation2021; Soejachmoen Citation2012; Patunru and Tarsidin Citation2012).
FIGURE 7 Share in World Exports of Manufacturing Value Chain Products (%)
Source: UN Comtrade.
Notes: Manufacturing value chain products are defined as parts-and-components products and final assembly products used in the global manufacturing value chain (GMVC) (Athukorala Citation2022). The GMVC is a subset of the broader concept of GVCs. The GMVC, however, includes only manufactured goods, while GVCs include primary products. Given that the GMVC is more closely related to industrialisation, it is used for this figure. Parts and components are a subset of intermediate goods, which are not sold in commodity exchanges, and final assembly is the residual of total exports net of parts and components in the same product category. The figures are based on the five-digit categorisation of the Standard International Trade Classification system (revision 3). At the aggregate level, this includes chemicals, resource-based products (e.g. textiles), machinery and transport equipment (e.g. electrical machinery and road vehicles), and miscellaneous manufacturing (e.g. furniture, apparel and clothing accessories). For example, vehicle ignition wires were the most exported parts and components, and footwear was the most exported final assembly product in Indonesia in 2022.
The Downstreaming Strategy and LCRs
Hilirisasi or downstreaming has been a popular industrial policy of President Widodo, especially in his second term. However, his predecessor, Susilo Bambang Yudhoyono, had also stressed the importance of this policy for Indonesian economic development. A key objective of the RPJPN 2005–25 launched under former president Yudhoyono was to increase the value added of the manufacturing sector. This objective remains in the current RPJPN for 2025–45 launched by President Widodo. The policy discourages the export of raw materials and calls for them to be processed locally. It is expected that this strategy will create more domestic employment and boost the overall growth of the economy through increased export earnings.
With the same objective of increasing domestic value added in particular sectors, the government complements its downstreaming policy with an LCR policy. This policy requires a certain level of government procurement of domestic inputs or products. It is a variant of an import substitution strategy, which artificially raises the prices domestic producers can charge. At the highest level, the LCR policy is implied in Law 3/2014 on Industry, which stipulates that ‘in order to empower domestic industry, the government is to increase the use of domestic products’ (article 85). A series of implementing regulations have been introduced under this mandate.Footnote24
Below are some recent examples:
Ministry of Industry Regulation 65/2016. Smartphone and tablet industries should use at least 70% local content in manufacturing, 20% in the research and development stage, and 10% in applications.Footnote25
Ministry of Health Regulation 17/2017. Pharmaceutical and medical equipment industries should use at least 25% local content in the research and development process and 35% in the production process.
Bank Indonesia Regulation 19/2017. Switching institutions (that process domestic electronic transactions) should be at least 80% owned by Indonesian citizens or entities. Computers and servers must be possessed in Indonesia.
Ministry of Industry Regulation 34/2017. The motor vehicle industry should produce all its major components within the country.
Presidential Regulation 55/2019. The EV industry should use at least 35% local content for vehicles with four or more wheels and 40% for those with two or three wheels. The percentage for vehicles with four or more wheels is to be raised to 80% in 2030. The percentage for those with two or three wheels is to increase to 80% by 2026.
Presidential Regulation 18/2020. Indonesia aims to increase the local content in its export products from an average share of 43% in 2019 to 50% in 2024.
Minister of Trade Decree 170/2022. The domestic market obligation imposed on exporters of crude palm oil will increase from 20% to 30% of the export volume.
The regulations above are quantitative requirements and targets. There is also a type of LCR that is less distortionary—that is, using incentives rather than quantity restrictions. An example is Ministry of Finance Regulation 20/2021, which assigns value-added tax exemptions to luxury cars on the condition that at least 70% of the car’s components are manufactured domestically.Footnote26
Both downstreaming and LCR policies run counter to the goal of joining internationally oriented GVCs, which involve the ‘slicing up’ of the production process across borders, and thus to the national objectives of achieving economic growth and generating employment under economic globalisation.
The emphasis on the share of domestic value added in exports as a policy criterion for an export development strategy is misguided (Athukorala and Patunru Citation2023). First, production for export markets requires the use of high-quality inputs procured at world market prices to maintain competitiveness (see Pane and Patunru Citation2023). Second, per unit value added in exports tends to decline in the era of global production sharing as a country specialises in a given task. Thus, total export earnings are driven by volume rather than per unit value added. Third, intermediate production (closer to raw materials) is typically capital intensive, whereas final assembly is labour intensive. Thus, shifting the domestic production structure towards the latter would stimulate the generation of better jobs. Fourth, in the case of resource-rich countries, most major producers export large amounts offshore for processing, as the domestic demand (and processing capacity) is far smaller (Roemer Citation1979). These are confirmed by Athukorala and Patunru (Citation2023) who showed that export expansion and employment generation in the Indonesian economy during 1995–2016 occurred when domestic value added remained virtually unchanged. Policymakers should thus focus on the export potential of industries rather than on the share of domestic value added in exports.
One of the most controversial components of the downstreaming policy is the export ban on nickel ore. This started under former president Yudhoyono, who saw it as a way of achieving ‘economic sovereignty’ (Warburton Citation2018). Since he took office in 2014, President Widodo has embraced this idea and made it one of his signature policies.
illustrates this case. In 2009, the Yudhoyono government issued Law 4/2009 on Mineral and Coal Mining (known as the Mining Law), which required mining companies to process their minerals in Indonesia. They were required to build smelters within five years, after which a total ban on ore exports would be imposed. As the figure shows, exports of nickel ore increased significantly between 2009 and 2014 as mining companies rushed to maximise exports during the fiveyear window.Footnote27
FIGURE 8 Exports of Nickel Ore and Derivatives ($ million)
Source: UN Comtrade.
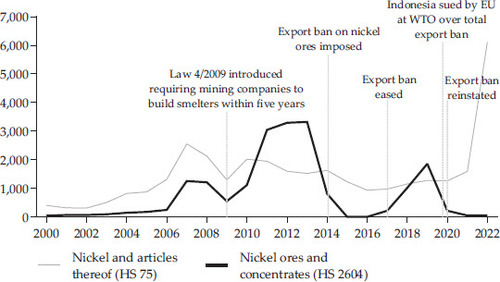
Following the imposition of the ban by President Widodo in 2014, nickel ore exports plummeted to zero in 2015 and 2016. However, due to difficulties in building smelters and the significant reduction in export earnings and the associated tax revenues, the government, in a seemingly pragmatic turn, partially relaxed the ban in 2017.Footnote28 As a result, exports of nickel ore increased again.Footnote29 The government also stated that the relaxation was temporary and that the full export ban would be reinstated in January 2022. However, in August 2019, it indicated that the ban would be reimposed in January 2020, prompting the European Union to file a complaint with the WTO in November 2019.
Following the reinstatement of the ban in January 2020, exports of nickel ore fell back to zero. The government claims that this policy has successfully added value in the downstream sector, and indeed shows that exports of ‘nickel and articles thereof’ increased very significantly after 2020.Footnote30
There are some issues with this claim of success, however. First, ‘value added’ refers to the income generated by labour and capital in the smelting process, and the policy overlooks the fact that extra value added will require the use of extra labour and capital in the nickel sector. Since the domestic supply of both is limited, one possibility is that they will be drawn from other sectors in the economy, which will result in reduced value added in those sectors. In other words, an increase in value added in the nickel sector will not translate into an increase in value added in the economy as a whole (unless there is some unexplained increase in overall productivity). And indeed, the policy has had no perceptible impact on manufacturing value added, nor on GDP.
Second, given that nickel processing is highly capital intensive, a large part of the increase in value added will materialise as a return to foreign capital rather than to Indonesians. That is, even if value addition in the aggregate is large, much of it will not stay in Indonesia as the government seems to expect, because smelting operations will be dominated by foreign companies. For example, in 2021 alone, China’s Tsingshan Holding Group invested almost $4 billion to set up a nickel smelter in the Morowali Industrial Park.Footnote31 Thus, it is important to remember that the ultimate aim of policy should be to increase national income, not output (that is, value added).
Third, there are likely to be unintended consequences, bearing in mind that Indonesia’s past experiments with logs and rattan did not end well. In October 2001, Indonesia banned exports of logs to support the development of local manufacturing industries (such as timber mills and furniture) and the conservation of forest areas.Footnote32 Resosudarmo and Yusuf (Citation2006) showed that neither of these objectives was met: on the contrary, the value of timber dropped, and the deforestation rate increased. In 2011, Indonesia banned exports of rattan—again to support the domestic furniture industry. Myers (Citation2015) shows that the policy served only elite interests and rattan smugglers.
Nevertheless, President Widodo seems adamant about pursuing the downstreaming strategy, and aims to extend this policy to other minerals. In June 2023, the government imposed an export ban on bauxite, with a plan to extend this to tin and copper soon (Yanwardhana Citation2023). It is difficult to understand the logic of this policy. If it is intended to maximise the rent from a scarce resource such as nickel, it will fail, because requiring relatively inefficient domestic processing necessarily reduces the economic rent flowing to the government and other Indonesian entities.
Recently, the government extended the objective of downstreaming the nickel industry to developing Indonesia as an EV battery hub. Indonesia has approached countries, most notably Australia, to secure access to lithium, another key ingredient of EV batteries that Indonesia does not have. Footnote33 As EV batteries need more than just nickel and lithium, Indonesia must engage with many countries, including those with internationally oriented automotive industries, such as Thailand and China. All this will require a more open trade and investment regime.
Proliferation of Trade Agreements and Interactions with the WTO
Protectionism in Indonesia has been returning since the mid-2000s and has been especially increasing recently. At the same time, the government is actively pursuing free trade agreements. As of August 2023, there were 35 concluded agreements, 9 negotiated and 16 proposed ().
FIGURE 9 Indonesia’s Trade Agreements
Source: Ministry of Trade.
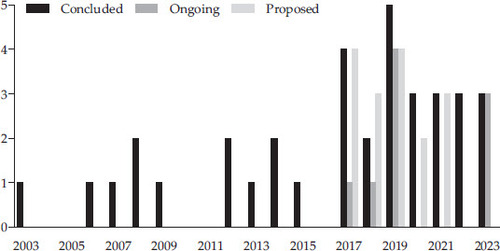
The figure shows that under President Widodo (after 2014), the effort to secure trade agreements has increased significantly. While some of these agreements are plurilateral, including through ASEAN countries, many of them are bilateral preferential trade agreements. Reciprocal preferential trade agreements (PTAs) typically increase welfare for the parties involved as they can create trade and increase welfare gains from trade by reducing trade barriers. However, PTAs can also divert trade that may benefit the parties in the agreement at the cost of nonmembers (Bhagwati Citation2008). Other things equal, the smaller the number of parties to trade agreements, the bigger the resulting trade diversion. So, bilateral agreements may cause significant complications across one another.
Given this risk, many recent agreements have taken the form of deep trade agreements (DTAs), which are broader and deeper than PTAs. For example, they may include agreements to liberalise labour markets. Studies have shown that such DTAs lead to more trade creation and less trade diversion than the shallower standard PTAs (Mattoo, Rocha and Ruta Citation2020). Some bilateral DTAs in which Indonesia is involved are those with Japan, Australia, the United Arab Emirates and Turkey. The most recent regional agreement that Indonesia signed is the Regional Comprehensive Economic Partnership (RCEP), which includes the 10 ASEAN members and Australia, New Zealand, China, Japan and South Korea.Footnote34
Indonesia’s active pursuit of trade agreements and introduction of bold reform to facilitate more trade and investment flows such as the omnibus law on job creation seem at odds with the aggressive protectionism and ad hoc industrial policies such as downstreaming and import substitution policies.Footnote35 This ambivalence extends to Indonesia’s relationship with the WTO.
Indonesia is a relatively frequent participant in the dispute settlement mechanism of the WTO (). Since 1995, it has been more active than other ASEAN countries, such as Malaysia, Thailand and Vietnam, not only as a complainant or as a respondent but also as a third party.Footnote36
Table 5. Disputes in the WTO since 1995, Selected Members
and detail Indonesia’s role as complainant and respondent, respectively. While Indonesia has won a few cases as a complainant, it has lost more.Footnote37 The last case in , DS592, is an EU complaint about Indonesia’s export ban on nickel ore, as discussed above. The European Union initiated the consultations with Indonesia at the WTO in November 2019. As it did not lead to a result, in January 2021, the European Union requested the establishment of a WTO panel to oversee the case. It has been considered a high-level case, with 16 other members (including Canada, China, India and the US) reserving their third-party rights. Three years after the initiation of the case, in November 2022, the panel found Indonesia guilty of violating WTO rules. In response to this decision, Indonesia filed an appeal in December 2022. The case continues to be discussed widely in Indonesia, often with an emotional, nationalistic tone.Footnote38 However, it might take some time before the case is settled, as the WTO Appellate Body is currently non-functional.Footnote39
Table 6. Indonesia as Complainant in the WTO Dispute Mechanism
Table 7. Indonesia as Respondent in the WTO Dispute Mechanism
Indonesia’s reluctance to accept the WTO’s decision is mirrored in its dealings with other institutions. For example, in June 2023, the IMF urged Indonesia to consider lifting its ore export ban (IMF 2023b). While it welcomed Indonesia’s ambition to ‘increase value added in exports, attract foreign direct investment and facilitate the transfer of skills and technology’, it called for the country to consider ‘phasing out export restrictions and not extending the restrictions to other commodities’ (IMF 2023b, 2). The government rejected this advice. The investment minister Lahadalia claimed that Indonesia’s processed nickel surged thanks to the ban and that downstreaming was not just a matter of adding value but was also related to maintaining the sovereignty of the country’ (Hadi Citation2023).
The Commodity Balance Sheet
In February 2022, President Widodo issued Presidential Regulation 32/2022 on the Commodity Balance Sheet (Neraca Komoditas). The regulation seeks to develop an integrated national database of the supply of and demand for traded goods (Gupta Citation2022) and is claimed as a follow-up to the omnibus law on job creation (Gupta, Pane and Pasaribu Citation2022). It aims to support simplification and improve transparency in export and import procedures. It is supposed to provide a comprehensive and accurate database as a basis for formulating export and import policies. I am unaware of any other country following this approach.
In the first stage of its implementation, the regulation is to cover five commodities: rice, beef, sugar, salt and fishery products. The subsequent stages will cover other commodities as deemed necessary. The forecasts on the demand side are based on firms’ reports of their planned exports and imports, which should be submitted before September every year. The forecasts on the supply side come from technical ministries, which have until October to compile the information (the Ministry of Agriculture is responsible for the data on rice and beef, the Ministry of Marine Affairs and Fisheries is to supply data on fisheries products, and so forth).
These forecasts will be reconciled by December every year. For primary goods, industrial inputs, and ‘strategic’ goods, the data reconciliation will be done in a ministerial coordinating meeting. For other goods, the regulation will be set automatically (based on forecasts, without the need for a ministerial meeting). Thus, the regulation should be ready every December to be used as the basis for granting export and import licences in the following year. That is, export or import licences can be issued when a surplus in the domestic supply or a shortfall in the demand is forecast, respectively.
It is hard to see how the regulation can simplify the export and import procedure in Indonesia. The system existing before the regulation is cumbersome as importers and exporters need a recommendation letter from the relevant ministry before proceeding to request an import or export licence from the Ministry of Trade. While the commodity balance regulation removes this layer for firms, it still requires technical ministries to collect supply data, implying that they might need to contact the firms anyway.
Second, commodity data in Indonesia have always been problematic. The regulation seems to assume that the government can have accurate and reliable data, notwithstanding the herculean effort to collect them. illustrates how complicated it is to deal with data in Indonesia. The case shown is that of rice supply and demand, always a contentious issue in Indonesia as the government traditionally protects this sector very strongly. The figures in are all from official data—and they are actual data, not forecasts. Column 7 shows the excess supply of rice as the difference between production and consumption—the figures are positive in all years shown. Nevertheless, official data on imports (last column) show that every year there are imports of rice, sometimes comprising more than 10% of estimated consumption, as in 2011. In short, the regulation seems misguided and completely unenforceable. Consequently, rather than supporting trade activities, it will discourage them.Footnote40
Table 8. Rice Consumption, Production and Imports in Indonesia
Proposed Alternative
This paper has argued that market-driven trade can be a way to increase economic growth in Indonesia. However, protectionism is rising and Indonesia’s approach to trade seems to vacillate between ambivalence, pragmatism and nationalism. This will hinder Indonesia’s attempts to maximise its gains from trade.
Rather than resorting to approaches that focus on expanding domestic industry through protectionist policies such as downstreaming, an import substitution strategy and self-sufficiency, it would be better to facilitate trade flows. One way to do this is to improve logistics.
Some studies highlight the role of logistics in economic transformation in Indonesia (Basri, Rahardja and Fitrania Citation2016; Patunru and Tarsidin Citation2012). They argue that improving logistics is crucial for growth.
shows the logistics performance index (LPI) of Indonesia from 2007 to 2022. In the most recent LPI report, Indonesia’s rank fell significantly from 46th (2018 report) to 63rd (2023 report). Compared to neighbours such as Malaysia, Thailand and Vietnam, Indonesia is a relatively poor performer, albeit the differences are not great.Footnote41
FIGURE 10 Logistics Performance Index
Source: World Development Indicators.
Notes: 1 = Low, 5 = High.
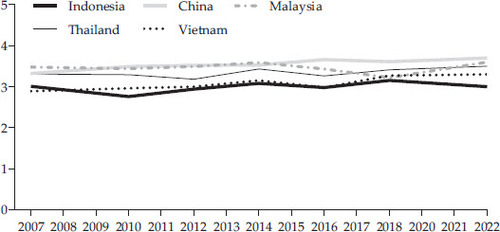
The subindices of LPI include ability to track and trace consignments, competence and quality of logistics services, ease of arranging competitively priced shipments, efficiency of the customs clearance process, frequency with which shipments reach the consignee within the scheduled or expected time, and quality of trade and transport-related infrastructure. The worst-performing areas for Indonesia in 2022 are the quality of trade and transport-related infrastructure, and the efficiency of the customs clearance process. These confirm that to improve trade flows, Indonesia must improve its logistics.
Many studies have shown how improvements in the aggregate index and each of the components of the LPI lead to significant growth in trade flows (Marti, Puertas and Garcia Citation2014; Gani Citation2017; Suryanta and Patunru Citation2023; Mahpour et al. Citation2023).
President Widodo is known as an ‘infrastructure president’. Presidential Instruction 5/2020 mandates the creation of a national logistics ecosystem that aims to reduce logistic costs from 24% to 17% of GDP in 2024.Footnote42 Furthermore, Bappenas aims to reduce logistic costs to 9% by 2045, although it does not detail how this will be achieved.Footnote43 Despite the many infrastructure projects under President Widodo, the entire logistics system needs massive improvement. For example, Indonesia’s most important port, Tanjung Priok, could handle only 6 million 20-foot equivalent units of containers in 2017, compared to Malaysia’s 20 million and Singapore’s 33 million (Gupta and Ratana Citation2023). Furthermore, logistics involve not only physical infrastructure but also the systems of payments and goods clearance, which are also lacking in the case of Indonesia.
CONCLUSIONS
Despite continuing turbulence at the global level, the Indonesian economy is sound. However, its average economic growth of 5% over the past 20 years has not been enough to help the country achieve high-income status. This paper argues that Indonesia can grow faster if it integrates further into the global market. Nevertheless, the recent development policies are not conducive to this objective. Instead, Indonesia’s approach to trade seems to be driven by objectives of domestic industrial policy, such as downstreaming and domestic value adding. This is not uniquely Indonesian: governments around the world are introducing and re-implementing numerous industrial policies. Some factors may explain this surge. First, the disruption in the global supply chain following the Covid pandemic, the war in Ukraine and the geopolitical tension between China and the United States have motivated governments to look inward or to limit trade and investment to allies only, rather than rely on integration with other countries. Second, under climate change concerns, governments escalate the use of restrictive policies to secure the supply of key minerals. As trade policy is arguably the easiest and most popular tool, governments use it to implement these industrial policies.
As for Indonesia, while there are pro-trade and investment policies such as the omnibus law on job creation, the overall trade policy appears to vacillate between ambivalence, pragmatism and nationalism. Recognising that the global trend is moving towards industrial policy, Indonesia would do better to adopt less distortionary policies, such as incentives, instead of targets or quantitative requirements, and an export tax instead of an export ban. Furthermore, Indonesia cannot rely on trade policy alone. There needs to be complementary policies such as labour market, bureaucratic and regulatory reforms.
In the short term, however, Indonesia should focus on creating a more conducive environment for accessing inputs and materials. A key step is to improve trade-supporting logistics.
ACKNOWLEDGMENTS
I thank Prema-chandra Athukorala, M. Chatib Basri, Anne Booth, Masyita Crystallin, Howard Dick, Donna Gultom, Krisna Gupta, Natasha Hamilton-Hart, Firman Hidayat, Hal Hill, Ferry Irawan, Ross McLeod, Blane Lewis, Mari Pangestu, Budy Resosudarmo, Aditya Yogatama and Firman Witoelar for their constructive feedback. I thank Anzika Anzika and Riandy Laksono for their excellent research assistance.
Notes
1 Indonesia and the Philippines have also asked whether being members of the newly launched Indo-Pacific Economic Framework (IPEF) could qualify them for the IRA benefits. However, signing the limited trade agreement and, possibly, being members in IPEF will require the removal of the nickel export ban (discussed below).
2 The IRA is a part of President Biden’s broader efforts to counter China, which also include the Creating Helpful Incentives to Produce Semiconductor and Science Act and the Infrastructure Investment and Jobs Act.
3 Traditionally, importing rice has been politically contentious in Indonesia (Patunru Citation2021).
4 India banned exports of basmati rice in September 2022. In July 2023, non-basmati rice was added to the banned list. India was behind almost 40% of total global rice trade in 2022.
5 It is normal for a country to slow down after reaching a certain level of income; however, in the case of Indonesia, the recent slow growth is below what it could have been (Resosudarmo and Abdurohman Citation2018).
7 The rate of extreme poverty in Indonesia decreased to 2.5% in 2022, based on the international poverty line of $2.15 per person per day in 2017 purchasing-parity price (PPP) (World Bank Citation2023b). Applying the poverty line for lower–middle-income countries of $3.65 a day in 2017 PPP, we see that 20% of the Indonesian population remained poor in 2022 (down from 22 % in 2021, when the rates in the Philippines and Thailand were 18% and 1%, respectively)
(www.data.worldbank.org, accessed 10 October 2023).
8 The contributions of private and government consumption to GDP were 53% and 8%, respectively, in the second quarter.
9 Investment in buildings and structures contributed more than 60% to the gross fixed capital formation, while vehicles contributed around 10% in the second quarter.
10 The figure also shows the exchange rate between the rupiah and yuan. China is Indonesia’s largest trade partner and in 2021 the two countries launched a framework of local currency settlement that allows the use of the rupiah or yuan in bilateral transactions.
11 To some extent, pandemic control measures helped reduce market volatility (Vo, Ho and Dang Citation2022). As the figure shows, Covid affected stock markets for less than a year.
12 At the time of writing, some adjustments were being made to the 2024 proposed budget following consultation between Indonesia’s parliament and government, but the exact figures were not yet official.
13 Hill and Menon (Citation2021) offer a comparison with trade policy in Thailand.
14 The term harmful is used in the Global Trade Alert database to identify restrictive trade policies (discussed below).
15 Also see the work of Patunru, Pangestu and Basri (2018) on nationalism and globalisation.
16 The Coordinating Ministry of Marine Affairs and Investment reported that the minister had complained to the IMF managing director about the recommendation and that the managing director apologised for it (Arkyasa Citation2023). There is no such apology statement found on the IMF website.
17 The ratios of trade to GDP were 38% in China in 2022, 49% in India in 2022 and 25% in the United States in 2021. In contrast, small countries and regions that cannot rely on their domestic market typically depend more on trade: Singapore 330% in 2022 and Hong Kong
380 % in 2022.
18 There was a V-shaped recovery globally as well, but the V was much deeper, illustrating the largest reduction of global trade flows since the Second World War. However, global trade quickly recovered at the end of 2020 (OECD 2022).
19 See Basri and Patunru (Citation2012) for a political economy analysis of protectionism in Indonesia.
20 This is based on a new data set of NTMs in Indonesia launched by the World Bank in February 2023 (https://www.worldbank.org/en/country/indonesia/brief/ntm-dataset).
21 The ad valorem equivalent of NTMs is not a perfect measure of distortion, as some NTMs are imposed to address market failures, as in the case of public health. To understand how this data set is constructed, see Montfaucon et al. (Citation2023).
22 Available at http://www.globaltradealert.org.
23 A World Bank (Citation2020) report shows that Indonesia (along with Argentina and Ethiopia) is more engaged in simple manufacturing production chains, while Algeria, Chile and Nigeria export commodities or raw materials for further processing, India and the United States produce services embodied in manufactured goods, and most other countries produce innovative goods and services.
24 President Widodo even formed a team consisting almost entirely of cabinet ministers that he named the Proud of Indonesian Products National Movement Team (under Presidential Decree 15/2021). It is headed by the coordinating minister for economic affairs Airlangga Hartarto, with deputies including the governor of Bank Indonesia Perry Warjiyo. In March
2022 , the president instructed heads of local governments to speed up the increase of local content use. This included an instruction to the minister of home affairs to include the use of local content as an indicator to evaluate the performance of local governments (presumably, the evaluation is to be used as the basis for budget allocation).
25 For comparison, the Chinese value added in one unit of the iPhone 3G assembled in China is only 3.6% of the bill of materials. Nevertheless, the assembly employs a lot of workers, resulting in a large total value added (Xing Citation2019).
26 The stated objective of this regulation is to support the local automobile industry, which has been affected by the Covid pandemic.
27 The jump in 2007–08 was caused by surging demand from China.
28 This policy allowed the export of nickel ore with a concentration lower than 1.7% on the condition that the holder of the production permit had used at least 30% nickel with such a concentration in its production and that it had built or was building a purifying facility (i.e. smelter ).
29 Warburton (Citation2018) argues that the relaxation was part of a broader plan that is largely nationalist in orientation. That is, it was to support state-owned mining company PT Aneka Tambang, whose profits had suffered due to the export ban.
30 ‘Nickel and articles thereof’ (HS code 75) includes direct derivatives of nickel ore such as nickel matte and nickel pig iron. The government aims to push the value addition further downstream, such as to the production of stainless steel sheet. At present, however, Indonesia cannot produce the slabs and rolled coils needed for this purpose. That is, while able to convert nickel ore into nickel matte and export the latter, Indonesia has to import it again in the form of slabs and rolled coils.
31 Initially targeting the production of stainless steel when it first founded the Indonesia Morowali Industrial Park in 2013, Tsingshan is now tapping into the electric vehicle (EV) industry and intends to divert parts of its nickel deposits in Indonesia to the manufacture of EV batteries.
32 From 1980 to 1992 Indonesia also banned log exports then replaced it with prohibitive tariff from 1992 to 1998.
33 On the other hand, the government has called a few other nickel-rich countries to form a nickel cartel similar to the Organization of the Petroleum Exporting Countries (OPEC) (Shofa Citation2023a). The collapse of a tin cartel in 1985 (Chandrasekhar Citation1989) and the failure of OPEC to secure economic rents (van der Linde Citation2000) should be a lesson for not repeating such an endeavour.
34 Disclosure: I was involved in a team assisting Bappenas to develop an impact assessment methodology for the Indonesia-Australia Comprehensive Economic Partnership implementation in Indonesia. I was also involved in a team assisting the Coordinating Ministry of Economic Affairs to develop an action plan of implementation for the RCEP in Indonesia.
35 Gupta, Patunru and Gretton (Citation2022) discussed the contradiction between the omnibus law and an import substitution strategy. They found positive impacts of improving the investment climate through the omnibus law, while the import substitution strategy is likely to act as a drag on the wider economy.
36 The year 1995 is used as a starting point as it was when the WTO Appellate Body was established.
37 Members sometimes have differing perceptions of resolutions. For example, case DS406 () on clove cigarettes ended with ‘mutual agreement’; however, it was perceived as an important win by the Indonesian government.
38 In one televised event, President Widodo said that Indonesia should fight ‘by all means’ (Karina Citation2021).
39 The Appellate Body is unable to review appeals, because it has no members, as the United States continues to block the appointment of new members to replace those whose term expired.
40 There have been complaints from private sectors that this system makes it more complicated to import intermediate goods for manufacturing (Zahira Citation2023).
41 Singapore (not shown) is the best performer. Responding to the latest report, however, the coordinating minister for maritime and investment affairs Luhut Binsar Pandjaitan said it was not fair to compare Indonesia, given its large number of ports, with Singapore, which has only one port (Shofa Citation2023b). China, however, has more than 30 major ports and 2,000 minor ports yet has been ranked higher since 2015 than all countries shown.
42 The 24% figure comes from a joint report by the World Bank and other organisations in 2013 (Bahagia, Sandee and Meews Citation2013).
43 As stated in the National Long-Term Development Plan (www.indonesia2045.go.id). On 14 September 2023, Bappenas announced new estimates of Indonesia’s national logistic costs, where the estimated cost for 2022 was 14% of GDP. The target for 2045 remains 9% (personal communication with a senior trade logistics expert, Henry Sandee).
REFERENCES
- Arkyasa, Mahinda. 2023. ‘Ministry Claims IMF Extends Apology for Demanding Removal of Mineral Export Restriction’. Indonesia Business Post, 14 August. https://indonesiabusinesspost.com/insider/ministry-claims-imf-extends-apology-for-demanding-removal-of-mineral-export-restriction/#:~:text=The%20Coordinating%20Ministry%20of%20Maritime,the%20downstreaming%20policy%20in%20Indonesia.
- Aspinall, Edward. 2018. ‘The New Nationalism in Indonesia’. In Indonesia in the New World: Globalisation, Nationalism and Sovereignty. Edited by Arianto A. Patunru, Mari Pangestu and M. Chatib Basri, 35–51. Singapore: ISEAS Publishing.
- Athukorala, Prema-chandra. 2022. ‘The Philippines in Global Manufacturing Value Chains: A Tale of Arrested Growth’. In Pro-poor Development Policies: Lessons from the Philippines and East Asia. Edited by Hal Hill, Majah-Leah V. Ravago and James A. Roumasset, 246–79. Singapore: ISEAS Publishing.
- Athukorala, Prema-chandra and Arianto A. Patunru. 2023. ‘Domestic Value Added, Exports, and Employment: An Input–Output Analysis of Indonesian Manufacturing’. Bulletin of Indonesian Economic Studies 59 (3).
- Basri, M. Chatib and Arianto A. Patunru. 2012. ‘How to Keep Trade Policy Open: The Case of Indonesia’. Bulletin of Indonesian Economic Studies 48 (2): 191–208. doi: 10.1080/00074918.2012.694154
- Basri, M. Chatib, Sjamsu Rahardja and Syarifah N. Fitrania. 2016. ‘Not a Trap, but Slow Transition? Indonesia’s Pursuit to High Income Status’. Asian Economic Papers 15 (2): 1–22. doi: 10.1162/ASEP_a_00422
- Bahagia, Senator Nur, Henry Sandee and René Meews. 2013. State of Logistics Indonesia 2013. Bandung: Center of Logistics and Supply Chain Studies; Jakarta: Asosiasi Logistik Indonesia; Zoetermeer: Panteia/NEA; Rotterdam: STC-Group; Jakarta: World Bank.
- Bhagwati, Jagdish. 2008. Termites in the Trading System: How Preferential Agreements Undermine Free Trade. Oxford University Press.
- Chandrasekhar, Sandhya. 1989. ‘Cartel in a Can: The Financial Collapse of the International Tin Council’. Northwestern Journal of International Law & Business 10 (2): 309–32.
- Gani, Azmat. 2017. ‘The Logistics Performance Effect in International Trade’. Asian Journal of Shipping and Logistics 33 (4): 279–88. doi: 10.1016/j.ajsl.2017.12.012
- Gupta, Krisna. 2022. ‘Changes to Trade Policy in Presidential Regulation 32/2022 on Neraca Komoditas’. Policy Brief 13, Center for Indonesian Policy Studies, Jakarta, March.
- Gupta, Krisna, Deasy Pane and Donny Pasaribu. 2022. ‘The Advent of a New Trade Governance after the Omnibus Law: Neraca Komoditas’. Policy Paper 47, Center for Indonesian Policy Studies, Jakarta, January.
- Gupta, Krisna, Arianto Patunru and Paul Gretton. 2022. ‘Projecting the Long Run Impact of an Economic Reform: The Case of the Indonesian Omnibus Law’. Conference paper 333472, Global Trade Analysis Project, Center for Global Trade Analysis, Purdue University, West Lafayette.
- Gupta, Krisna and Dhany Ratana. 2023. ‘Indonesia’s Stubborn Logistics Dilemma’. East Asia Forum, 18 August. https://www.eastasiaforum.org/2023/08/18/indonesias-stubborn-logistics-dilemma/
- Hadi, Aditya. 2023. ‘Govt to “Fight” against IMF’s Mineral Export Ban Criticism’. Jakarta Post, 12 July. https://www.thejakartapost.com/business/2023/07/10/govt-to-fight-against-imfs-mineral-export-ban-criticism.html
- Hill, Hal and Deasy Pane. 2018. ‘Indonesia and the Global Economy: Missed Opportunities?’ In Indonesia in the New World: Globalisation, Nationalism and Sovereignty. Edited by Arianto A. Patunru, Mari Pangestu and M. Chatib Basri, 267–93. Singapore: ISEAS Publishing.
- Hill, Hal and Jayang Menon. 2021. ‘Trade Policy in Indonesia and Thailand’. World Economy 44 (12): 3492–506. doi: 10.1111/twec.13231
- IMF (International Monetary Fund). 2023a. World Economic Outlook: Navigating Global Divergences. Washington, DC, October.
- IMF (International Monetary Fund). 2023b. ‘Indonesia: 2023 Article IV Consultation—Press Release; Staff Report; and Statement by the Executive Director for Indonesia’. IMF Country Report 23/221, Washington, DC, June.
- Karina, Dina. 2021. ‘Jokowi Akan Lawan Gugatan Uni Eropa di WTO [Jokowi Will Fight EU’s Complaint in WTO’. KompasTV, 18 November. https://www.kompas.tv/bisnis/233319/jokowi-akan-lawan-gugatan-uni-eropa-di-wto
- Karyza, Divya. 2023. ‘IDX Composite “Best-Performing” Southeast Asian Index in 2022’. Jakarta Post, 3 January. https://www.thejakartapost.com/business/2023/01/02/idx-com-posite-best-performing-southeast-asian-index-in-2022.html
- Kaufman, Noah, Sagatom Saha and Christopher Bataille. 2023. ‘Green Trade Tensions’. Finance and Development, June.
- Mahpour, Alireza, Iman Farzin, Amirhossein Baghestani, Sina Ashouri, Zahra Javadi and Latifeh Asgari. 2023. ‘Modeling the Impact of Logistic Performance, Economic Features, and Demographic Factors of Countries on the Seaborne Trade’. Asian Journal of Shipping and Logistics 39 (2): 60–66. doi: 10.1016/j.ajsl.2023.02.003
- Marti, Luisa, Rosa Puertas and Leandro Garcia. 2014. ‘The Importance of the Logistics Performance Index in International Trade’. Applied Economics 46 (24): 2982–92. doi: 10.1080/00036846.2014.916394
- Mattoo, Aditya, Nadia Rocha and Michele Ruta, eds. 2020. Handbook of Deep Trade Agreements. Washington, DC: World Bank.
- Maulia, Erwida. 2023. ‘Indonesia EV Battery Dream Hits Lithium, U.S. Inflation Act Walls’. NikkeiAsia, 21 September. https://asia.nikkei.com/Spotlight/Supply-Chain/Indonesia-EV-battery-dream-hits-lithium-U.S.-inflation-act-walls#:~:text=JAKARTA%20%2D%2D%20Indonesia’s%20ambition%20to,EV%2Drelated%20incentives%20dragging%20out
- Montfaucon, Angella Faith, Massimiliano Cali, Bayu Agnimaruto, Jana Mirjam Silberring, Agnesia Adhissa Hasmand, Csilla Lakatos and Mochamad Pasha. 2023. Building a Dataset for Non-tariff Measures and Its Usage: The Case of Indonesia and Applicability for Other Countries. World Bank: Washington, DC.
- Myers, Rodd. 2015. ‘What the Indonesian Rattan Export Ban Means for Domestic and International Markets, Forests, and the Livelihoods of Rattan Collectors’. Forest Policy and Economics 50: 210–19. doi: 10.1016/j.forpol.2014.07.009
- Newman, Carol, John Rand and Finn Tarp. 2023. ‘Imports, Supply Chains and Firm Productivity’. World Development 172 (2023) 106371: 1–10. doi: 10.1016/j.worlddev.2023.106371
- OECD (Organisation for Economic Cooperation and Development). 2022. ‘International Trade during the Covid-19 Pandemic: Big Shifts and Uncertainty’. OECD Policy Responses to Covid-19, Paris, 10 March.
- OECD (Organisation for Economic Cooperation and Development). 2023. OECD Economic Outlook, Interim Report September 2023: Confronting Inflation and Low Growth. Paris: OECD Publishing.
- Pane, Deasy and Arianto A. Patunru. 2023. ‘The Role of Imported Inputs in Firms’ Productivity and Exports: Evidence from Indonesia’. Review of World Economics 159: 629–72. doi: 10.1007/s10290-022-00476-z
- Pangestu, Mari, Sjamsu Rahardja and Lili Yan Ing. 2015. ‘Fifty Years of Trade Policy in Indonesia: New World Trade, Old Treatments’. Bulletin of Indonesian Economic Studies 51 (2): 239–61. doi: 10.1080/00074918.2015.1061915
- Patunru, Arianto A. 2018. ‘Rising Economic Nationalism in Indonesia’. Journal of Southeast Asian Economies 35 (3): 335–54. doi: 10.1355/ae35-3b
- Patunru, Arianto A. 2021. ‘Is Greater Openness to Trade Good? What Are the Effects on Poverty and Inequality?’ In Globalization, Poverty, and Income Inequality: Insights from Indonesia. Edited by Richard Barichello Arianto A. Patunru and Richard Schwindt, 142–88. Vancouver: UBC Press.
- Patunru, Arianto A., Mari Pangestu and M. Chatib Basri, eds. 2018. Indonesia in the New World: Globalisation, Nationalism and Sovereignty. Singapore: ISEAS Publishing.
- Patunru, Arianto A. and Sjamsu Rahardja. 2015. Trade Protectionism in Indonesia: Bad Times and Bad Policy. Analysis, 29 July. Sydney: Lowy Institute.
- Patunru, Arianto A. and Tarsidin. 2012. ‘Recent Indonesian Economic Development and the Urgent Need to Remove Key Growth Obstacles’. Asian Economic Papers 11 (3): 57–77. doi: 10.1162/ASEP_a_00164
- Resosudarmo, Budy P. and Arief A. Yusuf. 2006. ‘Is the Log Export Ban an Efficient Instrument for Economic Development and Environmental Protection? The Case of Indonesia’. Asian Economic Papers 5 (2): 75–104. doi: 10.1162/asep.2006.5.2.75
- Resosudarmo, Budy P. and Abdurohman. 2018. ‘Is Being Stuck with a Five Percent Growth Rate a New Normal for Indonesia?’ Bulletin of Indonesian Economic Studies 54 (2): 141–64. doi: 10.1080/00074918.2018.1521776
- Roemer, Michael. 1979. ‘Resource-Based Industrialization in Developing Countries’. Journal of Development Economics 6 (2): 163–202. doi: 10.1016/0304-3878(79)90012-9
- State Secretariat (Sekretariat Negara). 2023. ‘Sambutan Presiden Joko Widodo pada Pengukuhan Dewan Pimpinan Nasional APINDO Masa Bakti 2023–2028’ [Speech by President Joko Widodo on the Inauguration of the APINDO National Leaders Council 2023–2028]. Ministry of the State Secretariat, 31 July. https://www.setneg.go.id/baca/index/sambutan_presiden_joko_widodo_pada_pengukuhan_pengurus_dewan_pimpi-nan_nasional_apindo_masa_bakti_2023_2028
- Shofa, Jayanti Nada. 2023a. ‘Indonesia in Talks with 3 Unnamed Countries for Opec-Like Nickel Cartel’. Jakarta Globe, 30 June. https://jakartaglobe.id/news/indonesia-in-talks-with-3-unnamed-countries-for-opeclike-nickel-cartel
- Shofa, Jayanti Nada. 2023b. ‘Luhut Calls World Bank’s Logistics Performance Index Unfair’. Jakarta Globe, 18 July. https://jakartaglobe.id/business/luhut-calls-world-banks-logistics-performance-index-unfair
- Soejachmoen, Moekti. 2012. ‘Why is Indonesia Left Behind in Global Production Networks?’ Unpublished PhD diss., Australian National University.
- Surianta, Andree and Arianto A. Patunru. 2021. ‘Repositioning Indonesia in the Post-Covid 19 Global Value Chains’. Southeast Asian Affairs: 122–38. doi: 10.1355/aa21-1h
- Suryanta, Barli and Arianto A. Patunru. 2023. ‘Trade Impediments in Indonesia’. Journal of Economic Integration 38 (2): 247–77. doi: 10.11130/jei.2023.38.2.247
- Tumangguang, Erizal Jamal DT. 2023. ‘Ancaman El Niño dan Produksi Padi [El Niño Threat and Paddy Production]’. Kompas, 11 August. https://www.kompas.id/baca/opini/2023/08/10/ancaman-el-nino-dan-produksi-padi
- UNCTAD (United Nations Conference on Trade and Development). 2023. Global Trade Update: June 2023. https://unctad.org/system/files/official-document/ditcinf2023d2_en.pdf
- van der Linde, Coby. 2000. The State and the International Oil Market: Competition and the Changing Ownership of Crude Assets. New York: Springer Science+Business Media.
- Vo, Duc Hong, Chi Minh Ho and Tam Hoang-Nhat Dang. 2022. ‘Stock Market Volatility from the Covid-19 Pandemic: New Evidence from the Asia-Pacific Region’. Heliyon 8 (9): 1–21. doi: 10.1016/j.heliyon.2022.e10763
- Wacziarg, Roman and Karen Horn Welch. 2008. ‘Trade Liberalization and Growth: New Evidence’. World Bank Economic Review 22 (2): 187–231. doi: 10.1093/wber/lhn007
- Warburton, Eve. 2017. Resource Nationalism in Post-boom Indonesia: The New Normal? Analysis, April. Sydney: Lowy Institute.
- Warburton, Eve. 2018. ‘Nationalism, Developmentalism and Politics in Indonesia’s Mining Sector’. In Indonesia in the New World: Globalisation, Nationalism and Sovereignty. Edited by Arianto A. Patunru, Mari Pangestu and M. Chatib Basri, 90–108. Singapore: ISEAS Publishing.
- World Bank. 2020. World Development Report: Trading for Development in the Age of Global Value Chains. Washington, DC.
- World Bank. 2023a. Services for Development. World Bank East Asia and the Pacific Economic Update. Washington, DC, October.
- World Bank. 2023b. Indonesia Poverty Assessment: Pathways towards Economic Security. Washington, DC.
- Xing, Yuqing. 2019. ‘How the iPhone Widens the US Trade Deficit with China: The Case of the iPhone X’. GRIPS Discussion Papers 19–21, National Graduate Institute for Policy Studies, Tokyo, October.
- Yanwardhana, Emir. 2023. ‘Susul Nikel & Bauksit, Jokowi Akan Setop Ekspor Tembaga-Timah’[Following Nickel and Bauxite, Jokowi Will Stop Exports of Copper and Tin]. CNBC Indonesia, 31 July. https://www.cnbcindonesia.com/news/20230731175405-4-458876/susul-nikel-bauksit-jokowi-akan-setop-ekspor-tembaga-timah
- Zahira, Nadya. 2023. ‘Pengusaha Keluhkan Sistem Neraca Komoditas yang Mempersu-lit Impor’ [Business People Complain That Neraca Komoditas System Complicates Imports]. Katadata, 28 January. https://katadata.co.id/happyfajrian/berita/63d4020c4492e/pengusaha-keluhkan-sistem-neraca-komoditas-yang-mempersulit-impor