
ABSTRACT
Soviet military maps utilized a comprehensive cartographic symbology that was designed for mapping the globe at various scales, including thousands of towns and cities in street-level detail. This paper presents an analysis of the Soviet symbol specifications, as defined by the official cartographic production documents, and aims to offer some insights into how the challenges of mapping a global diversity of urban and natural environments were addressed. A further stage of the analysis examines a sample of 19 Soviet military city plans to evaluate the implementation of the official symbology specified in the production documents. This finds that barely half of this symbology was utilized and that new symbols were routinely created as improvised solutions. By comparing the theoretical context of the symbology with its real-world application the paper offers a critical appraisal of the versatility of the Soviet approach that may inform current and future global mapping initiatives.
Introduction
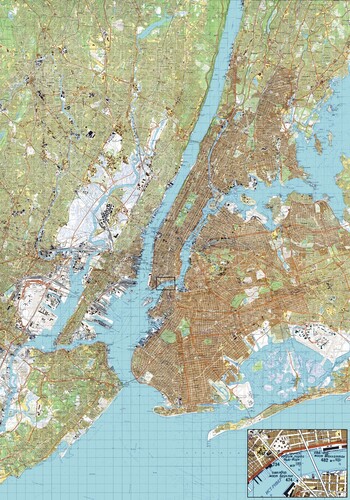
As part of its military global mapping programme, the Soviet Union produced detailed plans of over 2,000 towns and cities located in over 130 countries (Davis and Kent, Citation2017). Their subjects range from major population centres, ports, transport hubs, industrial and/or economic centres, to many smaller towns and cities with seemingly little or no strategic importance. Based on the Gauss-Krüger projection and mostly produced at the scales of 1:25,000 and 1:10,000, the Soviet military city plans usually comprise a single sheet that is centred on the mapped settlement (e.g. ), although many plans use multiple sheets for covering larger conurbations, such as the eight-sheet 1:25,000 plan of New York ().
Figure 1. Soviet military 1:10,000 city plan of Tromsø, Norway, printed in Leningrad (St Petersburg) in 1975. Original size approximately 90 × 120 cm. Available at: https://images.jomidav.com/Tromso.html (accessed: 15th May 2021).
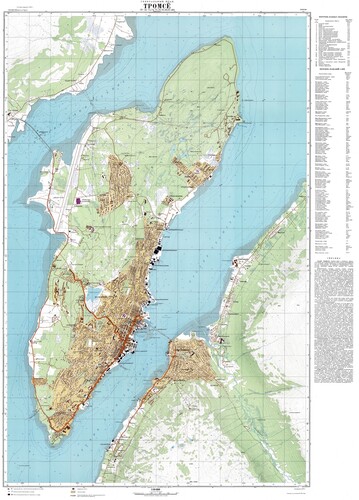
Figure 2. Soviet military 1:25,000 city plan of New York, USA, printed in Leningrad (St Petersburg) in 1982. A reduced eight-sheet composite with its margins digitally removed and an inset added by the authors as an enlargement of the area surrounding the Brooklyn and Manhattan bridges to indicate the level of detail. The actual size of the assembled composite is approximately 160 × 440 cm (private collection).
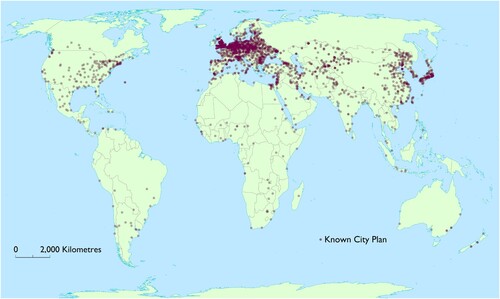
Although the Soviet Union undertook the systematic topographic mapping of its domestic territories at a range of scales from 1:1,000,000 to 1:10,000, the separate series of military plans of towns and cities represents its largest-scale mapping beyond the USSR known to date (). Introduced during the Second World War for the Soviet counter-offensive to Berlin (Kent, Citation2021), the most common scales of the series found so far are 1:10,000 (around 1,500 known plans) and 1:25,000 (around 300), with other scales used more sparingly, including 1:15,000 (around 30), 1:20,000 (a plan of Tokyo from Citation1966), and 1:5,000 (a plan of Milford Haven from 1950). Soviet military city plans of settlements outside the USSR were produced by a branch of the General Staff, the Military Topographic Directorate (Военное топографическое управление) or VTU, and are usually labelled ‘ГЕНЕРАЛЬНЫЙ ШТАБ’ (General Staff) above the title of each plan. Their purpose is specified in article 1 of the compilation manual for the city plans (General Staff, Citation1978):
Планы городов создаются на территорию городов, крупных поселков городского типа, железнодорожных узлов и других важных населенных пунктов и их окрестностей. Планы городов предназначаются для детального изучения городов и подходов к ним, ориентирования, производства точных измерений и расчетов при планировании и проведении мероприятий народнохозяйственного и оборонного значения.
[City plans are made of the territory of cities, large urban settlements, railway junctions, and other important population centres and their surroundings. City plans are intended for the detailed study of cities and their approaches, for orientation, and for the production of accurate measurements and assessments in the planning and the execution of measures significant for the national economy and for defence.]
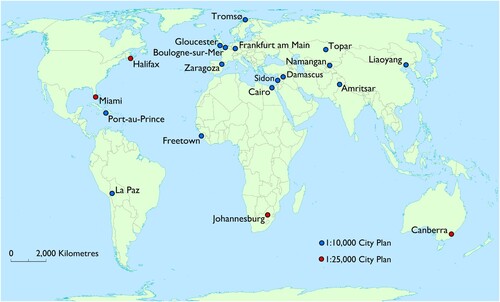
Figure 3. Map indicating towns and cities known to have been mapped by the Soviet Union for its series of military plans. Compiled from holdings in libraries and stock lists from online retailers, the plans appearing on this map have been either observed in person by the authors or appear on lists of at least two separate organizations (Davis, Citation2015).
The cartographic design of Soviet military city plans evolved during the Cold War to incorporate a more comprehensive symbology that utilized more colours. Later examples (especially those produced from the early 1970s) included a colour-coding system to classify strategically important objects according to their function, i.e. green for military/communications objects; purple for governmental/administrative institutions; and black for military-industrial facilities. These are usually numbered and listed alphabetically in the margin of each city plan, along with an alphabetical index to streets, and a spravka: a descriptive essay about the town or city and its environs. This compilation of additional information was sometimes produced separately as a booklet. Typically, the spravka mentions the key characteristics of the subject of the plan, such as the settlement’s location and population, as well as an assessment of the surrounding terrain including its soils and hydrology (Davis and Kent, Citation2018).
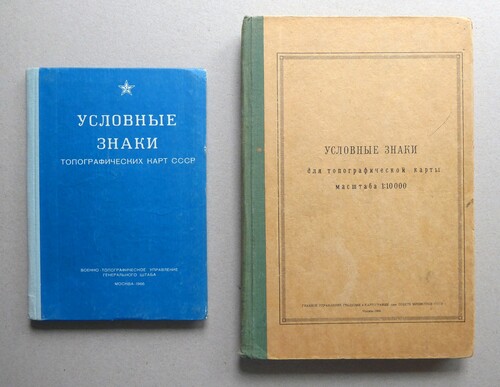
A growing body of research on Soviet military mapping, including its series of city plans, has emerged over recent years (e.g. Davies, Citation2005a, Citation2005b; Watt, Citation2005; Cruickshank, Citation2007; Citation2020; Kent and Davies, Citation2013; Davies and Kent, Citation2017; Kent et al., Citation2019; Kent and Davies, Citation2019; Svenningsen and Perner, Citation2020; Kent, Citation2021). These studies have advanced understanding of this hitherto largely unknown global cartographic project through detailed analyses of its maps and their metadata, content and design. There is, however, yet to be a systematic analysis of the topographic symbology of Soviet mapping based upon its official specifications. Produced in several successive editions by the General Staff or by GUGK, these documents illustrate the wide range of symbols to be used for topographic mapping at each scale (). They accompanied a series of compilation manuals, which indicated the editorial and printing processes used in the creation of the maps. The closure of military cartographic factories following the dissolution of the Soviet Union in 1991 has led to the recent public availability of these documents (in addition to maps) from sources within the former Soviet republics, which has enabled them to be used as the basis of this study.
Figure 4. Official Soviet specifications for topographic maps: 1:25,000; 1:50,000; 1:100,000; 1:200,000; 1:500,000; 1:1,000,000 (General Staff, Citation1966) (left); and 1:10,000 (GUGK, Citation1968) (right), which specify the symbols to be used on maps and plans at these scales.
The Soviet military city plans have utilized and expanded upon the symbologies of large-scale topographic mapping that were introduced in 1940 (Kent et al., Citation2019). This symbology evolved to facilitate the mapping of a full range of urban and natural environments worldwide, indicating details such as construction materials and vegetation species, in addition to the colour-coding of strategically important buildings. The availability of official cartographic specifications for the city plans offers a new opportunity to examine the Soviet global mapping project in more detail, particularly its classification of topography. The combined availability of these specifications and their associated maps and plans also allows a critical examination of the implementation of Soviet symbology, and whether its versatility offers potential solutions for overcoming the ongoing challenges of large-scale topographic mapping around the world today.
Related studies
In the thirty years since the dissolution of the Soviet Union, academic research into its military global mapping programme has gathered momentum. The three-volume survey of world topographic mapping compiled by Böhme (Citation1993) was among the first publications in English to describe the considerable domestic mapping output of the USSR, but omitted to mention its mapping of foreign territories. That same year, Soviet military plans of towns and cities in Western Europe were first offered for sale by a Latvian map publisher at the 16th International Cartographic Conference in Cologne, Germany (Watt, Citation2005). In their survey of mapping produced in the European republics of the former Soviet Union, Collier et al. (Citation1998) mentioned the increasing availability of Soviet military mapping and went as far as proposing a paper focusing on the city plans.
The Soviet military city plan of Thurrock and Gravesend, included in a free public exhibition entitled ‘The Lie of the Land: The Secret Life of Maps’ that was held at the British Library from 27th July 2001 to 7th April 2002, and its reproduction with a commentary in the accompanying guide (Barber and Carlucci, Citation2001), was probably the first map of the series to garner interest from a wider public. Referring to the use of Soviet mapping by the USA in their invasion of Afghanistan in 2001, Lee and Shumakov (Citation2003) demonstrated the superior detail of Soviet terrain data in constructing digital elevation models, which was expanded by Lee’s (Citation2003) compilation of a manual of terrain analysis of the country derived from 1:200,000 Soviet mapping. Shortly after, an English translation of the Russian handbook on military topography was also published by the US cartographic firm EastView (Psarev, Citation2005), which described and illustrated the various types of military maps used by the Russian Armed Forces and reproduced a selection of the maps’ symbology.
A focus on nationally specific examples of Soviet mapping was introduced by the series of articles by Davies (Citation2005a, Citation2005b, Citation2006, Citation2010), which provided comparisons with Ordnance Survey mapping and identified likely source materials as well as discrepancies. Together with the contributions of Watt (Citation2005), Cruickshank (Citation2007, Citation2008, Citation2012), Travers (Citation2008) and Kent and Davies (Citation2013), the full scope of the global mapping project and its significance has slowly begun to emerge. These insights contributed to the panoptic perspective offered by Davies and Kent (Citation2017), which provided a compendium of comparisons between Soviet and national topographic mapping of both the UK (Ordnance Survey) and the USA (United States Geological Survey), as well as an overview of recent applications, including those in archaeology, oil exploration and water resource management. Further comparisons between Soviet and national topographic mapping in the UK (Cruickshank, Citation2020) and in Denmark (Svenningsen and Perner, Citation2020), have advanced understanding of the level of coverage and the processes of Soviet map revision.
Although systematic analyses of the symbologies of national topographic mapping (e.g. Kent and Vujakovic, Citation2009) and comparisons between national and Soviet military topographic mapping (e.g. Cruickshank, Citation2020) have been made, an empirical, systematic analysis of the topographic symbology employed on Soviet military mapping is yet to be published. Unlike topographic maps produced by most nation-states, Soviet military maps do not include a comprehensive legend in their marginalia, which includes only a very small selection of symbols. Their military users, typically unit commanders, were expected to learn this symbology themselves for use in the field (Psarev, Citation2005). Hence, any rigorous analysis of Soviet military map symbology requires reference to the official cartographic specifications (i.e. those issued by the Soviet General Staff or GUGK) that describe the full range of symbols to be used. The recent public availability of these original sources allows a comprehensive analysis to be undertaken and for insights to be gained into the true scope of Soviet topographic symbology, which also offers an opportunity to explore the extent of its implementation on the maps. This study aims to offer a better understanding of how Soviet cartographers approached the design of a symbology that was intended to be sufficiently comprehensive and versatile for the task of mapping diverse environments around the globe.
Method
Source materials
The analysis presented in this paper is based upon original sources, comprising the official cartographic specifications issued by the Soviet General Staff and by GUGK, together with a sample of 19 Soviet military city plans. To identify the relevant symbology, article 11 of the General Staff (Citation1978) instructions for creating city plans (Manual for Cartography and Cartographic Reproduction Works Part 4: Compilation and Preparation for Printing of City Plans) stipulates that:
Графическое оформление планов городов масштабов 1:10,000 и 1:25,000 производится в действующих условных знаках для топографических карт соответственно масштабов 1:10,000 и 1:25,000 с учетом дополнений к ним (приложение 10).
[The graphic design of city plans at 1:10,000 and 1:25,000 is carried out according to the current conventional signs for topographic maps, respectively at 1:10,000 and 1:25,000, taking into account the supplement thereto (appendix 10).]
Constructing the typology
In order to identify the different landscape feature types incorporated within the Soviet symbology and to assess their relative balance, a methodological approach based on Kent (Citation2009) was adopted. This involves a systematic analysis of topographic map symbols based on an a posteriori classification of the landscape features they symbolize. The typology introduced by Kent and Vujakovic (Citation2009) for classifying the symbologies of European state 1:50,000 topographic maps was developed for the present study to broadly reflect the classification of themes in the Soviet specifications. In order to enable a finer level of analysis, a classification more similar to the categories used in the 1:10,000 Soviet specification was adopted. Consequently, the most significant departure from Kent and Vujakovic’s (Citation2009) typology is the division of the corresponding Soviet category ‘Industrial, agricultural and socio-cultural objects’ into five separate categories, which allows a more detailed analysis of these features. The Soviet categories in the 1:10,000 and 1:25,000 specifications differ, in that the former splits ‘Transport networks’ in two (‘Highways, dirt roads and trails’ and ‘Railways and their facilities’). Together, these adjustments resulted in a typology of 13 categories ().
Table 1. Symbol categories used in this study, as derived from the Soviet 1:10,000 and 1:25,000 specifications (General Staff Citation1966; GUGK Citation1968).
During the process of counting symbols within these categories, only discrete graphical symbols are recorded (i.e. excluding annotations that solely comprise letters). As per most cartographic specifications, symbols are usually presented and described in isolation, although others are presented within extracts of maps of fictitious locations in order to indicate the context of their use. In each case, each unique symbol is identified and counted separately. Accordingly, symbol explanations are important in determining whether a symbol should be considered unique. Where very similar graphical symbols are included in the specifications for plans at both 1:10,000 and 1:25,000 scales but carry different explanations, these are each considered as different symbols despite their graphical similarity. Where minor graphical differences exist between a symbol at both scales and their explanations are identical, these are treated as the same symbol (). This approach ensures that the level of detail in the classification of landscape at the larger scale is preserved and that symbol counts are not unnecessarily inflated by double-counting the same topographic feature that has been symbolized with slight graphical differences.
Figure 5. The symbols for aerodromes (left) have slight graphical differences in the 1:10,000 and 1:25,000 specifications, but have exactly the same explanation ‘Аэродромы и гидроаэродромы’ [Aerodromes and hydro-aerodromes], and therefore are counted as one symbol in the analysis. Conversely, symbols that are graphically identical in both specifications (right) are counted separately due to their different explanations, such as ‘Входы в недействующие вспомогательные шахты’ [Entrances to inactive auxiliary shafts] at 1:10,000 and ‘Шахты и штольни недействующие’ [Inactive shafts and adits] at 1:25,000.
![Figure 5. The symbols for aerodromes (left) have slight graphical differences in the 1:10,000 and 1:25,000 specifications, but have exactly the same explanation ‘Аэродромы и гидроаэродромы’ [Aerodromes and hydro-aerodromes], and therefore are counted as one symbol in the analysis. Conversely, symbols that are graphically identical in both specifications (right) are counted separately due to their different explanations, such as ‘Входы в недействующие вспомогательные шахты’ [Entrances to inactive auxiliary shafts] at 1:10,000 and ‘Шахты и штольни недействующие’ [Inactive shafts and adits] at 1:25,000.](/cms/asset/da321de0-6950-4b1e-9ce6-d8ef7cd3b300/ycaj_a_1958193_f0005_ob.jpg)
The typology allows the relative balance of features in the Soviet city plan symbology to be analysed and the level of detail represented by each category to be determined. This approach therefore aims to provide some insights into the varying levels of focus that the Soviet symbology places on different aspects of natural and built environments, thus revealing broader patterns in its classification of landscape.
The symbology in use
In order to evaluate the versatility of the Soviet topographic symbology as a sufficient cartographic solution for mapping a diverse range of landscapes around the globe, the second stage of this investigation examines the range of symbols used in a sample of 19 Soviet military plans (at 1:10,000 and at 1:25,000) of cities from around the world (). The sample includes cities located in varied climatic zones, with different levels of human development, and across socio-cultural contexts.
Figure 6. Map indicating the sample of 19 Soviet military city plans that were examined in order to compare the symbology defined in the cartographic specifications with its implementation.
The process of recording the symbols in use on each plan involves the systematic visual inspection of each of its grid squares (for the 1:10,000 plans, grid squares are 5 cm × 5 cm in size and cover 500 m × 500 m on the ground; for 1:25,000 they are 4 cm × 4 cm on the plan and cover 1,000 m × 1,000 m on the ground). To minimize the bias of local geography (i.e. the prevalence of certain features in particular locations), each type of symbol is counted only once per sheet and checked against the Soviet specifications. If a symbol is used on the plan but does not appear in the specifications, that symbol is recorded as such, together with its improvised explanation appearing in the plan’s legend.
Results
Analysis of the Soviet symbology
The initial phase of the analysis involved defining the relevant symbology for Soviet military city plans (as derived from the symbol specifications) and categorizing the symbols according to the typology outlined above. A total of 504 graphical symbols were extracted from the specifications for 1:10,000 topographic maps (GUGK, Citation1968) and 357 from the comparable document at 1:25,000 (General Staff, Citation1966), plus a further 39 symbols from the compilation manual for city plans (General Staff, Citation1978). However, many of these symbols are very similar (either graphically or in their explanations) and therefore were not all counted separately. Nevertheless, on the basis of the specifications consulted, the symbology designed for use on the Soviet military city plans amounts to 630 different graphical symbols. Of these, 252 are intended for specific use at 1:10,000, 104 are intended for specific use at 1:25,000, and the remaining 274 symbols are intended for use at either scale.
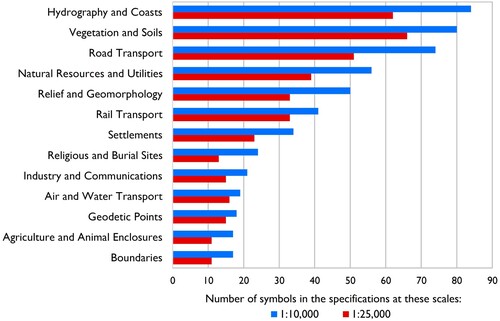
Categorizing these symbols according to the typology in suggests the relative emphasis given to different feature types in the Soviet specifications (). In the 1:10,000 symbology, the largest category is ‘Hydrography and Coasts’ (totalling 84 symbols) followed by ‘Vegetation and Soils’ (totalling 80 symbols). At 1:25,000, these categories are similarly large (totalling 62 and 66 symbols respectively), although their order is reversed. Of the three categories containing transport features, ‘Road Transport’ is the most extensive at both scales and is the third-largest category overall at both scales. ‘Agriculture and Animal Enclosures’ and ‘Boundaries’ are the smallest categories at both scales. More symbols are included at 1:10,000 than at 1:25,000, corresponding to the higher level of generalization at the smaller of these scales. Specific observations for each category are made below.
Figure 7. Number of different symbols appearing in the Soviet specifications, by scale and category.
Hydrography and Coasts
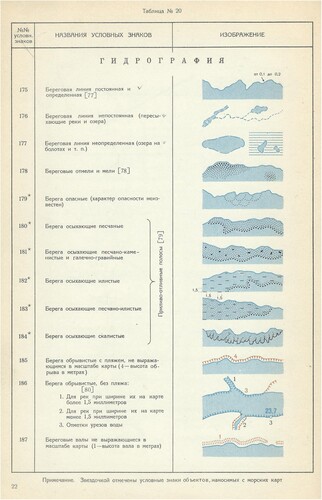
Of all categories, ‘Hydrography and Coasts’ includes the largest number of symbols at 1:10,000 and the second largest at 1:25,000. Most features in this category relate to coastal and river environments (). The inclusion of different symbols for indicating rivers of different widths at 1:10,000 means that there are significantly more symbols at this scale than at 1:25,000. Greater detail at 1:10,000 is also found in other elements of the symbology, such as a distinction between mechanical and non-mechanical ferries, and between different types of springs and lakes. By contrast, each of these features has only a single, generic symbol at 1:25,000. However, there are also some minor features which are included at both scales, including ‘seaweed’, ‘driftwood accumulation’ and ‘hydrometric station or tide gauge’.
Figure 8. The opening page of the ‘Hydrography’ section in the 1:10,000 specifications (GUGK, Citation1968), showing the symbolization of various coastal features.
Vegetation and Soils
Many of the symbols in this category serve to discriminate between types of tree and tree cover. At 1:10,000, the symbology includes more individual plants and trees, with an individual symbol often assigned to small groups of plant species, such as ‘subshrub vegetation (sagebrush, eurotia, sarzasan etc.)’ and ‘lichen vegetation (forage lichen, reindeer lichen)’ as well as different types of lawns and gardens. The symbols relating to soils are similar at both scales.
Road Transport
Orange highways are a distinctive design feature of this symbology, but the ‘Road Transport’ category also includes many more minor types of road, including ‘dirt road’ (separated into ‘soft’ and ‘hard’ sections at 1:10,000), ‘caravan or packhorse route’, ‘road with wooden covering’, ‘fascine road, causeway or raft’ and ‘route for removing logs/timber’. Many of these road types are included at both scales, although the 1:10,000 symbology includes more minor street furniture, such as ‘road sign’ and ‘bus/trolley bus stop’ (outside cities only). The symbology for road bridges is extensive at both scales, with 1:10,000 symbols often stipulating the length and construction material of the bridge, for example ‘triple-spanned stone, concrete or reinforced concrete bridge, over 13 m long, to scale’.
Natural Resources and Utilities
Mines and parts of mines form a significant part of this category, with features at 1:10,000 more commonly depicted to scale. More specific instruction regarding the placement of symbols is sometimes provided at 1:10,000, e.g. in the case of mines, these symbols should be placed at the appropriate entrance or shaft at 1:10,000, but more generally at the location of the mine at 1:25,000. Unlike with different types of vegetation, different types of natural resources tend to be named at both scales, including gas, peat, salt, oil and metallic materials. The symbology relating to utilities, including water and electricity infrastructure, is comparable at both scales, although the height and construction material of power lines is described in more detail at 1:10,000. Some more obscure water features only appear at 1:10,000 (such as a ‘kariz’) while others are included at both scales (such as ‘artesian well’ and ‘sakia’).
Relief and Geomorphology
At 1:25,000, elevation is marked using contour lines with slope direction indicators. Additional contour types, such as principal or supporting contours, are added at 1:10,000. The symbology also includes a range of geological and geomorphological features, which tend to be shown to scale at 1:10,000 and not to scale at 1:25,000. Such features include ‘ravine or gully’, ‘cliff’, ‘volcanic crater’, ‘karst or pseudo-karst sinkholes’, ‘lava flow’ and various features of glaciers and moraines. Very small features are also included, such as ‘rubble mound’ and ‘separate stone’.
Rail Transport
The symbology for railways is similar at both scales, including the number of lines shown and whether the track is electrified, narrow gauge, under construction, or disused. The 1:10,000 symbology includes a small number of additional types of lines, including ‘monorail’, ‘funiculars and mountain railways’ and ‘railways on trestles’. Many of the additional symbols at 1:10,000 are parts of stations which are separated out at this scale, such as ‘patrol huts’, ‘position post’, ‘signal light gantries’ and ‘floodlight towers’. At 1:25,000, a generic ‘station’ symbol is used in place of many of these features, although variants of this symbol indicate the position of the main station building in relation to the railway line.
Settlements
The symbols in this category mainly comprise those denoting individual buildings, or those generalizing built-up areas into ‘blocks’. Many of the supplementary symbols from the compilation manual for city plans (General Staff, Citation1978) are in this category, indicating that the symbology for buildings and built-up areas on city plans differs from smaller-scale topographic maps. Distinctions are made between ‘fire-resistant’ and ‘non-fire-resistant’ blocks, as well as planned areas, densely and sparsely built areas. The compilation manual also includes the colour-coded ‘important objects’ which are unique to the city plan series, i.e. administrative buildings in magenta, military-communications buildings in green and military-industrial buildings in black. This colour coding of buildings is used on the city plans at both scales.
Religious and Burial Sites
Places of worship are included at both scales, but only those relating to Christianity, Islam and Buddhism. Christian churches are marked with a cross pattée, Islamic sites with a left-facing crescent, and Buddhist sites with a pagoda-like symbol. No other religions are represented in the specifications. At 1:10,000, the design of symbols for places of worship varies to indicate different construction materials and how they are drawn ‘to scale’ or ‘not to scale’. Burial sites are accommodated by a number of symbols distinguishing between cemeteries with and without trees. At 1:10,000, further detail is provided regarding the type of trees present (deciduous or coniferous) in the cemetery, and symbols to indicate animal burials and individual monuments or graves. Most of the symbols relating to burial sites feature a cross symbol, or repeated cross symbols over an area. There is no differentiation of burial sites affiliated with different religions, although a Central Asian ‘suburgan’ is included, featuring a triangular flag and no cross.
Industry and Communications
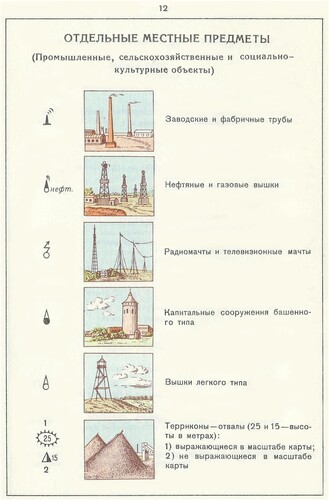
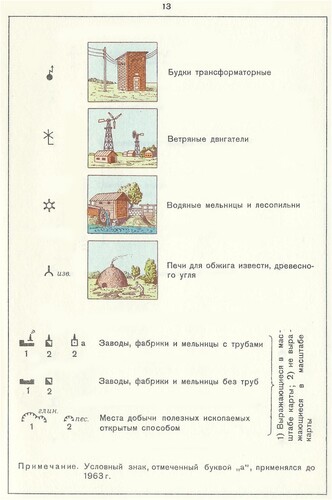
Many of the features in this category are factories and parts of factories, such as towers, chimneys and lights (). Other industry-specific features are included at both scales, including ‘water mill’, ‘windmill’ and ‘meteorological station’. Also included are elements of communications infrastructure, including radio and television transmitters and cables. ‘Underground or underwater cables’ are distinguished at 1:10,000 but not at 1:25,000.
Figure 9. Pages from the 1:25,000 specifications (General Staff, Citation1966), indicating the symbolization of various structures and associated illustrations to aid their accurate implementation.
Air and Water Transport
The symbology of features in this category is very similar at both scales, including ‘aerodrome’, ‘train ferry’, ‘moorings and marinas’, ‘jetty or pier’ and ‘lighthouse’. Some additional detail is included at 1:10,000, such as the number of lights on a lightship, but there is much more emphasis on water transport than on air travel at both scales.
Geodetic Points
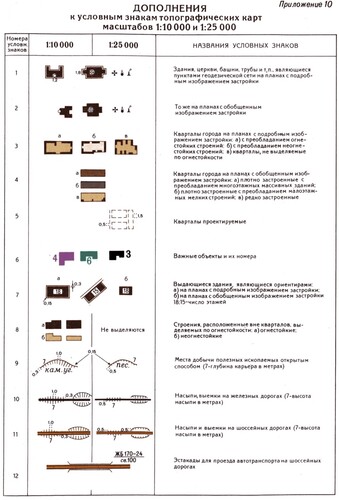
As geodetic points are ‘scaleless’, the difference between the 1:10,000 and 1:25,000 symbologies in this category is negligible. Although there are some ‘to scale’ and ‘not to scale’ variants, these relate to geodetic points on structures and therefore follow the conventions of regular buildings. Several such symbols are included in the compilation manual for city plans, which indicates that they are unique to the city plan series ().
Figure 10. A page from the compilation manual for city plans (General Staff, Citation1978), indicating the symbols to be used for showing various types of building in the city plan series.
Agriculture and Animal Enclosures
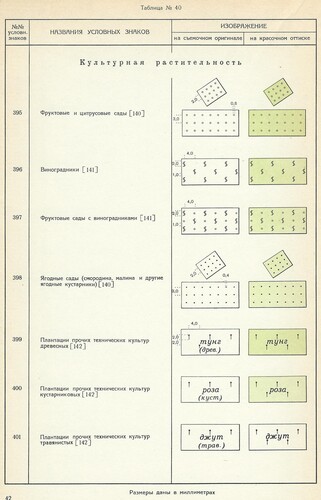
Pastoral land is usually displayed as ‘white’ space on Soviet maps at all scales. As a result, many of the agricultural symbols relate to arable land, with various pattern fills for ‘rice fields’, ‘industrial crops’, ‘fruit or citrus garden or orchard’, ‘vineyard’ and ‘greenhouses’ (). However, there are symbols at both scales for a ‘paddock’ and ‘apiary’.
Figure 11. The beginning of the ‘Cultivated vegetation’ section in the 1:10,000 specifications (GUGK, Citation1968).
Boundaries
The symbols in this category incorporate both physical barriers and administrative boundaries. At 1:25,000, ‘stone or brick wall or metal fence’ and ‘ancient historical wall’ are the only barriers denoted. At 1:10,000, this is expanded to other forms of barrier, including ‘wooden fence, hedge or other light barrier’, ‘barbed wire entanglements’ and ‘artificial mounds, dams and bolsters’. Administrative boundaries are similar at both scales, including more generic features including ‘state border; and ‘regions, autonomous areas and national divisions’, in addition to more location-specific boundaries, such as ‘border of republics of the USSR’ and ‘border of polar positions of the USSR’. ‘State border’ and ‘border of polar positions of the USSR’ are the only two types of boundary included in the compilation manual for city plans for use on that series.
Examination of the city plans
The 19 city plans in this sample exhibit a broad variation in their utilization of the symbology as defined in the cartographic specifications (). The examination of the plans also reveals that some symbols were used interchangeably between the two scales. Of the 1:10,000 plans, the largest variety of symbols is found on the plan of Frankfurt am Main (126) and the smallest variety is on the plan of La Paz (56) (). At 1:25,000, the range is narrower, with the largest variety on Halifax (95) and the smallest on Miami (69) (). Although the environmental characteristics of each of these cities play a role in the range of symbols adopted, the geographical pattern of this range () suggests that access to source materials (such as indigenous topographic mapping and other geospatial resources) also influences the range of symbols used. For example, the 1980 city plan of Topar (a small city in the Kazakh SSR, with a population of under 10,000), uses the same number of unique symbols (87) as the plan of the megacity of Cairo (Egypt). Similarly, Freetown (Sierra Leone) and Gloucester (UK) use 86 and 84 symbols respectively. If the number of symbols tends to decrease with distance from the Soviet Union both spatially and geopolitically, it could also explain the more pronounced difference between Namangan (then located within the Uzbek Soviet Socialist Republic) with 112 symbols and La Paz (Bolivia), which uses exactly half as many ().
Figure 12. Map showing Soviet military city plans analysed in the sample, with proportional circles indicating the number of symbols used on each plan.
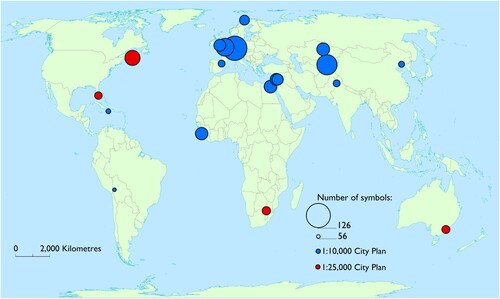
Figure 13. Details from the city plans of Frankfurt am Main, West Germany (1983) (left, private collection) and La Paz, Bolivia (1977) (right, Institut Cartogràfic i Geològic de Catalunya, RM.165446), which respectively adopt the most and fewest symbols in the sample at 1:10,000.
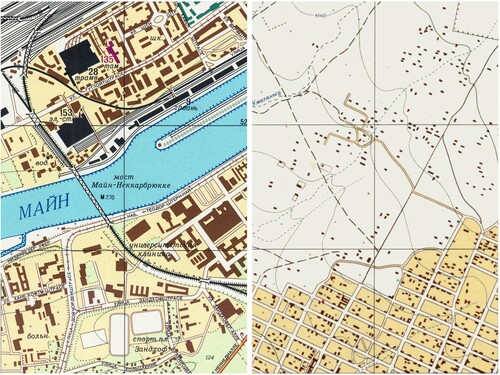
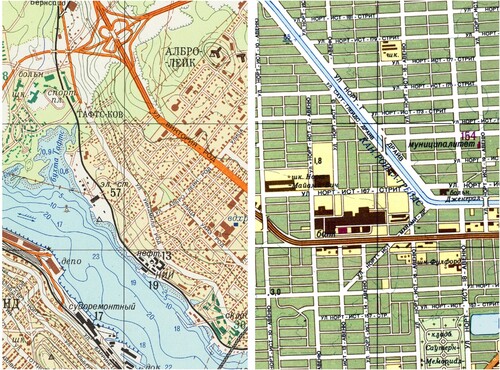
Figure 14. Details from the city plans of Halifax/Dartmouth, Canada (1974) (left, private collection) and Miami, USA (1984) (right, private collection), which respectively adopt the most and fewest symbols in the sample at 1:25,000.
In terms of the proportion of the symbology implemented in the sample, the range available is underutilized. Of the 630 symbols identified from the Soviet specifications, less than half (302 or 47.9%) were used at least once in the sample of 19 cities. Although it includes the widest variety of symbols examined here, the plan of Frankfurt am Main only uses 23.6% of the total available symbology for city plans at 1:10,000. Only five symbols (i.e. ‘general fire-resistant building’, ‘highway’, ‘contour slope direction indicator’, ‘individual tree with no value as reference point’, and ‘outline of vegetation and soil’) appear on every plan in this sample.
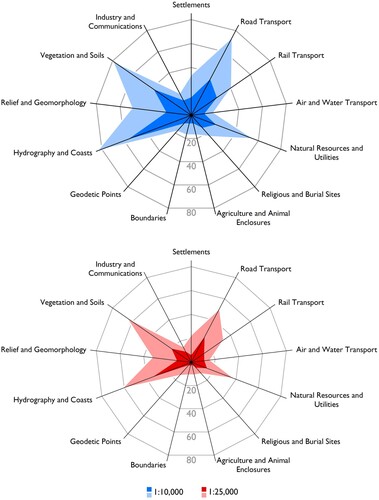
Regarding the balance of symbols used among the 13 categories, it is clear that most symbols available in each of these were not utilized, with the exception of ‘Hydrography and Coasts’ (). This is the case for both scales of city plan examined here (1:10,000 and 1:25,000). However, as demonstrated by a pair of star plots (), the relative balance of categories exhibited in the symbol counts of the plans corresponds closely to the relative balance of categories presented in the symbology. This suggests that the prioritization of various categories (and, hence, particular themes or features) was maintained in the mapping of cities, even if the gamut of symbols available was not fully exploited.
Figure 15. Specification symbol counts for city plans in the sample category (dark), relative to the number of specification symbols in that category (light).
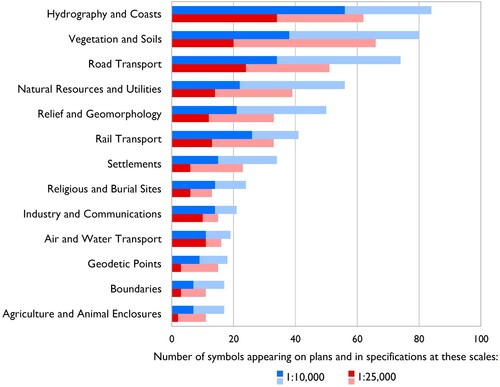
Figure 16. Star plots showing the specification symbol counts for the sample of city plans by category (dark), relative to the total number of specification symbols in that category (light), by scale. The axes used are the same as those in and .
For individual cities, differences in the relative balance of categories (and hence, the proportion of the symbology they use) are more apparent. Cities with a more even balance of categories (such as Frankfurt am Main, Namangan, Boulogne-sur-Mer, Halifax and Maine) lie in contrast to those with a focus on fewer categories (e.g. Cairo, Damascus, Amritsar, Zaragoza and Canberra) ( and ). The latter group, in particular, demonstrates a proliferation of symbols associated with hydrography and road (and sometimes rail) transport features. This pattern, among these relatively remote cities, implies that these categories were prioritized, or were at least mapped more easily from the sources available. For these cities, indigenous road/rail maps and reconnaissance imagery may have presented the most reliable sources in the absence of detailed topographic mapping, and were possibly complemented by Soviet hydrographic survey.
Figure 17. Star plots on identical axes for each 1:10,000 city plan in the sample, showing the relative emphasis on each category.
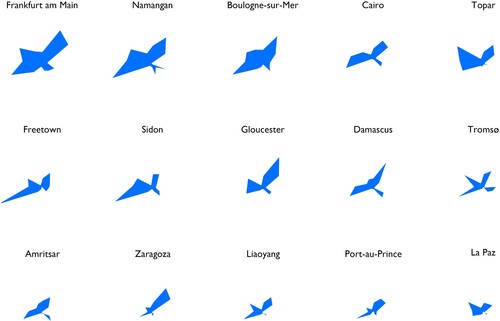
Figure 18. Star plots on identical axes for each 1:25,000 city plan in the sample, showing the relative emphasis on each category.

In addition to those symbols defined in the cartographic specifications, a small range of other symbols are used in the sample. These improvised or ‘new’ symbols are explained in a brief legend on the plan, since they are not included in the official specifications. Their creation is explained by article 11 of the compilation manual for city plans (General Staff, Citation1978):
При необходимости применения дополнительных условных знаков и характеристик объектов, не предусмотренных в таблицах условных знаков, разрешается как исключение вводить новые условные знаки с обязательным пояснением их в зарамочном оформлении.
[If necessary, use additional symbols and characteristics of objects not specified in the tables of conventional symbols. As an exception, introducing new symbols is allowed, along with a mandatory explanation of them in the marginalia.]
Figure 19. The number of specification symbols (dark) and ‘new’ (improvised) symbols (light) appearing on city plans in the sample.
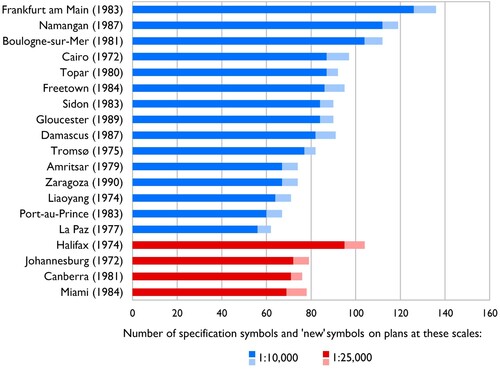
Figure 20. The number of ‘new’ (improvised) symbols in the 19-plan sample, by category. The ‘Unknown’ category represents symbols that are neither explained on the plan nor appear in the official symbol specifications.
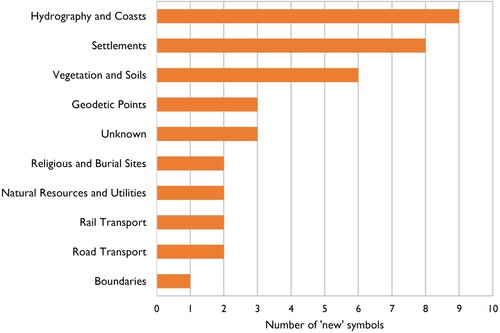
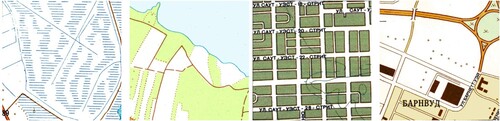
Figure 21. Examples of additional symbols from the sample (left to right); general passable marsh (Freetown), general vegetation (Cairo), densely built low-rise buildings (green hachure) (Miami), general bridge (Gloucester) (all private collection).
Discussion
Characteristics of the Soviet symbology
Although previous studies of Soviet military city plans (e.g. Davies, Citation2005a; Citation2005b; Kent and Davies, Citation2013) have noted their rich topographic detail, by consulting the original cartographic specification documents it was possible to quantify this symbology as comprising some 630 graphical symbols. To put this finding into context, this total (which is aggregated from the cartographic specifications for topographic maps at 1:10,000 and 1:25,000 plus the supplementary instructions for city plans) is particularly high when compared with the symbologies adopted by national topographic map series (albeit whose principal focus is on meeting the requirements of mapping specifically national landscapes). Although quantitative studies of topographic map symbology are rare, the Soviet symbology of 1:25,000 is identical to that of 1:50,000 (General Staff, Citation1966), which allows a direct comparison with the symbologies of 20 European state 1:50,000 topographic maps analysed by Kent and Vujakovic (Citation2009). Excluding symbols from the Soviet compilation manual for city plans, a total of 357 graphical symbols are available for use on Soviet topographic maps at 1:25,000 or 1:50,000. This is substantially greater than the 1:50,000 symbology of Slovenia, which incorporated 218 symbols and was itself an outlier in the sample of 20 European symbologies analysed by Kent and Vujakovic (Citation2009) ().
Figure 22. A comparison of symbol counts in the symbologies adopted by various European national mapping organizations in topographic maps at 1:50,000 (from Kent and Vujakovic, Citation2009), including the equivalent Soviet symbol count of 357 (derived from General Staff, Citation1966).
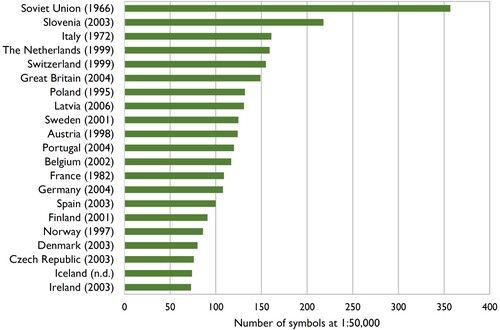
While the symbologies represented in are not contemporaneous, the differences in their scope are striking. As Kent and Vujakovic (Citation2009) noted, European countries whose producers of official topographic mapping have a legacy of military impetus (i.e. Belgium, France, Great Britain, Italy, The Netherlands, Slovenia, Sweden, and Switzerland) generally adopt a greater number of discrete symbols for their civilian topographic maps. Given the military context of the Soviet topographic mapping programme, its extensive symbology supports this finding.
Furthermore, the military circumstances of the Soviet city plans’ production are reflected in their intended purpose to provide ‘accurate measurements and assessments […] significant for the peoples’ economy and for defence’ (General Staff, Citation1978). This purpose also influences the relative balance of topographic features included in their symbology, as analysed according to the typology described above. The relative importance of each category, as implied by the quantity of associated symbols, reflects these military priorities. Hence, the stated focus on ‘economy’ and ‘defence’ may be realized in the plans’ pronounced focus on physical features (e.g. hydrography and vegetation) and on industry, rather than on social or cultural features. These categories are especially relevant to the conduct of military operations (e.g. passability and strategic value), but suggest a wider range of potential purposes such as resource management and requisitioning. This integrated approach to classifying the landscape at such a high level of detail therefore supports troops in their assessment of terrain, but also supports economic development, particularly infrastructure and industry. This is reiterated by the routine practice of depicting disused railways, tramways and abandoned mines on the city plans (Davies and Kent, Citation2017; Kent, Citation2021).
The findings regarding the size and priorities of the Soviet symbology, including that ‘Hydrography and Coasts’ is the largest feature category, are consistent with the broader observation of Vereshchaka (Citation2002) that the comprehensiveness of Russian topographic symbology and its incorporation of hydrographic information, as inherited from the Soviet era, are its defining characteristics.
Despite these thematic foci, the scope for such a wide range of information to be included on city plans suggests that they were intended to function more as multi-purpose repositories of geospatial intelligence than, for example, as invasion plans. This is supported by the view that, in the pre-digital era when paper maps served as the dominant medium for storing and presenting geospatial data simultaneously, the Soviet military city plans offered the most effective means of recording and communicating geospatial intelligence about foreign settlements.
Variations in implementing the Soviet symbology
Although the Soviet symbology is particularly extensive, especially when compared to European topographic mapping, in practice it was largely underutilized. The examination of the 19 city plans in the sample indicates that barely half of the symbols available were used for mapping any one city. While the specification documents represent an ideal, theoretical scope for Soviet military city plans, the star plots in indicate that the range of symbols used on the plans themselves is considerably smaller. As may be expected, due to associated levels of generalization, the 1:10,000 symbology is more detailed than the 1:25,000 symbology, both in the specifications and on the plans. However, also indicates that the relative balance of features at both scales is similar and that, despite utilizing a small proportion of the available symbols overall, this relative balance of features is generally well-preserved at both scales. While the full scope and detail of the Soviet symbology has not been implemented on the plans in this sample, the stated priorities of the military global city plan project, which are made clear in the symbol specifications, are retained in their similar balance of symbol categories.
Despite their underutilization of an extensive symbology, Soviet cartographers routinely created ‘new’ symbols, i.e. those not found in the specification documents, to represent phenomena. The specifications did not accommodate uncertainty in their identification of features and Soviet cartographers therefore had to improvise by devising their own symbols and solutions, i.e. beyond the specifications, to successfully map a wide range of natural and urban environments. Since every plan in this sample adopts these improvised symbols, the specifications represent an ideal that was hard to fully put into practice, possibly because the source materials available did not provide sufficient detail to allow an interpretation of the landscape at the level of precision demanded by the cartographic specifications for selecting an appropriate symbol. Consequently, a notably low proportion of specification symbols were used, and a new, more generic, range of symbols had to be created by the cartographers when producing city plans.
Nevertheless, it is important to recognize that the Soviet specifications for topographic mapping were revised regularly to meet the changing requirements of the state, particularly in mapping the vast domestic territories of the USSR. The Soviet period alone saw more than ten editions (from 1921 through to 1983) (Vereshchaka, Citation2002) and the successive reissue of these specifications suggests a dynamic and evolving symbology that grew from its domestic origins to encompass a global scope of diverse environments. The detail given in the specifications for mapping certain features, such as the suburgans, sakias, and kariz found in the former Soviet republics of Central Asia, demonstrates the legacy of this evolution and suggests that the development of Soviet symbology was a more organic process than the rigours of global standardization might otherwise suggest.
Conclusion
The results of this study indicate the comprehensive scope of the Soviet military city plan symbology, as defined by its original specification documents. The symbology was intended to be sufficiently extensive and versatile for the task of mapping diverse environments around the globe, and, in comparison with European topographic mapping, it incorporates a substantially high variety of symbols for this purpose. Similarly, in comparison with other global mapping initiatives, such as the International Map of the World (IMW), the success of the Soviet military mapping programme – in terms of the extent of its coverage and its consistency – also illustrates the benefits of a standardized approach under the control of a single organization, albeit a military body serving national geostrategic interests.
A critical analysis of the Soviet symbology reveals some problems with its practical implementation, particularly in its underutilization. The symbol specifications were created without full knowledge of the sources available for the compilation and production of each plan, and an ideal range of accurate and detailed cartographic material was, as this analysis suggests, rarely available. Nonetheless, despite the underutilization of this symbology, the relative prioritization given to specific topographic elements (such as hydrography and transport) in the city plans examined in this sample reflects the emphasis on these categories in the official symbol specifications. More generally, this study confirms that symbol specifications are not necessarily applied exhaustively on maps, and cartographic studies that rely solely upon these documents for content analysis can yield misleading results. It is therefore recommended that content analyses of topographic and associated modes of systematic mapping should not necessarily use maps or their specifications as a proxy for one another.
Although the Soviet military mapping of foreign towns and cities originated in the Second World War and developed within the geopolitical context of the Cold War, the global project nevertheless offers some insights and potential recommendations for current and future mapping initiatives that aim to provide a global geospatial resource. In summary:
− Soviet military city plans incorporate an unusually wide range of highly detailed, globally standardized topographic and hydrographic information. The analysis in this study has indicated how this was achieved through a consistent symbology of substantial breadth and depth, providing a model for the classification and design of global topographic data; and
− Despite its scope, the inability of the Soviet symbology to accommodate uncertainty in landscape interpretation necessitated the routine adoption of improvised solutions. This study highlights the need for any globally versatile symbology to account for uncertainty and to consider the varying quality and availability of source data when defining the precision with which topographic features should be defined and symbolized.
The process of mapping is rooted in pragmatism and it is clear that the considerable success of the Soviet military mapping project – particularly in terms of its global scope and coverage – would not have been possible without due consideration of the practical problems associated with mapping a diverse range of environments remotely. The analysis presented here therefore indicates how the Soviet military mapping project may offer salient lessons for overcoming the ongoing challenges of large-scale topographic mapping around the world today, including the effective harmonization and sharing of international datasets. These lessons may prove vital in developing new geospatial resources that will enable us to manage the global diversity of urban and natural environments more sustainably.
Disclosure statement
No potential conflict of interest was reported by the author(s).
Additional information
Notes on contributors

Martin Davis
Martin Davis is based in the Research and Higher Education Division of the Royal Geographical Society (with IBG) in London. After receiving the British Cartographic Society’s inaugural Ian Mumford Award in Citation2015, Martin completed his PhD in Geography at Canterbury Christ Church University in Citation2018. He has been Editorial Assistant and Book Reviews Editor of The Cartographic Journal since 2014 and, in Citation2019, was appointed Executive Secretary of the International Cartographic Association (ICA) Commission on Topographic Mapping.

Alexander J. Kent
Alexander J. Kent is Reader in Cartography and Geographic Information Science at Canterbury Christ Church University in the UK, where he lectures on map design, GIS, remote sensing and on European and political geography. His research explores the relationship between maps and society, particularly the intercultural aspects of topographic map design and the aesthetics of cartography. He is also Chair of the International Cartographic Association (ICA) Commission on Topographic Mapping and formerly President of the British Cartographic Society.
References
- Barber, P. and Carlucci, A. (2001) Lie of the Land: The Secret Life of Maps (Exhibition Guide) London: British Library.
- Böhme, R. (1993) Inventory of World Topographic Mapping, Volume 3: Eastern Europe, Asia, Oceania and Antarctica London and New York: International Cartographic Association/Elsevier Applied Science.
- Collier, P., Pearson, A. and Forrest, D. (1998) “The Representation of Topographic Information on Maps – Vegetation and Rural Land Use” The Cartographic Journal 35 (2) pp.191–197 DOI:10.1179/caj.1998.35.2.191.
- Cruickshank, J.L. (2007) “German-Soviet Friendship’ and the Warsaw Pact Mapping of Britain and Western Europe” Sheetlines 79 pp.23–43.
- Cruickshank, J.L. (2008) “Views from Moscow” Sheetlines 82 pp.37–49.
- Cruickshank, J.L. (2012) “Teaching OS Map-reading as a Foreign Language” Sheetlines 94 pp.23–32.
- Cruickshank, J.L. (2020) “The Evolution of Soviet Topographic Maps as Revealed by their Published Supporting Documentation” The Cartographic Journal DOI:10.1080/00087041.2021.1879507.
- Davies, J. (2005a) “Uncle Joe Knew Where You Lived: The Story of Soviet Mapping of Britain (Part I)” Sheetlines 72 pp.26–38.
- Davies, J. (2005b) “Uncle Joe Knew Where You Lived: The Story of Soviet Mapping of Britain (Part II)” Sheetlines 73 pp.1–15.
- Davies, J. (2006) Review of Russian Military Mapping: A Guide to Using the Most Comprehensive Source of Global Geospatial Intelligence by Psarev, A.A. (trans. Gallagher, P.) The Cartographic Journal 43 (3) pp.259.
- Davies, J. (2010) “Soviet Military City Plans of British Isles” Sheetlines 89 pp.23–24.
- Davies, J. and Kent, A.J. (2017) The Red Atlas: How the Soviet Union Secretly Mapped the World Chicago: University of Chicago Press.
- Davis, M. (2015) Soviet military city plans. Provisional list of known plans (Dataset) Available at: https://s3.eu-west-2.amazonaws.com/redatlas/SovietMilitaryCityPlansList.pdf (Accessed: 8th July 2021).
- Davis, M. and Kent, A.J. (2017) “Improving User Access to Soviet Military Mapping: Current Issues in Libraries and Collections Around the Globe” Journal of Map & Geography Libraries 13 (2) pp.246–260 DOI:10.1080/15420353.2017.1300206.
- Davis, M. and Kent, A.J. (2018) “Identifying Metadata on Soviet Military Maps: An Illustrated Guide” In Altić, M., Demhardt, I. J. and Vervust, S. (Eds) Dissemination of Cartographic Knowledge Cham: Springer International pp.301–314.
- General Staff (1966) Условные знаки, топографических карт СССР [Conventional Signs for Topographic Maps of the USSR] Moscow: Military Topographic Service.
- General Staff (1978) Руководство по картографическим и картоиздательским работам: часть 4 - составление и подготовка к изданию планов городов [Manual for Cartography and Cartographic Reproduction Works: Part 4 – Compilation and Preparation for Printing of City Plans] Moscow: Military Topographic Service.
- GUGK (1968) Условные знаки для топографических карт масштаба 1:10,000 [Conventional Signs for Topographic Maps, Scale 1:10,000] Moscow: Main Administration of Geodesy and Cartography.
- Kent, A.J. (2009) “Topographic Maps: Methodological Approaches for Analyzing Cartographic Style” Journal of Map & Geography Libraries 5 (2) pp.131–156 DOI:10.1080/15420350903001187.
- Kent, A.J. (2021) “The Soviet Military 1:10,000 City Plan of Dover, UK (1974)” International Journal of Cartography 7 (2) pp.245–251 DOI:10.1080/23729333.2021.1910185.
- Kent, A.J. and Davies, J. (2013) “Hot Geospatial Intelligence from a Cold War: The Soviet Military Mapping of Towns and Cities” Cartography and Geographic Information Science 40 (3) pp.248–253 DOI:10.1080/15230406.2013.799734.
- Kent, A.J. and Davies, J. (2019) “The Secret Soviet Military Mapping of Malta” Imago Melitae (Proceedings of the 10th Anniversary Seminar of the Malta Map Society San Anton Palace: 23rd November 2019), pp.23–30.
- Kent, A.J., Davis, M. and Davies, J. (2019) “The Soviet Mapping of Poland – A Brief Overview” Miscellanea Geographica 23 (1) pp.5–15 DOI:10.2478/mgrsd-2018-0034.
- Kent, A.J. and Vujakovic, P. (2009) “Stylistic Diversity in European State 1:50,000 Topographic Maps” The Cartographic Journal 46 (3) pp.179–213 DOI:10.1179/000870409X12488753453453.
- Lee, K.D. (2003) Terrain Analysis of Afghanistan Minneapolis: East View.
- Lee, K.D. and Shumakov, A. (2003) “Russian Data Illuminate World Mapping” Imaging Notes (Spring) pp.16–19.
- Postnikov, A.V. (2002) “Maps for Ordinary Consumers Versus Maps for the Military: Double Standards of Map Accuracy in Soviet Cartography, 1917–1991” Cartography and Geographic Information Science 29 (3) pp.243–260 DOI:10.1559/152304002782008431.
- Psarev, A.A. (2005) Russian Military Mapping: A Guide to Using the Most Comprehensive Source of Global Geospatial Intelligence (trans. Gallagher, P.) Minneapolis: East View Cartographic.
- Svenningsen, S.R. and Perner, M.L. (2020) “Soviet Cold War Maps: Examining the Organization and Practices of Production Through the Case of Denmark” The Cartographic Journal DOI:10.1080/00087041.2019.1660518.
- Travers, D. (2008) “Soviet Military Mapping of Ireland During the Cold War: Galway and the Western Littoral” Journal of the Galway Archaeological and Historical Society 60 pp.178–193.
- Vereshchaka, T.V. (2002) Топографические карты научные основы содержания [Topographic Maps: The Scientific Principles of Their Content] Moscow: MAIK Nauka/Interperiodika.
- Watt, D. (2005) “Soviet Military Mapping” Sheetlines 74 pp.1–4.