
Abstract
The economic potential of the germplasm of medicinal species is a rich resource that should be preserved and used. The medicinal species Echinodorus grandiflorus and Sagittaria montevidensis belong to the family Alismataceae. Depurative, diuretic, anti-inflammatory, antivenin, and anti-rheumatic actions have been associated with E. grandiflorus, where the leaves are the main part used. Sagittaria montevidensis does not yet have its medicinal properties known and has a wide morphological variability, and is sometimes confused with E. grandiflorus. The present study aimed to evaluate the genotoxic and antiproliferative potential of extracts of dry leaves of E. grandiflorus and S. montevidensis on the cell cycle of Allium cepa, as well as undertake analysis by high performance liquid chromatography (HPLC-DAD) for the quantification of the compounds from the extracts. A. cepa bulb rootlets were submitted to the extracts for 24 h, prepared from plant material at two concentrations, 6 g dm−3 and 24 g dm−3 for each species, and two controls. Afterwards, the analysis of cell division and calculation of the mitotic index was undertaken. Part of the extracts was analyzed by HPLC-DAD. The results differed significantly between the controls and the treatments of both groups; the species did not have antimutagenic activity. The phytochemical analysis presented higher levels of caffeic acid and flavonoid glycoside in E. grandiflorus and phenolic glycoside in S. montevidensis. This study showed that the extracts of E. grandiflorus and S. montevidensis contain genotoxic potential and when used in high concentrations, anti-proliferative potential. HPLC-DAD revealed flavonoids and phenolic acids for both species.
1. Introduction
Over millennia, different peoples have used medicinal plants for treating ailments. Medicinal plants are those that produce bioactive compounds that can be extracted from leaves, flowers, fruit, bark, roots, etc., in teas or other forms of medicine which can be used in phytotherapeutic treatment. Medicinal plants are still used by many peoples around the world, a traditional practice that has received incentives from the World Health Organization due to social and economic factors (Frescura et al. Citation2013). These plants are an alternative form of therapy that is easily accessible to the population, thus their preservation is vital due to their economic potential. For this, it is essential to conserve plant genetic diversity with research on the characterization of these plants, from biological to agricultural levels.
Due to bioactive substances in phytotherapeutic teas, studies that involve the genotoxicity and antiproliferative effect of medicinal plants are crucial for detecting the possible eventual harm caused to target organisms. Many compounds that are part of the chemical composition of plants used in medicine can be mutagenic or even carcinogenic (Alves dos Santos et al. Citation2008; Ciğerci et al. Citation2016), when ingested indiscriminately. Thus, tests that serve as biomarkers are useful as indicator systems (Silva et al. Citation2003).
Plant test systems, such as Allium cepa L., have been used for preliminary studies on the effects caused by plant extracts, in order to detect potential genotoxicity (Camparoto et al. Citation2002; Knoll et al. Citation2006; Frescura et al. Citation2013; Zafred et al. Citation2016). The A. cepa test system identifies possible toxic effects, by evaluating the genotoxicity, cytoxicity, toxicity and antimutagenic activity, and serves as a bioindicator. Allium cepa is highly sensitive and correlates with other test systems, principally with those using animals (Chauhan and Gupta Citation2005; Zafred et al. Citation2016). It has been validated by the International Programme on Chemical Safety (IPCS, WHO), World Health Organization and by the United Nations Environmental Programme (UNEP) as an effective test for the analysis and in situ monitoring of the genotoxicity of environmental substances (Mauro et al. Citation2014; Roberto et al. Citation2016).
The medicinal species Echinodorus grandiflorus (Cham & Schltdl.) Micheli and Sagittaria montevidensis Cham. & Schlecht belong to the Family Alismataceae. Echinodorus grandiflorus has depurative, diuretic, anti-inflammatory, antivenin, and anti-rheumatic actions, and the leaves are the main portion used. Sagittaria montevidensis does not yet have its medicinal properties known and has a wide morphological variability, and is sometimes confused with E. grandiflorus.
Here, we evaluate the genotoxic potential of populations of Echinodorus grandiflorus and Sagittaria montevidensis on the A. cepa test system at different concentrations and compare these effects among populations collected in different locations. This evaluation was undertaken by observing cell division inhibition and cell morphological alterations as well as chromosomal damages in A. cepa, submitted to extracts, serving as an indicator of possible damages to other cell types, mainly to human cells. To complement the genotoxic analysis, chromatographic analyses were undertaken to obtain data on the referent phytochemical composition of the species.
2. Materials and methods
2.1. Materials
The plant material consisted of individuals of E. grandiflorus and S. montevidensis collected in the regions of Silveira Martins=SvM (Pop.1 of S. montevidensis) 29°68′97.97ʺS, 53°62′88.04ʺW, São Sepé=SS (Pop. 1 of E. grandiflorus) 30°15′83.98ʺS, 53°58′84.59ʺW, group 1; and Santa Maria=SM (Pop. 2 of S. montevidensis) 29°64′47.06ʺS, 53°73′92.41ʺW and Pinhal Grande=PG (Pop. 2 of E. grandiflorus) 29°32′76.71ʺS, 53°33′19.81ʺW, group 2, in the state of Rio Grande do Sul, Brazil from leaves of field material and of E. grandiflorus commercialized in a supermarket as a medicinal tea, separated in two experimental groups. The collected material was identified according to usual taxonomic rules (Mori et al. Citation1989) and a part was deposited in the Herbarium SMDB of the Department of Biology at the UFSM, under the ID: Canto-Dorow et al. 1481 (SMDB) (Pop.1 of S. montevidensis), Canto-Dorow et al. 1482 (SMDB) (Pop. 1 of E. grandiflorus), Canto-Dorow et al. 1483 (SMDB) (Pop. 2 of S. montevidensis) and Canto-Dorow et al. 1484 (Pop. 2 of E. grandiflorus).
The experiments were carried out in the Laboratory of Plant Cytogenetics and Genotoxocity, Natural and Exact Sciences Center of the UFSM.
2.2. Methods
Leaves from plants collected in the forest and from dry specimens bought in a supermarket were used for preparing the extracts. The aqueous extracts from leaves collected in the field (dried at room temperature) and from those acquired commercially were prepared at two concentrations: 6 g dm−3 and four times more concentrated 24 g dm−3, the 6 g dm−3 being the traditional concentration used by the population in general to prepare the tea (Pastori et al. Citation2013). Dry leaves were infused in distilled water and boiled for 15 min. The extracts were strained through a sieve of 10-mesh sieve and after reaching room temperature, used for rooting the A. cepa bulbs and for HPLC analyses.
2.2.1. Allium cepa analyses
Meristematic cells of A. cepa rootlets were used as the test system to evaluate the morphological and structural cell alterations and to determine the mitotic indices.
For experimental group 1, eight groups of five bulbs were placed to root in distilled water, which constituted eight treatments with five replicates each. The following treatments were used: T1 – negative control in distilled water; T2 – aqueous extract of leaves of E. grandiflorus infused at 6 g dm−3 (SS); T3 – aqueous extract of leaves of E. grandiflorus infused at 24 g dm−3 (SS); T4 – glyphosate 15% + 24 h in the aqueous extract of leaves of E. grandiflorus infused at 24 g dm−3 (SS); T5 – aqueous extract of leaves of S. montevidensis infused at 6 g dm−3 (SvM); T6 – aqueous extract of leaves of S. montevidensis infused at 24 g dm−3 (SvM); T7 – glyphosate 15% + 24 h in the aqueous extract of leaves of S. montevidensis infused at 24 g dm−3 (SvM) (verifying antimutagenic activity); T8 – positive control in glyphosate 15%.
For experimental group 2, 10 treatments with five replicates each were placed to root in distilled water. The following treatments were used: T9 – negative control in distilled water; T10 – aqueous extract of leaves of E. grandiflorus infused at 6 g dm−3 (PG); T11 – aqueous extract of leaves of E. grandiflorus infused at 24 g dm−3 (PG); T12 – glyphosate 15% + 24 h in the aqueous extract of leaves of E. grandiflorus infused at 24 g dm−3 (PG) (verifying antimutagenic activity); T13 – aqueous extract of leaves of S. montevidensis infused at 6 g dm−3 (SM); T14 – aqueous extract of leaves of S. montevidensis infused at 24 g dm−3 (SM); T15 – glyphosate 15% + 24 h in the aqueous extract of leaves of S. montevidensis infused at 24 g dm−3 (SM) (to verify antimutagenic activity); T16 – positive control in glyphosate 15%; T17 – aqueous extract of leaves of E. grandiflorus “commercial” infused at 6 g dm−3; T18 – aqueous extract of leaves of E. grandiflorus “commercial” infused at 24 g dm−3.
All the groups were submitted to their respective treatments for 24 h, and the positive control used was glyphosate, as it is shown to induce chromosomal alterations in meristematic cells of Allium cepa (Souza et al. Citation2010; Tedesco and Laughinghouse Citation2012). Afterwards, the bulbs were placed again in distilled water for the respective recovery of the possible damage that occurred, for a period of 24 h. The rootlets of the bulbs of each treatment were collected and fixed in 3:1 (ethanol:acetic acid) for 24 h at room temperature, afterwards placed in alcohol 70% and stored in a refrigerator until slide preparation.
To observe possible antimutagenic activity, bulbs that had been previously submitted to glyphosate 15% (structural chromosomal-type mutations induced) for 24 h were used, and afterwards placed in extracts of E. grandiflorus and S. montevidensis (separately) for 24 h to observe the decrease of damages to A. cepa chromosomes.
In a third step, we analyzed onion bulb root cell division bulbs grown in the plant extracts and in the controls (water and glyphosate 15%). Rootlets of approximately 5 mm were collected, hydrolyzed in HCl 1 N for 5 min, then washed with distilled water and stained with acetic orcein 2%. Slides were prepared by the squashing technique adapted from Guerra and Souza (Citation2002). The meristematic region was placed under a cover slip and squashed using a small glass rod. Two slides per onion bulb were prepared. Slides were analyzed using a LEICA light microscope at 400×, counting the total number of cells in division and calculating the mitotic index (MI), based on the number of cells in division. 1000 cells per bulb were counted, which is a total of 5000 cells per group of bulbs per treatment per species in the study.
2.2.2. Analysis by high performance liquid chromatography (HPLC-DAD)
High performance liquid chromatography (HPLC-DAD) analyses were carried out on samples of the aqueous extracts of E. grandiflorus, E. grandiflorus “commercial”, and S. montevidensis, of both experimental groups at the Laboratory of Phytochemistry in the Department of Industrial Pharmacy at the UFSM (part of the Graduate Program in Pharmaceutical Sciences).
The components of the complex mixture (tea), obtained from leaves of E. grandiflorus and S. montevidensis, were determined by separation of substances using HPLC-DAD. Through this method the phenolic and flavonoid compounds of the aqueous extracts were obtained for each species at 24 g dm−3 for experimental group 1 and group 2.
All chemicals were of analytical grade. Methanol, acetic acid, gallic acid, chlorogenic acid, and caffeic acid were purchased from Merck (Darmstadt, Germany). Quercetin and rutin were acquired from Sigma Chemical Co. (St Louis, MO, USA). HPLC-DAD was performed with the HPLC system (Shimadzu, Kyoto, Japan), Prominence Auto Sampler (SIL-20A), equipped with Shimadzu LC-20AT reciprocating pumps connected to the degasser DGU 20A5 with integrator CBM 20A, UV-vis detector DAD (diode) SPD-M20A and Software LC solution 1.22 SP1.
Reverse phase chromatographic analyses were carried out under gradient conditions using a C18 column (4.6 mm × 150 mm) packed with 5 μm diameter particles; the mobile phase was water containing 2% acetic acid (A) and methanol (B), and the composition gradient was: 5% of B until 2 min and changed to obtain 25, 40, 50, 60 and 100% B at 10, 20, 30, 40, 50 min, respectively, following a slightly modified method by Sabir et al. (Citation2012). The infusions of E. grandiflorus and S. montevidensis leaves were analyzed at 24 g dm−3 in group 1 and 6 g dm−3 and 24 g dm−3 in group 2. The presence of five antioxidant compounds was investigated: gallic acid, chlorogenic acid, caffeic acid, quercetin and rutin. Identification of these compounds was performed by comparing their retention time and UV absorption spectrum with those of the commercial standards. The flow rate was 0.7 ml min−1, injection volume 50 μl and the wavelength was 254 nm for gallic acid, 325 nm for caffeic and chlorogenic acids, and 365 nm for quercetin and rutin. The samples and mobile phase were filtered through a 0.45 μm membrane filter (Millipore) and then degassed by ultrasonic bath prior to use. Stock solutions of standard references were prepared in the HPLC mobile phase at a concentration range of 0.020–0.200 mg ml−1 for quercetin and rutin; and 0.050–0.250 mg ml−1 for gallic, caffeic and chlorogenic acids. The chromatography peaks were confirmed by comparing their retention time with those of reference standards and by DAD spectra (200–500 nm). Calibration curves were the following: gallic acid: Y = 11503x + 1376.8 (r = 0.9998); chlorogenic acid: Y = 10955x + 1274.3 (r = 0.9995); caffeic acid: Y = 12764x + 1350.7 (r = 0.9999); rutin: Y = 13721 + 1168.4 (r = 0.9997) and quercetin: Y = 13495x + 1092.6 (r = 0.9999). All chromatography operations were carried out at room temperature and in triplicate.
2.2.3. Statistical analysis
Statistical analyses were used to compare the values of the mitotic indices and between the values of the chromosomal alterations by the chi-square (χ2) test using the program BIOESTAT®5.O (Ayres Citation2007). The Tukey test was used to test the results of HPLC.
3. Results
3.1. Allium cepa test system
The number of cells in interphase and in the different stages of cell division were observed from the total number of analyzed cells, and MI values were calculated (Table ).
Table 1. Number of cells in interphase, cell division, mitotic index, cell aberrations and total number of cell irregularities of root-tips cells of Allium cepa, submitted to aqueous extracts of Echinodorus grandiflorus and Sagittaria montevidensis.
For experimental group 1, the values related to the cell mitotic index were 7.6% for the negative control (water); 11.14% for T2 (6 g dm−3 of E. grandiflorus); 0.86% for T3 (24 g dm−3 of E. grandiflorus); 1.08% for T4 (E. grandiflorus antimutagenic); 9.64% for T5 (6 g dm−3 of S. montevidensis); 9.84% for T6 (24 g l−1 of S. montevidensis); 0.82% for T7 (S. montevidensis antimutagenic), and 1.02% for the positive control (15% glyphosate) (Table ).
For experimental group 2, the MI values were 3.38% for the negative control (T9=water); 4.82% for T10 (6 g dm−3 of E. grandiflorus); 1.88% for T11 (24 g dm−3 of E. grandiflorus); 0.4% for T12 (E. grandiflorus antimutagenic); 5.04% for T13 (6 g dm−3 of S. montevidensis); 1.84% for T14 (24 g dm−3 of S. montevidensis); 0.26% for T15 (antimutagenic of S. montevidensis); 0.16% for the positive control (T16=glyphosate 15%); 4.32% for T17 (6 g dm−3 of E. grandiflorus “commercial”) and 4.76% for T18 (24 g dm−3 of E. grandiflorus “commercial”) (Table ).
The genotoxic effect was evaluated by quantification and differentiation of normal cells (Figure (A)) of chromosomal aberrations, from the total number of dividing cells, number and type of aberrations, and the total number of irregular cells (Table ). Chromosomal aberrations, such as anaphasic and telophasic bridges (Figure (B–D)), binucleate cells (Figure (E)), laggard chromosomes (Figure (L)), breaks (Figure (H)) and disorganized cells (Figure (F), 1(G) and 1(K)) were observed. Also, a total of four binucleate cells in interphase were found and three cells with micronuclei (Figure (J)) (Table ).
Figure 1. Cells of Allium cepa in different phases of cell division: (A) normal cells from the treatment with E. grandiflorus 6 g dm−3 (Pop. 1); (B) cell with anaphasic bridge and breakage from the treatment with E. grandiflorus 6 g dm−3 (Pop. 1); (C) cell with anaphasic bridge from the treatment with E. grandiflorus 24 g dm−3 (Pop. 1); (D) cell with anaphasic bridge from the treatment with S. montevidensis 6 g dm−3 (Pop. 1); (E) binucleate cell in interphase from the treatment with S. montevidensis 24 g dm−3 (Pop. 1); (F) cell with disorganized prophase from the treatment with E. grandiflorus 6 g dm−3 (Pop. 1); (G) cell in telophase with disorganization from the treatment of E. grandiflorus 6 g dm−3 (Pop. 2); (H) cells in anaphase with chromosomal breakages from the treatments of S. montevidensis 24 g dm−3 (Pop. 2); (I) cell in anaphase with bridge and laggard chromosomes from the treatment with S. montevidensis 24 g dm−3 (Pop. 2); (J) cell with micronucleus from the treatment with E. grandiflorus 6 g dm−3 “commercial” (Pop. 2); (K) cell in telophase with a laggard chromosome from the treatment of E. grandiflorus 6 g dm−3 “commercial” (Pop. 2); (L) cell in disorganized anaphase and chromosomal breakage from the treatment with E. grandiflorus “commercial” 24 g dm−3 (Pop. 2). Scale: 10 μm.
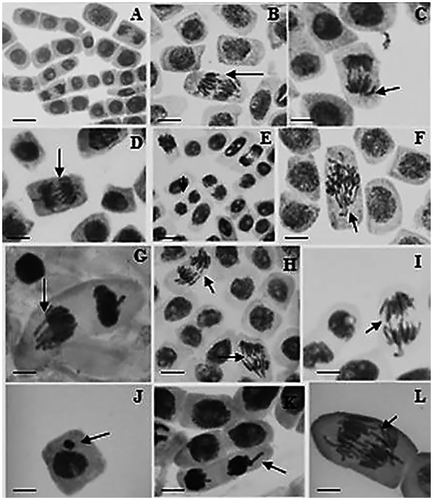
Figure 2. Representative high performance liquid chromatography profile of (a) Echinodorus grandiflorus, (b) Sagittaria montevidensis (group 1), (c) Echinodorus grandiflorus, (d) Echinodorus grandiflorus “commercial” and (e) Sagittaria montevidensis (group 2) leaf infusions. UV detection was at 325 nm. Gallic acid (peak 1), chlorogenic acid (peak 2), caffeic acid (peak 3), unidentified glycoside phenol (peak 4), rutin (peak 5), unidentified glycoside flavonoids (peaks 6 and 7) and quercetin (peak 8). Chromatographic conditions are described in the Methods section.
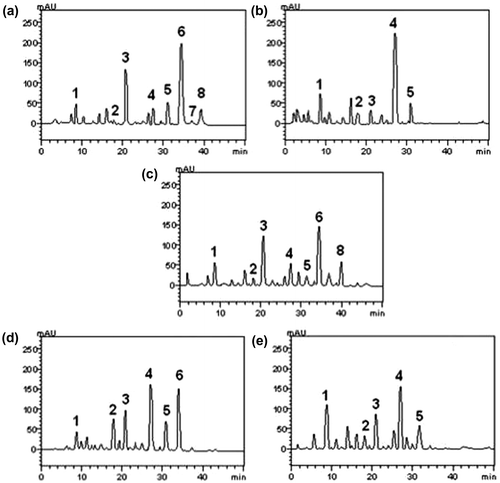
Table 2. Phenolic and flavonoid composition of Echinodorus grandiflorus, E. grandiflorus “commercial” and Sagittaria montevidensis, group 1 and group 2.
When analyzing the results obtained from group 1, there was a significant difference in chromosomal alteration values between the negative control, without alterations, and the positive control with five alterations (χ2 = 222.635).
Analyzing the results obtained from group 2, a significant difference was found in the chromosomal alteration values between the negative control (water) with three chromosomal alterations and the positive control (glyphosate 15%) with no alterations (χ2 = 146.842) (Table ). The positive control of these populations did not present alterations due to the small number of dividing cells (8/5000), while the negative control presented three, which might be the result of natural alterations, since it presented 169/5000.
3.2. High performance liquid chromatography (HPLC-DAD)
HPLC fingerprinting of Echinodorus grandiflorus and Sagittaria montevidensis, group 1, leaf infusions revealed gallic acid (tR = 8.35 min; peak 1), chlorogenic acid (tR = 18.14 min; peak 2), caffeic acid (tR = 21.09 min; peak 3), unidentified glycoside phenol (tR = 26.91 min; peak 4), rutin (tR = 31.56 min; peak 5), unidentified glycoside flavonoids (tR = 34.26 and 37.07 min; peaks 6 and 7, respectively) and quercetin (tR = 39.85 min; peak 8) (Figure and Table ).
For group 2, the analysis revealed gallic acid (tR = 8.56 min; peak 1), chlorogenic acid (tR = 18.13 min; peak 2), caffeic acid (tR = 21.74 min; peak 3), unidentified glycoside phenol (tR = 27.91 min; peak 4), rutin (tR = 31.68 min; peak 5), unidentified glycoside flavonoids (tR = 34.27 min; peak 6) and quercetin (tR = 39.92 min; peak 8) (Figure and Table ). HPLC analyses determined that flavonoids and phenolic acids are present in the extract of E. grandiflorus and S. montevidensis.
4. Discussion
We found that there was an increase in cell division in cells submitted to extracts of E. grandiflorus 6 g dm−3, which led to an increase in MI. However, at 24 g dm−3, except for the “commercial” extract, when compared to the controls and to the extracts at the lower concentrations inhibited cell division, causing a decrease in MI, conferring antiproliferative potential, when used in high concentrations. Studies undertaken with other species, testing different concentrations with the test-system Allium cepa, reveal that higher concentrations inhibit cell division: Pterocaulum polystachyum D. C. (Knoll et al. Citation2006); Solidago microglossa D. C. (Bagatini et al. Citation2009); Mikania glomerata Spreng. (Dalla Nora et al. Citation2010); Campomanesia xanthocarpa Berg. (Pastori et al. Citation2013); Psychotria brachypoda (Müll. Arg.) Briton (Frescura et al. Citation2013); and Peltodon longipes Kunth ex Benth. (Kuhn et al. Citation2015). It is possible that the high concentration of some compounds have an inhibitory or stimulatory effect on the cell cycle.
Some compounds can be responsible for the inhibition of cell division and for chromosomal aberrations, where E. grandiflorus presents numerous compounds, which are described as having anti-inflammatory and diuretic (Pimenta et al. Citation2006), vasodilator (Tibiriçá et al. Citation2007), antihypertensive (Lessa et al. Citation2008) and antioxidant (Lunardi et al. Citation2014) activities. This can explain the decrease of the values of MI when used in the higher concentration. In our case, the lower concentration stimulated cell division and the higher inhibited. In a study with infusions of Achyrocline satureioides, Fachinetto et al. (Citation2007) found an anti-proliferative effect of infusions on A. cepa cells, attributing this observation to the activity of the different chemical compounds found in the infusion.
Analyzing the commercial extracts from cultivated areas, we found an in increase in MI at both concentrations in relation to the controls and from the extract coming from a naturally occurring area at 24 g dm−3. This increase in MI can be a result of different environmental factors, which can affect the production of plant compounds.
The mitotic indices of S. montevidensis, collected in Silveira Martins, in the two studied concentrations were similar, increasing MI in relation to the negative control. Those collected in Santa Maria had a significant decrease in MI, compared to the lowest concentration (6 g dm−3) and to the negative control. These differences can be related with the location of the populations, one from the rural region (experimental group 1) and the other from the urban and polluted region (group 2). In some cases, the production of chemical compounds (secondary metabolites) by plants is related to the external factors in which they occur. The secondary metabolites represent a chemical interface between the plants and the surrounding environment, which makes their biosynthesis frequently affected by environmental conditions (Kutchan Citation2001).
Mutagenic effects in eukaryotic nuclei can be cytologically verified through the observation of cell inhibitions in growing or dividing cells, interruption of metaphase or induction of chromosomal abnormalities that are numerical or structural (Vieira and Vicentini Citation1997; Knoll et al. Citation2006). Genotoxic agents interact chemically with the genetic material, forming adducts, oxidative alterations or even breaks in the DNA molecule. In most cases, the damage is repaired by the organism itself or the cell is eliminated. In case this lesion is fixed, provoking hereditary changes (mutations), which might perpetuate in the daughter cells during the replication process, the agent is denominated mutagenic (Verschaeve and Van Staden Citation2008).
The extracts of the two species, E. grandiflorus and S. montevidensis, by the number of chromosomal changes, have genotoxic potential on the meristematic cells of A. cepa, suggesting mutagenic action. According to Ribeiro et al. (Citation2003) the mutagenic effect is the consequence of genetic damage caused by physical, chemical and biological agents, inducing cell mutations of an organism. According to Von Borstel (Citation1996), antimutagenicity is a decrease of spontaneous mutated taxa and of the mutation frequencies induced by exogenous agents. Therefore, antimutagens are those agents with the capacity to reduce the occurrence of mutations. Many laboratory studies have identified a large number of antimutagenic and anticancer compounds, most present in plants (Verschaeve and Van Staden Citation2008). The antimutagenic activity of the species was analyzed; however, the extracts did not have antimutagenic activity, because they did not revert the genotoxic effects caused by glyphosate. Moreover, in both species, there was an increase in the number of cells with chromosomal changes, especially E. grandiflorus at 24 g dm−3. Studies undertaken by Frescura et al. (Citation2013), showed that Psychotria brachypoda (Muell. Arg.) Britton and P. birotula Smith & Downs did not have antimutagenic activity. On the other hand, other studied species used in folk medicine presented antimutagenic potential, such as Capparis spinose L. (Sultan and Çelik Citation2009), Justicia adhatoda L., and Carica papaya L. (Rathnasamy et al. Citation2013).
The concentration of active ingredients in the plant depends on the genetic control, climate, edaphic factors, and exposure to microorganisms, insects, herbivores and pollutants. Leite et al. (Citation1998) analyzed the chemical composition of crude aqueous extracts of E. grandiflorus and E. macrophyllus Micheli, through chromatographic studies, and verified the absence of alkaloids, coumarins, flavonoids, and a high concentration of terpenoids. The HPLC analysis revealed that flavonoids and phenolic acids are present in the aqueous extracts of E. grandiflorus and S. montevidensis, of both experimental groups. Flavonoids and phenolic acids are part of the group of phenolic compounds. Studies with phenolic compounds have shown antioxidant activities, as well as a putative effect in preventing cancer and cardiovascular and neurological diseases (Harborne and Williams Citation2000; Sánchez-Moreno Citation2002). Consuming natural antioxidants, such as phenolic compounds, inhibits the formation of free radicals. These are present in most plants and have been associated to decreasing the frequency of diseases related to oxidative stress (Morais et al. Citation2009).
Caffeic acid and glycoside compounds were found in larger quantities in E. grandiflorus, where 8.47% caffeic acids and 12.04% glycoside flavonoids were present, for the extraction of experimental group 1, and 8.01% and 9.38%, respectively, for group 2. Meanwhile the “commercial” extract presented 4.57% of caffeic acids, 8.74% of glycoside flavonoids, and 9.16% phenol glycoside. These differences corroborate the results of Brugiolo (Citation2010), where the concentration of compounds depends on the genetic control and on environmental stimuli. Studies conducted on E. grandiflorus have already isolated phenolic acid, caffeic acid and isoferulic acid (Pimenta et al. Citation2002a, Citation2002b), fatty acids (Tanaka Citation2000), and flavonoids (Pimenta Citation2002), among others from this species.
The chemical compounds of S. montevidensis were not known. In the present study, 14.07% and 9.40% of phenol glycoside were quantified for groups 1 and 2, respectively. Glycoside flavonoid was not found in the aqueous extract of experimental group 1, showing variability in the levels of the compounds. Other species of Sagittaria are known to produce antibacterial compounds, such as diterpenoids (Liu et al. Citation2007). Analyzing leaf samples of Ilex paraguariensis St Hil. from different populations by HPLC and of different individuals in the same population, Athayde et al. (Citation2007) reported a high interpopulational variability in the levels of methylxanthines and also between plants within the same population.
5. Conclusion
Echinodorus grandiflorus has a dose-dependent antiproliferative potential. The different populations tested of Sagittaria montevidensis show distinct genotoxic and antiproliferative effects, which indicate possible genetic variability in the individuals collected and the interaction of external factors interfering with the production of compounds. The extracts of both species are genotoxic as determined by chromosomal changes. Echinodorus grandiflorus and S. montevidensis did not present antimutagenic potential. The compounds that are present in highest quantities in the extracts of E. grandiflorus are caffeic acid and glycoside flavonoid, and phenol glycoside in S. montevidensis. Further studies should be conducted to obtain more data on these species, which would lead to a safer use in inhibiting cell division in eukaryotic cells, which we found in this study.
Disclosure statement
No potential conflict of interest was reported by the authors.
Funding
This study received no specific grant monies from public, commercial, or non-profit organizations.
Acknowledgement
We thank R.M. Fischer for revising an earlier version of this manuscript. In memory of Margareth Linde Athayde.
References
- Alves dos Santos R, Cabral TR, Cabral IR, Antunes LM, Pontes Andrade C, Cerqueira dos Santos Cardoso P, de Oliveira Bahia M, Martins do Nascimento JL, Rodríguez Burbano R, Takahashi CS. 2008. Genotoxic effect of Physalis angulate L. (Solanaceae) extract on human lymphocytes treated in vitro. Biocell. 32:195–200.
- Athayde ML, Coelho GG, Schenkel EP. 2007. Populational diversity on methylxanthines content of maté (Ilex paraguariensis A. St.-Hil., Aquifoliaceae). Lat Am J of Pharm. 26(2): 275-279.
- Ayres M. 2007. Bioestat 50: statistical applications in the areas of biological and medical sciences. : Soc. Civ. Belém/Brasília:Soc. Civ. Mamirauá/CNPq; p. 290. [ In Port.].
- Bagatini MD, Fachinetto JM, Silva ACF, Tedesco SB. 2009. Cytotoxic effects of infusions (tea) of Solidago microglossa DC. (Asteraceae) on the cell cycle of Allium cepa. Rev Bras de Farmacogn. 19:632–636.
- Brugiolo SSS. 2010. Evaluation of the toxicity of the aqueous extract of lyophilized of ‘chapéu-de-couro’(Echinodorus grandiflorus) in pregnant rats. 86f. Phd. [Doutorado em Saúde]. Juiz de Fora, Brazil: Universidade Federal de Juiz de Fora. [ In Port.]
- Camparoto ML, Teixeira RO, Mantovani MS, Vicentini VEP. 2002. Effects of Maytenus ilicifolia Mart, and Bauhinia candicans Benth infusions on onion root tip and rat warrow cell. Gen Mol Biol. 25:85–89.10.1590/S1415-47572002000100016
- Chauhan LKS, Gupta SK. 2005. Combined cytogenetic and ultrastructural effects of substituted urea herbicides and synthetic pyretroid insecticide on the root meristem cell of Allium cepa. Pest Biochem Physiol. 82:27–35.10.1016/j.pestbp.2004.11.007
- Ciğerci IH, Cenkci S, Kargюğlu M, Konuk M. 2016. Genotoxicity of Thermopsis túrcica on Allium cepa L. roots revealed by alcaline comet and ramdom amplified polymorphic DNA assays. Cytotechnology. 68:829–838. doi: 10.1007/s10616-014-9835-8
- Dalla Nora G, Pastori T, Laughinhouse HD IV, Canto-Dorow TS, Tedesco SB. 2010. Antiproliferative and genotoxic effects of Mikania glomerata (Asteraceae). Biocell. 34:85–101.
- Fachinetto JM, Bagatini MD, Durigon J, Silva ACF, Tedesco SB. 2007. Anti-proliferative effect of infusions of Achyrocline satureioides DC (Asteraceae) on the cell cycle of Allium cepa. Rev Bras Farmaco. 17:49–54. [In Port.]
- Frescura VD, Kuhn AW, Laughinhouse HD IV, Paranhos J, Tedesco SB. 2013. Post-treatment whit plant extracts used in Brazilian folk medicine cause a partial reversal of the antiproliferative effects of glyphosate in the Allium cepa test. Biocel. 37(2):23–28.
- Guerra M, Souza MJ. 2002. How to observe chromosomes - A guide cytogenetic techniques in plant, animal and human. Ribeirão Preto: FUNPEC; p. 131.
- Harborne JB, Williams CA. 2000. Advances in flavonoid research since 1992. Phytoche. 52(6): 481- 504.
- Knoll MF, Silva ACF, Canto-Dorow TS, Tedesco SB. 2006. Effects of Pterocaulon polystachyum DC. (Asteraceae) on onion (Allium cepa) root-tip cells. Genet Molec Biol. 29:539–542.10.1590/S1415-47572006000300024
- Kuhn AW, Tedesco M, Boligon AA, Frescura VD, Athayde ML, Tedesco SB. 2015. Genotoxic and chromatographic analyses of aqueous extracts of Peltodon longipes Kunth ex Benth. (hortelã do campo). Braz J Pharm Sci. 51(3):533–540. doi:10.1590/s1984-82502015000300005
- Kutchan TM. 2001. Herbal mixtures in the traditional medicine of Eastern Cuba. Plant Physiol. 125:58–60.10.1104/pp.125.1.58
- Leite SN, Floriani AE, Biavatti MW, Cechined FV. 1998. Parameters phytochemicals, physio-chemical and anatomical for quality control of chapéu de couro (Egrandiflorus x macrophyllus, Alismatacea) Resumo do X Simpósio Brasileiro de Plantas Medicinais do Brasil, Águas de Lindóia, SP-Brazil. [ In Port.]
- Lessa MA, Araújo CV, Kaplan MA, Pimenta D, Figueiredo MR, Tibiriçá E. 2008. Antihypertensive effects of crude extracts from leaves of Echinodorus grandiflorus. Fund Clin Pharmacol. 22:161–168. doi:10.1111/j.1472-8206.2008.00565.x
- Liu XT, Shi Y, Yu B, Williams ID, Sung HHY, Zhang Q, Liang JY, Ip NY, Min ZD. 2007. Antibacterial diterpenoids from Sagittaria pygmaea. Planta Med. 73:84–90.10.1055/s-2006-951773
- Lunardi RF, Wohlenber M, Medeiros N, Agostini F, Funchal C, Dani C. 2014. In vitro antioxidant capacity of tea of Echinodorus grandiflorus, “leather hat”, in wistar ra liver. An Acad Bras Cienc. 86(3):1451–1462. doi:10.1590/0001-37652014201330507
- Mauro MO, Pesarini JR, Marin-Morales MA, Monreal MTFD, Monreal ACD, Mantovani MS, Oliveira RJ. 2014. Evaluation of the antimutagenic activity and mode of action of the fructooligosaccharide inulin in the meristematic cells of Allium cepa culture. Genet Mol Res. 13:4808–4819.10.4238/2014.February.14.14
- Morais SM, Cavalcanti ESB, Costa SMO, Aguiar IA. 2009. Antioxidant action of tea and condiments widely consumed in Brazil. Rev Bras Farmacog. 19(1b):315–320 [In Port.].10.1590/S0102-695X2009000200023
- Mori AS, Silva LA, Lisboa G, Coradin L. 1989. Manual handling of herbal phanerogam. Ilhéus: CEPLAC; p. 104. [ In Port.]
- Pastori T, Flores FC, Boligon AA, Athayde ML, Silva CB, Canto-Dorow TS, Tedesco SB. 2013. Genotoxic effects of Campomanesia xanthocarpa extracts on Allium cepa vegetal system. Pharm Biol. Early online. 1–7: doi:10.3109/18880209.2013.786097
- Pimenta DS, Figueiredo MR, Kaplan MAC. 2006. Essential oil from two populations of Echinodorus grandiflorus (Cham & Schltdl.) Micheli (Chapéu de couro). An Acad Bras Cienc. 78:623–628.10.1590/S0001-37652006000400002
- Pimenta DS. 2002. Contribution to farming, ecology and validate the use of Echinodorus grandiflorus (Chamisso & Schlechtendal) Micheli (chapéu de couro). 179f [PhD. Instituto Oswaldo Cruz]. Rio de Janeiro, Brazil. [ In Port.]
- Pimenta DS, Amaral ACF, Figueiredo MR, Kaplan MAC. 2002a. Standardization of Echinodorus grandiflorus (Cham & Schltdl.) Micheli. I-Interface chromatographic profiles obtained by GC-MS and HPLC-UV nonpolar and polar extracts of leaves. Resumo do XVII Simpósio de Plantas Medicinais do Brasil. Cuiabá, MT,Brazil. [ In Port.]
- Pimenta DS, Amaral ACF, Figueiredo MR, Kaplan MAC. 2002b. Standardization of Echinodorus grandiflorus (Cham. & Schltdl.) (Micheli). II-Analysis by HPLC-UV water and ethanol extracts of leaves collected seasonally. Resumo do XVII Simpósio de Plantas Medicinais do Brasil. Cuiabá, MT, Brazil. [ In Port.]
- Rathnasamy S, Mohamed KB, Sulaiman SF, Akinboro A. 2013. Evaluation cytotoxic mutagenic and antimutagenic potential of leaf extracts of three medicinal plants using Allium cepa chromosome assay. Int Curr Pharm J. 2(8):131–140.
- Ribeiro LR, Salvadori DMF, Marques EK. 2003. Environmental mutagenesis. Brazil: Canoas-RS, ULBRA. p 356. [In Port.]
- Roberto MM, Jamal CM, Malaspina O, Marin-Morales MA. 2016. Antigenotoxicity and antimutagenicity of ethanolic extracts of Brazilian green propolis and its main botanical source determined by the Allium cepa system. Gen Mol Biol, 39(2): 257-269. Doi: 101590/1678-4685-GMB-2015-0130
- Sabir SM, Ahmad SD, Hamid A, Khan MQ, Athayde ML, Santos DB, Boligon AA, Rocha JBT. 2012. Antioxidant and hepatoprotective activity of ethanolic extract of leaves of Solidago microglossa containing polyphenolic compounds. Food Chem. 741–747.10.1016/j.foodchem.2011.09.026
- Sánchez-Moreno C. 2002. Methods used to evaluate the free radical scavenging activity in foods and biological systems. Food Sci Tech Inter. 8(3):121–137.10.1177/1082013202008003770
- Silva J, Erdtmann B, Henriques JAP. 2003. Genética toxicológica. Porto Alegre, Brazil: Alcance; p. 422.
- Souza LF, Laughinghouse HD IV, Pastori T, Tedesco M, Kuhn AW, Canto-Dorow TS, Tedesco SB. 2010. Genotoxic potential of aqueous extracts of Artemisia verlotorum on the cell cycle of Allium cepa. Int J Environ Studies. 67:871–877. doi:10.1080/00207233.2010.520457
- Sultan AO, Çelik A. 2009. Genotoxic and antimutagenic effects of Capparis spinose L. on the Allium cepa L. root tip meristel cell. Caryologia. 62(2):114–123.10.1080/00087114.2004.10589676
- Tanaka CMA. 2000. Chemical Constituents of Five Species of Echinodorus and Evaluation of Beta Pinene as Substrate for Obtaining Quirons Elaborated more [ Phd diss]. Universidade Estadual de Campinas,Instituto de Química. Brazil, p. 298. [ In Port.]
- Tedesco SB and Launghinghouse IV HD. 2012. Bioindicator of genotoxicity: The Allium cepa test. In Tedesco SB, Languinghouse IV HD, editors. Org Environmental Contamination. Rijeka: Intech; p. 137–156.
- Tibiriçá E, Almeida A, Cailleaux S, Pimenta D, Kaplan MA, Lessa MA, Figueiredo MR. 2007. Pharmacological mechanism involved in the vasodilator effects of extracts from Echinodorus grandiflorus. J Ethnopharmacol. 111:50–55.10.1016/j.jep.2006.10.030
- Verschaeve L, Van Staden J. 2008. Mutagenic and antimutagenic properties of extracts from South African traditional medicinal plants. J Ethnopharmacol. 119:575–587. doi:10.116/j.jep.2008.06.007
- Vieira D, Vicentini VEP. 1997. Study of the mutagenic effect of floxacin in Allium cepa. Genet Mol Biol Supplement.42° Congresso Nacional de Genética, Goiânia, Brazil. [ In Port.]
- Von Borstel RC. 1996. The relation of activation and inativation to antimutagenic process. In: Shankel DM, Hatman PE, Kada T, Hollaender A, editors. Antimutagenis and anticarcinogenesis mechanisms. New York (NY): Plenum Press; p. 39–45.
- Zafred RRT, Spano MA, Martins GR, Figueiredo CCM, Ferreira PC, Silva LP, Silva RMG. 2016. Pro-oxidant activity and genotoxicity of the Astronium fraxinifolium using wing SMART and Allium cepa test. Res J Med Plants. 10(4):276–285. doi:10.3923/rjmp.2016.276.285