
 ?Mathematical formulae have been encoded as MathML and are displayed in this HTML version using MathJax in order to improve their display. Uncheck the box to turn MathJax off. This feature requires Javascript. Click on a formula to zoom.
ABSTRACT
This paper reports on CFD simulations of in-cylinder flow and combustion in an open-bowl heavy duty diesel engine at high load. The focus of the study is to unravel the effect of swirl motion on the soot formation and on the late cycle soot oxidation. To incorporate detailed kinetic mechanism while maintaining a manageable computational time, Representative Interactive Flamelets (RIF) method is employed to describe the chemical reactions, ignition, flame propagation, and emissions in the engine. In modeling the soot, a phenomenological model is employed where soot formation, nucleation, coagulation, and oxidation with O2 and OH are considered. Four values for swirl numbers, SN = 0, 0.5, 1.7, and 3.4, at three injection pressures and three injection timings are considered. It is shown that increasing the swirl number leads to an increase in both the amount of soot in the exhaust gas and the peak value of soot in the engine cylinder. The mechanisms of soot formation and oxidation and swirl/in-cylinder flow interaction in the given engine configuration are investigated based on the numerical results. It is shown that in-cylinder turbulence is the key parameter affecting the formation and oxidation of soot. Despite the higher mean flow kinetic energy in the high swirl cases than in the no-swirl case, the no-swirl case has a higher turbulent kinetic energy at late cycle. This is due to the presence of coherent structures created from the spray-wall interaction, which can survive longer time after the end of injection (EOI).
Introduction
Engine efficiency and emissions in the exhaust of an engine are directly linked to the flow structures in the engine. Large-scale flow motions are the main drive of bulk mixing inside the cylinder. Moreover, the generation of turbulence due to piston movement and spray can create local mixing, which can affect turbulent mixing between oxygen and unburned fuel and the rate of oxidation of soot and particulate matters. Understanding the fundamental interactions between different flow motions, squish, swirl and tumble motions, and fuel injection is very important in designing optimal and clean engine geometries.
Heavy-duty engines, depending on the level of swirl motion employed, can be classified into quiescent and swirl-supported configurations. Quiescent combustion systems mainly rely on the high injection pressure to achieve high level of mixing. Previous studies on the interaction of flow and spray and their effect on soot oxidation, however, mainly focus on reentrant or swirl-supported combustion systems. Arcoumanis, Bicen, and Whitelaw (Citation1983) studied the interaction between squish flow and swirl motion inside an engine at near TDC (top dead center) using LDA (laser Doppler anemometry). It was shown that the interaction of the squish flow with the swirl motion profoundly altered the axial flow structure in the cylinder. The swirl generated by squish flow is reversed in the presence of swirl in the cylindrical bowl and an additional vortex is generated in a reentrant bowl (Arcoumanis, Bicen, Whitelaw Citation1983). in a series of publications, Miles et al. (Bergin et al. Citation2007; Miles et al. Citation2004, Citation2002, Citation2001) discussed the interaction between in-cylinder swirl motion and injected fuel. It was shown that a double vortex is created by the interaction between the squish flow and the swirl motion and both the size and the relative strength of these two vortices are affected by the injection pressure.
For quiescent combustion systems (QCS), relatively less work has been done on the interaction between the spray and the bulk flow motion. Since the quiescent combustion systems have the potential of lower emission level and better fuel consumption compared with the swirl supported combustion systems (Mori et al. Citation2000), the focus of this paper is to unravel the fundamental interaction between the spray and the bulk flow motion in QCS and the effect of this interaction on the late cycle soot oxidation. To this end, multidimensional CFD simulations were performed on an open-bowl, heavy duty direct ignition engine. Different swirl ratio were tested and the level of soot as well as the soot formation and oxidation at various stages of the combustion were compared between different cases with different swirl numbers.
Numerical model
In this paper, the Representative Interactive Flamelet (RIF) approach is employed to include detailed kinetic mechanism while maintaining affordable computational time. The model is based on the well-known flamelet approach proposed by Peters (Citation1983, Citation1984)) and extended by many others, e.g. (Barths et al., Citation2000; Pitsch, Barths, Peters Citation1996). Based on the flamelet approach, the high dimensional thermodynamics state is reduced by a coordinate transformation to flamelet space where all the reacting scalars can be represented by mixture fraction, . By assuming that the sub-grid distribution of the
is represented by a
-PDF, the local composition of chemical species can be calculated in the CFD domain. The conservation equations for species and temperature, or enthalpy, are then solved in the one-dimensional flamelet space. The effect of mixing and coupling between the flow field and chemistry is incorporated in the average of local values of scalar dissipation rate as a measure of turbulence intensity. The Lib-ICE code, a set of libraries and solvers for simulation of IC engines based on OpenFOAM software (D’Errico et al. Citation2012; Lucchini et al. Citation2012, Citation2014), is employed in this study. The spray model is based on the well established Lagrangian–Eulerian approach where the continuum phase, gas, is treated by Eulerian system of equations and the discrete phase, liquid, is treated in the Lagrangian framework. Primary breakup of the spray is considered as a result of the instabilities of the liquid jet. Both Kelvin-Helmholtz (KH) and Rayleigh-Taylor (RT) instabilities are taken into account (KHRT model) for the breakup (REITZ Citation1987). Sub-models for estimating the main pollutant emissions, namely CO, NO
and soot, are included in the model. The main features of the soot model in this work are taken from (Leung, Lindstedt, Jones Citation1991). In this model, a phenomenological approach is developed to account for nucleation, surface growth, coagulation, and oxidation of soot particles. The model is previously validated at different conditions, e.g. (D’Errico et al. Citation2012; Lucchini et al. Citation2012, Citation2014), and more recently is validated with regards to the same experimental cases used in this study and presented in Fatehi et al. (Citation2018) where more details of the model can be found.
Experimental conditions and numerical cases
The experimental cases are from an open-bowl, heavy duty direct ignition engine. Pressure traces along with the soot and NO in the exhaust gas were measured for four different conditions. The main engine parameters and details of the operating conditions are presented in . The experiments were performed in high load, 100% load, and low load, 25% load. At each load, different amount of fuel and different level of EGR was used resulting in different air to fuel ratio in the engine and hence different amount of soot at the exhaust.
Table 1. Details of the operating conditions and geometric parameters for the simulated cases; SOI: Start of injection, EOI, End of injection, : In cylinder air to fuel ratio, CO
ratio: ratio between in cylinder CO
and stoichiometric CO
A 60 sector of the engine is considered in the simulations. The numerical simulations were started at 235 CAD aTDC, at IVC, with initial pressure and temperature from the experimental measurements. The initial gas composition in the engine was estimated from the reported EGR in the experiments. N-dodecane, with the liquid properties of a blended fuel, 30% alpha-methyl-naphthalene with 70% n-decane, was used in the reaction mechanism as the fuel (Yao et al. Citation2017).
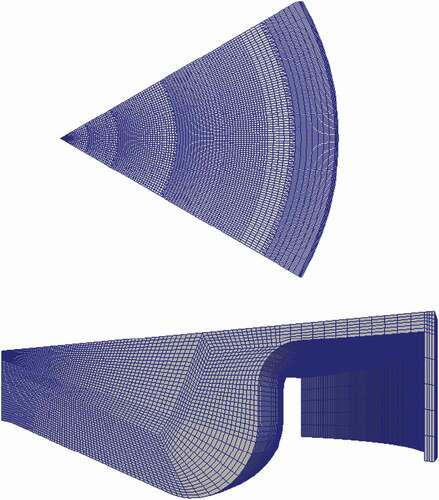
The mesh, with spray alignment and four layers of refinements in the radial direction, was generated using the automatic mesh generation utility provided as a pre-processing tool to Lib-ICE solver (Lucchini et al. Citation2014). The movement of the mesh was performed using the dynamic mesh layering technique (Lucchini et al. Citation2007), keeping the cells in the spray region fixed and moving the ones in the piston bowl. shows the details of the computational domain and the mesh in this study.
Figure 1. Geometry of the engine and the mesh used in the study.
A sweep over swirl number, injection pressure, and start of injection is performed to study their effect on the soot formation and oxidation in the engine. shows the values of swirl number, injection pressure, and start of injection for different cases. Since the effect of changing the swirl ratio shows a lot of similarities between the four operating conditions, only the high load cases with higher soot emission, as marked in , are analyzed and discussed in this paper.
Table 2. Description of different numerical cases. HL: High Load, LL: Low Load, S: Swirl Number, SOI: start of injection, : injection pressure. The ones marked with EXP are the points where the experimental data are available
Results and discussion
General trends
Effect of changing swirl number and injection pressure on the pressure traces of the high load cases are presented in . shows the effect of swirl ratio on the in-cylinder pressure for the high load cases at operating condition HL1, according to . Some differences in the pressure curves due to changing of the swirl number can be seen at the peak pressure and expansion phase. These differences are results of the changes in the heat transfer and mixing behavior, which lead to different combustion phasing and ignition delay times. These differences are discussed in details in Section 4.4.
Figure 2. Pressure trace for different cases at high load.
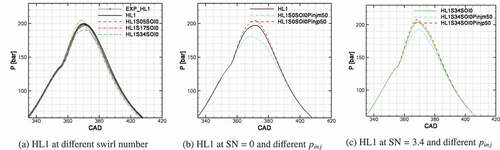
) show the in-cylinder pressure at 50% lower and 50% higher injection pressures for swirl numbers 0 and 3.4, respectively. Reducing the injection pressure leads to slower combustion and hence slower pressure rise. The effect is more prominent for the no-swirl case, ), compared with the high swirl case, ).
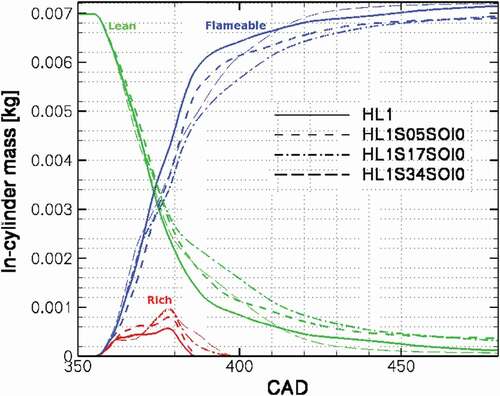
Effect of swirl ratio on the in-cylinder mass of soot for different high load cases is presented in . Increasing the swirl number increases the amount of in-cylinder soot. This phenomenon can be explained by the peculiar effect of swirl motion on the air-fuel mixing in this engine configuration. shows the mass distribution of mixture in three equivalence ratio ranges: mixture with equivalence ratio below 0.5 or lean mixture, mixture with equivalence ratio between 0.5 and 2 or flammable mixture and mixture with equivalence ratio greater than 2 or rich mixture. By increasing the swirl number, the in-cylinder mass of air-fuel mixture moves into the lean and rich mixture and the amount of flammable mixture, mixture with equivalence ration between 0.5 and 2, is decreased. Higher rich mixture in the cylinder leads to higher amount of soot. By increasing the swirl ratio, the amount of rich mixture is increased, and more importantly, the rich mixture is extended until later crank angels compare to the no swirl case.
Figure 3. In-cylinder soot mass for different cases at high load.
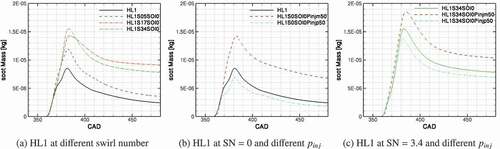
Figure 4. Variation of lean, flammable, and rich mixture inside the cylinder.
The effect of changing the injection pressure on the soot emission from the engine, as presented in , is as expected; by increasing the injection pressure soot emission at the exhaust is decreased and vice-versa. Changing the SOI has a much smaller effect on the soot compared with the effect of swirl ratio and the injection pressure.
Analysis of heat release rate history
To study the effect of swirl ratio, the high load case with higher soot at the exhaust will be discussed here. Four different swirl ratios are considered; 0, 0.5, 1.7 and 3.4. shows the rate of heat release for the swirl ratio 0, the baseline case. Different stages of combustion can be identified by examining the heat release rate history of the engine.
Figure 5. Apparent rate of heat release and injection profile for the high load case 1.
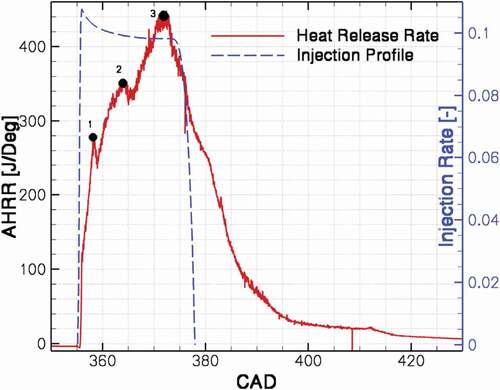
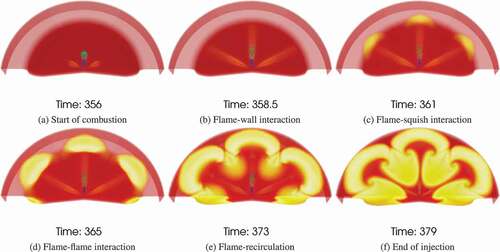
At CAD 358.5 aTDC, the flame hits the wall. This is where the first local maximum can be identified in the heat release rate curve. The flame–wall interaction reduces the RoHR (rate of heat release) by limiting the contact between the fuel and air. After the flame hits the wall, vortexes are formed in different directions as a result of flame-wall interaction. These vortexes, by increasing the mixing rate between the fuel and air, increase the RoHR again, until the two adjacent flames interact with each other. The flame-flame interaction can be identified in at CAD 365 aTDC where the second local maximum appears in the curve. The decrease in the RoHR is the result of formation of fuel rich pockets due to this interaction. Afterward, when the two opposing vortexes interact while still having high velocity, they push the flame toward the center of the piston, where fresh air will oxidize the fuel and RoHR increase. The peak of RoHR occurs right before the end of injection at around CAD 373 aTDC where the vortexes that were formed due to the flame-wall interaction enter into the spray axes. shows the temperature field at the times of different events as discussed above.
Figure 6. In-cylinder temperature field at different combustion events.
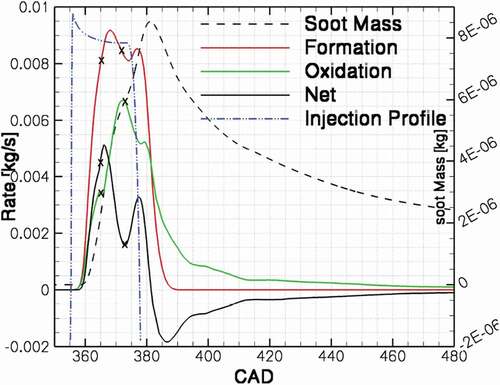
Different events, as explained above, can greatly affect the formation of soot and NO in cylinder. shows the rate of formation, oxidation, and net rate of soot in the engine. Different marks on the figure at CAD 365 and 373 are to emphasis the behavior of soot formation/oxidation rate at the time of flame-flame interaction and flame-recirculation events. At the event of flame-wall interaction, a local minimum is observed at the soot oxidation rate. The soot oxidation rate continues to increase until when the vortexes formed at the wall are folded back into the spray axis. This will lead to an increase in the rate of soot formation as shown in . Shortly after the end of injection, the soot formation rate drops to zero and soot oxidation is the process that determines the final soot at the engine exhaust.
Figure 7. Formation, oxidation and net rate of soot for the HL1 case. The injection profile and total in-cylinder soot mass are presented for comparison.
Combustion phasing
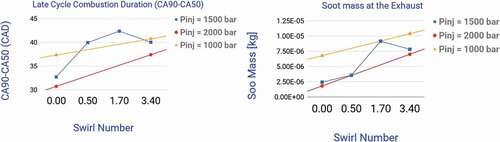
A summary of the combustion phasing for different swirl ratios, injection pressures, and SOIs are presented in . CA10, CA50, and CA90 represent crank angles where 10, 50, and 90% of cumulative heat is released, respectively. CA10 is almost unaffected by the changes in the flow parameters. The influence of the changing the swirl ratio and injection pressure is most noticeable after CA50. One observation from this figure is that when the CA90 is increased, the amount of soot is also increase. shows the difference between CA90 and CA50, representing the late cycle combustion duration, and the amount of soot at the end of combustion for different cases. By comparing the two figures presented in , similar trend can be identified between the late cycle combustion duration and final soot mass.
Figure 8. Left: Combustion duration for different swirl ratio and injection pressure, right: Soot mass at the end of combustion for different swirl ratio and injection pressure.
Differences in the combustion phasing due to changes in the swirl ratio can be discussed by examining the RoHR curves for different cases. The RoHR for the four swirl ratio studied in this paper is presented in .
Figure 9. Rate of heat release for different swirl ratios.
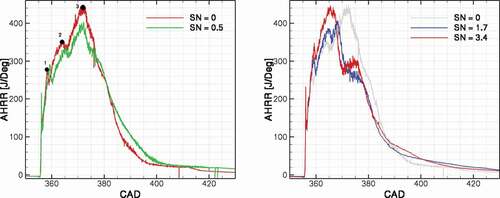
The first difference between the cases is the timing of the flame-wall interaction event. By increasing the swirl ratio, the flame–wall interaction occurs at a later crank angle, from CAD 358.5 for swirl ratio 0 to around 359.4 for swirl ratio 3.4. Similarly, the second event, as previously discussed in , representing the flame-flame interaction is postponed by around 2 CAD. However, the main difference between the low swirl ratio cases, SN = 0 and 0.5, and the high swirl ratio cases, SN = 1.7 and 3.4, lies in the events after the flame-flame interaction. In the low swirl cases, the high momentum of the jet after hitting the wall and the symmetry between the two vortexes that are created from this event push the flame toward the center of the cylinder and the heat release rate continue to increase until the vortexes collide with the spray axis. In the high swirl cases, on the other hand, the rate of heat release show a sudden drop after the flame-flame interaction. This drop in the heat release rate results in the formation of fuel rich pockets which is in favor of soot formation. The reason behind this slow-down of heat release is discussed in Section 4.4.
In a sequence presented in in a cut plane in the middle of the bowl with normal in Z direction, some of the important parameters, heat release rate, vorticity in the Z direction, formation rate of soot volume fraction and production term of turbulent kinetic energy, are presented at the time of different combustion events for the no swirl case and the high swirl case, SN = 3.4. For the no-swirl case, everything is symmetric with respect to the spray axis. Soot is formed at the tip of the spray and transported by clockwise and counter-clockwise vortexes at both sides of the spray toward the mid-spray planes and center of the cylinder. The production term of the turbulent kinetic energy, an indication of small scale mixing, is located at the edge of the clockwise and counter-clockwise vortexes. The locations where the turbulence is produced play an important role in oxidation of soot and will be discussed later.
Figure 10. From left, 2D contour of heat release rate with line contour of mixture fraction (Z), vorticity in the Z direction, formation rate of soot volume fraction and production term of turbulent kinetic energy for the no swirl case. Moving Plane A is used.
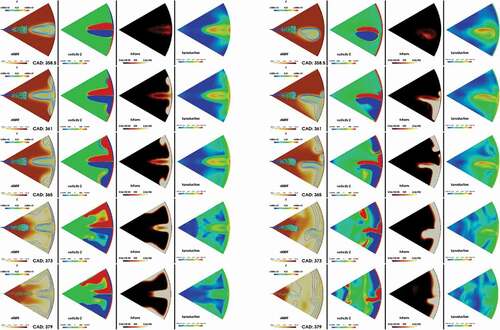
For the high swirl case, the effect of swirl motion can be identified through this sequence. The two vortexes, clockwise or negative with blue color and counter-clockwise or positive with the red color in , are no longer symmetric and the clockwise vortex has a larger size compare with the counter-clockwise one. An important observation is that soot is formed inside the clockwise vortex. Consequently, high concentration of soot will move in the same direction as the swirl. Due to the positive combination of the swirl motion and clockwise motion of the vortex, the soot cloud formed inside the clockwise vortex moves faster than counter-clockwise vortex and it joins the soot cloud from the adjacent spray in a short time. This behavior observed in this engine, is opposite to the swirl-supported engines where soot is initiated and formed inside the counter-clockwise or positive vortex (Bergin et al. Citation2007). When soot is formed in the counter-clockwise vortex, the movement of the vortex motion and bulk swirl motion results in a slower movement of soot cloud and delaying the interaction of the soot clouds from adjacent sprays, resulting in a better soot oxidation and slower soot formation. When the movement of the soot cloud is in opposite direction compared with the bulk swirl motion, a better transport of oxygen into the soot cloud is achieved. While in the case of quiescent engine, this study, the swirl motion and the soot cloud has the same direction, resulting in inefficient mixing between oxygen and soot.
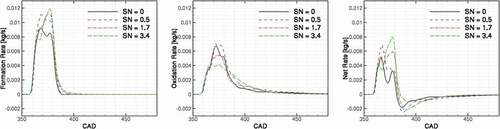
A break-down of soot formation and oxidation rates for the four swirl ratio cases is presented in . The formation rate peak value is increased by increasing the swirl ratio and specifically, considerably higher formation rate can be seen between CAD 365 until the end of injection. There is a slow down in the formation rate at CAD 367, at the event of flame-flame interaction. Between CAD 365 until the end of injection, where an increase in the formation rate is observed, the oxidation rate is also considerably lowered compared with the base-line case. This results in a much higher net rate of soot formation at this stage. Despite the fact the oxidation rate of soot at late cycle is increased by increasing the swirl ratio, the net of soot mass at the end of the cycle is increased. Another difference between the cases is the tail of the soot formation curve. By increasing the swirl ratio in the cylinder, the soot formation shows a longer tail after the end of injection. This is attributed to the longer combustion duration at these cases.
Figure 11. Formation, oxidation and net rate of soot at different swirl ratios.
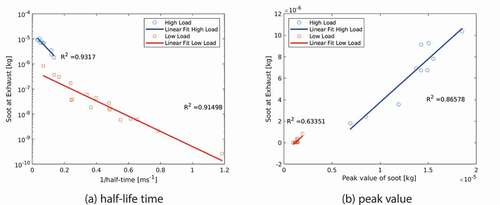
Since both formation and oxidation rate of soot are affected by swirl ratio, a metric is required to identify the controlling mechanism. Hale-life time and peak value of soot are used for this reason. The half-life time of soot shows the affect of oxidation on the final soot emission while the peak value of soot represents the importance of formation of soot. To calculate the half-life time, an exponential function is fitted to the tail of the soot mass curve and half-life time of the exponential function is calculated. Longer half-life time represent slower oxidation rate and vice versa. Since the half-life time value is independent of the amount of soot in the cylinder, it provides a better comparison between different cases. To identify the controlling mechanism of soot emission, scatter plots of soot at the exhaust versus the inverse of half-life time of soot and scatter plots of soot at the exhaust versus the peak value of soot are presented in , respectively. Good correlation between soot emission with the half-life time of soot means that the final soot from the cylinder is directly affected by the soot oxidation, hence, the oxidation is the controlling mechanism. Good correlation between the peak value and the soot emission means that higher soot formation results in higher soot emissions and therefore the formation of soot is the controlling mechanism. The results presented in show that both phenomena, oxidation and formation, play role in the final soot emission from this engine. This is in contrast with the results from swirl supported engines (Fatehi et al. Citation2019) where only the soot oxidation was found as the controlling mechanism. The results of that study for swirl supported engines suggested that the soot emission is only contorted by the oxidation of soot and is less sensitive to the amount of soot that are formed during the process. In this engine, however, soot emission is affected by the amount of soot that is formed during the cycle as well as the amount of soot that is oxidized by the late cycle oxidation.
Figure 12. a) Scatter plot of soot emissions and half-life time of soot as a representative of soot oxidation process and b) scatter plot of peak value of soot and soot emission as a representative of soot formation process.
Flow structures
The changes in the rate of heat release curves as a result of changing the swirl ratio can be studied further by examining the structure of the flow field. The flow field in the engine is affected by the piston shape, spray properties, swirl ratio, timing of the injection and combustion characteristics. To study the flow structures, the velocity vectors are presented in two planes in the middle of the spray, with normal vectors orthogonal to the spray axis. shows the planes where the numerical data are extracted.
Figure 13. Planes where the numerical data are extracted. from left, first, plane I in the middle of the spray axis parallel with the cylinder fire deck. Second, plane II, in the middle of the spray with the angel of 30 degree with the cylinder head. Third, Moving Plane A in the middle of the bowl with the normal in the Z direction, and fourth, Moving Plane B right above the piston bowl with the normal in the Z direction.

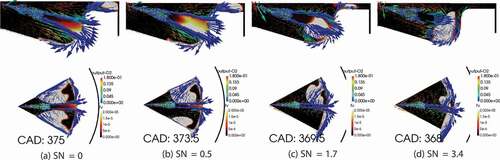
At CAD 361 for the no-swirl case, when the flame hits the wall, formation of two identical vortexes at both side of the spray axis can be observed on plane II. By increasing the swirl ratio from 0 to 3.4, the vortex at the leeward of the spray becomes “larger” as the velocity from the swirl motion is in the same direction as this vortex. On the other hand, by increasing the swirl ratio the vortex on windward of the spray become smaller. Soot is already formed at the tip of the spray for all the cases. The distribution of soot on both side of the spray axis is identical for no-swirl case. As the swirl ratio increases, the soot cloud on the lee-ward side of the spray becomes larger. The larger soot cloud on the lee-ward side is accompanied by a larger tangential velocity due to the stronger swirl motion combined with the clockwise motion of the vortex. At CAD 365, the soot cloud formed at the tip of the spray is transported by the vortexes to the middle plane of two adjacent sprays (flame-flame interaction event). For the no-swirl case, there is a strong radial velocity toward the cylinder center where the two vortexes meet at the mid-plane between the sprays. By increasing the swirl number to 0.5, the radial component of the velocity becomes smaller and by further increasing the swirl number, the swirl motion becomes dominant and there is no radial component to the velocity where the two vortexes collide.
The first peak in the soot formation curves of low swirl cases occurs at CAD 367, c.f. . The soot cloud is now transported toward the center of the cylinder in the no-swirl case while for the higher swirl cases, the soot cloud is transported both radially and tangentially. This is clear by comparing the location of the soot cloud tip on the plane I between the different cases. The stronger the swirl, the closer the soot cloud is to the spray axis.
The most important difference between the cases in terms of the effect on the soot formation arises at the time that the soot cloud interacts with the spray. The cloud of soot that is transported by the vortexes at both sides of the spray, eventually collides with the main spray axis. This collision happens at different crank angels for different cases. shows the time when the soot cloud collides with the main spray axis. This time is at CAD 375 for no-swirl case while it happens at CAD 368 for swirl ratio 3.4, 7 CAD earlier. When the two clouds at different sides of the spray axis reach each other, a larger cloud is formed which limits the soot oxidation due to the smaller surface area. The slow down in soot oxidation due to smaller surface area happens at an earlier time and with a greater extend for the higher swirl ratio cases. Furthermore, earlier merge of the soot clouds happens at the higher momentum of the spray jet where the soot cloud is pushed toward the perimeter of the cylinder and down into the bowl. Moreover, by increasing the swirl ratio, the velocity of the soot cloud is tangentially dominant while in the no-swirl case, the negative radial velocity is the dominant component. In the low swirl cases where the soot cloud has a larger negative radial velocity, the collision of the soot cloud and the spray jet creates a small recirculation zone inside the soot cloud, as it can be identified by appearing of a “hole” in the soot cloud in plane II as marked in .
Figure 14. Structure of the flow inside the cylinder at planes I and II for the four swirl numbers, SN = 0, 0.5, 1.7 and 3.4. Velocity vectors are colored with O mass fraction and the 2D contours represent the soot volume fraction.
Soot oxidation
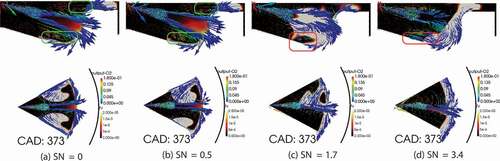
As shown in , the overall soot oxidation rate behaves differently for different cases. Shortly after the start of combustion, soot oxidation start to increase with a slower slope compared with the soot formation. At around CAD 365 when the flame hits the wall, all the four cases show a slow down in the soot oxidation rate due to the flame-wall interaction. From this point, different cases show considerably different behavior in soot oxidation rate. After the flame hits the wall, the soot oxidation starts to increase to its maximum in the low-swirl cases. While in the cases with high swirl ratio, 1.7 and 3.4, soot oxidation reaches to a plateau between this point and the end of injection. shows the velocity vectors and soot cloud position at CAD 373, corresponding to the peak of soot oxidation for the low-swirl cases. There are regions marked in this figure to emphasis the direction of the velocity vectors carrying oxygen and the position of soot cloud. As shown in plane I for SN = 0 case, top left of , the oxygen is transported toward the soot cloud on both top and bottom regions of spray axis. Moreover, by comparing the plane II between the four cases, the soot cloud has the highest external area for SN = 0 case compared with other cases. Still for SN = 0.5, the direction of the oxygen is toward the soot cloud, with relatively smaller velocity. By increasing the swirl number, SN = 1.7, the velocity vectors are much smaller on the edge of the soot cloud, showing smaller transportation of oxygen toward the soot. For the SN = 3.4, the situation is reversed and oxygen is moving away from the soot cloud. That can explain the much lower soot oxidation rate for this case compared with the other cases. Moreover, due to the placement of the soot cloud close to the perimeter of the cylinder, the contact area between the soot cloud and fresh air is reduced in the high swirl case. Furthermore, the direction of the soot cloud on plane II for different cases shows that in the low swirl cases, soot is transported toward the oxygen rich region, in the center of the cylinder, while in the high swirl cases a big portion of the soot cloud is transported toward different portion of the cloud.
Figure 15. Structure of the flow inside the cylinder at planes I and II for the four swirl numbers, SN = 0, 0.5, 1.7 and 3.4. Velocity vectors are colored with O mass fraction and the 2D contours represent the soot volume fraction.
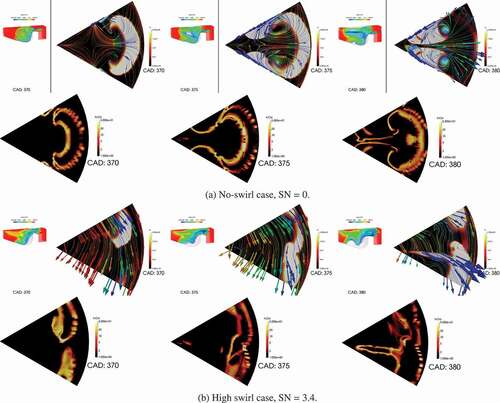
The effect of presence of the coherent structure on the oxidizing of soot in the squish region and the difference between the no-swirl and the high swirl cases is presented in for CAD 370 to 380 corresponding to the region of peak soot oxidation of the no-swirl case. Streamlines of the flow colored with oxygen mass fraction and 2D contours of soot volume fraction are presented in a plane right above the piston bowl and into the squish region, Moving Plane B, in ). Soot oxidation rate contours are also presented at different times in the same figure. For the no-swirl case, the vortex structure at both sides of the injection axis, still gaining energy from the spray, is transporting oxygen into the soot cloud. In the mid-spray axis the positive radial velocity induced by the spray transporting oxygen into the squish soot and by CAD 380, the squish soot is almost completely oxidized. For the high swirl case, on the other hand, the flow streamlines that carry oxygen are parallel to the soot cloud, resulting in a low level of mixing between the fresh air and soot. The soot cloud appearing in this plane at CAD 370 is transported toward the squish region and then at CAD 380. This cloud is joined by the soot formed from the adjacent spray. It is worth noting that the soot oxidation rate covers a larger area in the no-swirl case due to its symmetric structure, especially at CAD 375 and 380.
Figure 16. Flow streamlines and soot volume fraction and soot oxidation contours at Moving Plane B at CAD 370 to 380.
Late cycle soot oxidation
For both no-swirl and high swirl cases, soot reaches to its peak mass around CAD 382, where the formation rate of soot drops to a very small value and oxidation rate becomes dominant. This CAD corresponds to the time shortly after the end of injection where all the fuel is consumed and the high velocity jet no longer exists. At this time, for the no swirl case, the two soot clouds at each side of the spray collide at the mid-spray axis. shows the soot cloud and flow structure at Plane I and II corresponding to this CAD for both no-swirl and high swirl cases.
Figure 17. Structure of the flow inside the cylinder at planes I and II for SN = 0 and 3.4. Velocity vectors are colored with O mass fraction and the 2D contours represent the soot volume fraction.
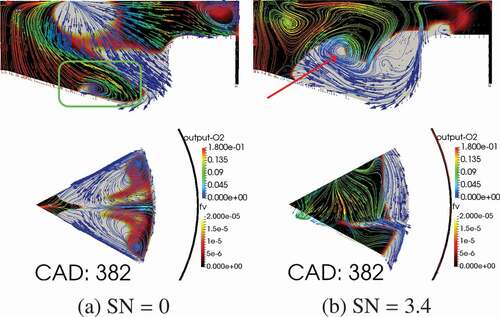
As shown in Plane I in for the no-swirl case, recirculation jet enhances outward flow along the floor, effectively oxidizing soot deep in the bowl. For the high swirl case, the excessive amount of soot that is formed or transported into the bowl region is now transported up-wards toward the oxygen rich region. A small recirculation zone is formed, as marked in , where recirculated oxygen has broken into the soot cloud, accelerating oxidation.
Late cycle soot oxidation is more pronounced in the high swirl case. The reason for this higher oxidation rate is the presence of higher amount of soot in the high swirl case. As presented in , at around CAD 384, the oxidation rate of soot for swirl ratio 3.4 case becomes considerably higher than the oxidation rate of no-swirl case. For the high swirl case, the expansion phase creates a downward velocity, instead of expanding the vortex size as in the no-swirl case, bringing oxygen from high oxygen concentration region close to the piston head toward the piston bowl, where the soot cloud is located.
show the flow streamline colored with oxygen mass fraction in the Plane I and II for no-swirl and high-swirl cases, respectively. In the no-swirl case, the two vortexes are still active, however, there is less oxygen in the region that these energetic recirculation vortexes are active. The slow oxidation of soot in this plane can be identified in the sequence presented in where the tail of the soot cloud is slowly disappearing in Plane II. In Plane I, soot inside the piston bowl is completely oxidized by CAD 394, due to downward velocity and transport of oxygen.
Figure 18. Structure of the flow inside the cylinder at planes I and II for the no-swirl case, SN = 0. Velocity vectors are colored with O mass fraction and the 2D contours represent the soot volume fraction.
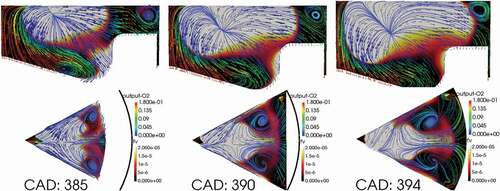
Figure 19. Structure of the flow inside the cylinder at planes I and II for the high swirl case, SN = 3.4. Velocity vectors are colored with O mass fraction and the 2D contours represent the soot volume fraction.
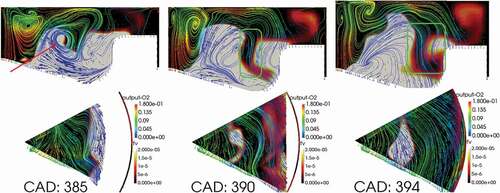
In the high swirl case, the downward velocity in the cylinder is followed by a strong negative radial velocity along the piston bowl, transporting soot toward the center of the cylinder where it can be mixed with oxygen and oxidized. The radial velocity creates a recirculation zone inside the soot cloud where an effective oxidation of soot take place. Comparing the sequence of figures in Plane I of , the effect of this recirculation zone can be identified.
At late cycle in the no-swirl case, for instance at CAD 400 where a change in the slope of the soot oxidation rate can be seen in , the soot cloud is attacked from two sides, both by the oxygen in the center of the cylinder and by the recirculated oxygen in the middle of the bowl. This new oxidation site is formed by a tumble-liked motion which is created due to the expansion of the engine. Expansion of the engine creates a positive radial velocity on the bowl surface close to the center of the cylinder, which push oxygen toward the middle of the bowl and start oxidizing soot.
Kinetic energy
Production of kinetic energy, being in a right place, can enhance soot oxidation. shows the mean kinetic energy and mean turbulent kinetic energy inside the cylinder for cases with different swirl numbers. Mean kinetic energy is much higher for the high swirl number case, as expected, which is due to the swirl motion energy. However, the effect of swirl motion on the turbulent kinetic energy is less pronounced by increasing the swirl number.
Figure 20. Kinetic energy, turbulent kinetic energy for different swirl numbers and swirl ratio history of the high swirl case.
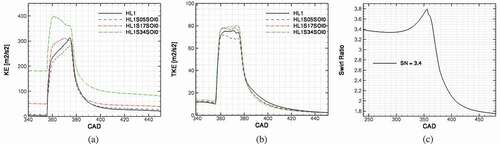
The shape of the mean kinetic energy is different for different cases. For low swirl cases, a jump due to the start of injection is followed by a slow increase in the curve, while in the SN = 1.7 case, mean kinetic energy reaches a plateau after the start of injection. For high swirl ratio case, SN = 3.4, the mean kinetic energy is decreasing during the injection after the sharp increase due to the start of injection. This behavior can be explained by the combined effect of positive kinetic energy added by the spray and negative kinetic energy due to the slow down of the swirl velocity due to the increase in the squish height and lager diameter of the cylinder. When the piston moves downward, the volume of the squish region increases and flow enters into a squish region with larger diameter. Larger diameter means slower swirl motion. This can be seen in the plot of swirl ratio for the high swirl case, as presented in . Mean turbulent kinetic energy, however, depends on the flow structures. A comparison between ) shows that despite the higher mean kinetic energy in high swirl case, no-swirl case has a higher mean turbulent kinetic energy at late cycle. This is due to the coherent structure created by the spray-wall interaction that survived long after the end of injection.
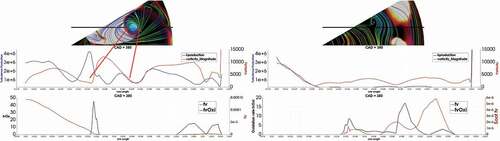
, as an example, show the magnitude of vorticity and production term of kinetic energy across this vortex structure at two CADs, 375 and 380. Soot oxidation is also presented in these figures. For comparison, the same figures are presented for high swirl case. Much higher production of turbulence can be seen for the no-swirl case compared with the high swirl case. Moreover, for the no-swirl case, turbulence production and vorticity shows some correlation. The higher turbulence production in the no swirl case then can be attributed to these vortex structures acting as production sources for turbulence.
Figure 21. Production term of turbulent kinetic energy, vorticity magnitude, soot, and soot oxidation rates across a vortex structure in Moving Plane B at CAD 375.
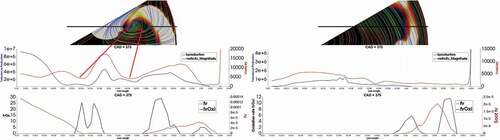
Figure 22. Production term of turbulent kinetic energy, vorticity magnitude, soot, and soot oxidation rates across a vortex structure in Moving Plane B at CAD 380.
Conclusions
The effect of swirl motion on the soot formation and oxidation was studied for an open-bowl, quiescent heavy duty engine at high load. A total of 4 swirl numbers were considered, SN = 0, 0.5, 1.7, and 3.4. The following points can be concluded from this study:
By increasing the swirl ratio in this engine, the final mass of soot at the exhaust was increased. This increase in the final value was also followed by an increase in the peak value of in-cylinder soot during the cycle.
The amount of soot at the exhaust was directly correlated to the duration of combustion. The difference between the CA90 and CA50, as a measure of the late cycle combustion duration, showed similar trends as final soot mass with respect to changes in swirl number, injection pressure and SOI.
By increasing the swirl ratio, the flame-flame iteration event occurs in an earlier time. As a result, more fuel rich mass is formed and also the fuel rich mass is pushed toward the perimeter of the cylinder by high momentum of the spray.
It was shown that soot is formed inside the clockwise vortex in the high swirl case. Consequently, high concentration of soot moves in the same direction as the swirl. Due to the positive combination of the swirl motion and clockwise motion of the vortex, the soot cloud formed inside the clockwise vortex moves faster than counter-clockwise vortex and it joins the soot cloud from the adjacent spray in a short time.
Due to the flame-flame interaction, the formation rate of soot was increased by increasing the swirl number.
At the same time, by increasing the swirl number, the oxidation rate was decreased after the flame–flame interaction event. When the two counter-rotating vortices that were formed due to flame–wall interaction in the low swirl cases encountered, they pushed the soot cloud toward the center of the cylinder. While in the high swirl cases, presence of tangential velocity kept the soot cloud close to the perimeter of the cylinder.
Late cycle soot oxidation was higher in the high swirl case compared with low swirl case. However, this increase in the oxidation rate at late cycle can be explained, partly, by the presence of higher amount of soot in the high swirl case. Nevertheless, different mechanism of soot oxidation in the no-swirl and high swirl cases can be explained by the differences in the flow structures at these conditions.
Downward velocity imposed by expansion of the cylinder and presence of large negative radial velocity on the piston bowl surface is the dominant mechanism of soot oxidation at late cycle in the high swirl case.
Positive radial velocity on the bowl surface close to the center of the cylinder created by the expansion of the cylinder is the dominant mechanism of soot oxidation at late cycle in the no swirl case.
Despite the higher mean kinetic energy in the high swirl cases compared with the no-swirl case, the no-swirl case has a higher mean turbulent kinetic energy at late cycle. This is due to the presence of coherent structures which are created by the spray-wall interaction and can survive long after the end of injection.
Acknowledgments
This work was supported by the Swedish Energy Agency through project number 41043-1. The simulations were performed on resources provided by the Swedish National Infrastructure for Computing (SNIC) at HPC2N and PDC.
References
- Arcoumanis, C., A. F. Bicen, and J. H. Whitelaw. 1983. Squish and swirl-squish interaction in motored model engines. J. Fluids Eng. 105:105–12. doi:https://doi.org/10.1115/1.3240925.
- Barths, H., C. Hasse, and N. Peters. 2000. Computational fluid dynamics modelling of non-premixed combustion in direct injection diesel engines. Int. J. Engine Res. 1:249–67. arXiv. doi:https://doi.org/10.1243/146808700154516.
- Bergin, M. J., R. D. Reitz, S. Oh, P. C. Miles, L. Hildingsson, and A. Hultqvist. 2007. Fuel injection and mean swirl effects on combustion and soot formation in heavy duty diesel engines. In SAE technical paper, SAE International. doi:https://doi.org/10.4271/2007-01-0912.
- D’Errico, G., T. Lucchini, R. Di Gioia, and G. Bonandrini. 2012. Application of the ctc model to predict combustion and pollutant emissions in a common-rail diesel engine operating with multiple injections and high egr. In SAE 2012 world congress & exhibition, SAE International. doi:https://doi.org/10.4271/2012-01-0154.
- Fatehi, H., H. Persson, T. Lucchini, M. Ljungqvist, and O. Andersson. 2019. Effects of in-cylinder flow structures on soot formation and oxidation in a swirl-supported light-duty diesel engine. In 14th International Conference on Engines & Vehicles, SAE International.
- Fatehi, H., E. Wingren, T. Lucchini, G. D’Errico, A. Karlsson, O. Andersson, and X. S. Bai. 2018. A numerical study on the sensitivity of soot and nox formation to the operating conditions in heavy duty engines. In WCX World congress experience, SAE International. doi:https://doi.org/10.4271/2018-01-0177.
- Leung, K., R. Lindstedt, and W. Jones. 1991. A simplified reaction mechanism for soot formation in nonpremixed flames. Combust. Flame 87:289–305. doi:https://doi.org/10.1016/0010-2180(91)90114-Q.
- Lucchini, T., G. D’Errico, H. Jasak, and Z. Tukovic. 2007. Automatic mesh motion with topological changes for engine simulation. In SAE World congress & exhibition, SAE International. doi:https://doi.org/10.4271/2007-01-0170.
- Lucchini, T., G. D’Errico, A. Onorati, G. Bonandrini, L. Venturoli, and R. Di Gioia. 2012. Development of a cfd approach to model fuel-air mixing in gasoline direct-injection engines. In SAE 2012 World Congress & Exhibition, SAE International. doi:https://doi.org/10.4271/2012-01-0146.
- Lucchini, T., M. Fiocco, R. Torelli, and G. D’Errico. 2014. Automatic mech generation for full-cycle cfd modeling of ic engines: Application to the tcc test case. SAE 2014 World congress & exhibition, SAE International. doi:https://doi.org/10.4271/2014-01-1131.
- Miles, P. C., D. Choi, M. Megerle, B. RempelEwert, R. D. Reitz, M. C. Lai, and V. Sick. 2004. The influence of swirl ratio on turbulent flow structure in a motored hsdi diesel engine - a combined experimental and numerical study. SAE technical paper, SAE International. doi:https://doi.org/10.4271/2004-01-1678.
- Miles, P. C., M. Megerle, J. Hammer, Z. Nagel, R. D. Reitz, and V. Sick. 2002. Late-cycle turbulence generation in swirl-supported, direct-injection diesel engines. SAE technical paper, SAE International. doi:https://doi.org/10.4271/2002-01-0891.
- Miles, P. C., M. Megerle, V. Sick, K. Richards, Z. Nagel, and R. D. Reitz. 2001. The evolution of flow structures and turbulence in a fired hsdi diesel engine. In SAE technical paper, SAE International. doi:https://doi.org/10.4271/2001-01-3501.
- Mori, K., H. Jyoutaki, K. Kawai, and K. Sakai. 2000. New quiescent combustion system for heavyduty diesel engines to overcome exhaust emissions and fuel consumption tradeoff. In CEC/SAE Spring fuels & lubricants meeting & exposition, SAE International. doi:https://doi.org/10.4271/2000-01-1811.
- Peters, N. 1983. Local quenching due to flame stretch and non-premixed turbulent combustion. Combust. Sci. Technol. 30:1–17. arXiv. doi:https://doi.org/10.1080/00102208308923608.
- Peters, N. 1984. Laminar diffusion flamelet models in non-premixed turbulent combustion. Prog. Energy Combust. Sci. 10:319–39. doi:https://doi.org/10.1016/0360-1285(84)90114-X.
- Pitsch, H., H. Barths, and N. Peters. 1996. Three-dimensional modeling of nox and soot formation in di-diesel engines using detailed chemistry based on the interactive flamelet approach. In 1996 SAE international fall fuels and lubricants meeting and exhibition, SAE International. doi:https://doi.org/10.4271/962057.
- REITZ, R. 1987. Modeling atomization processes in high-pressure vaporizing sprays. Atomisation Spray Technol. 3:309–37.
- Yao, T., Y. Pei, B. J. Zhong, S. Som, T. Lu, and K. H. Luo. 2017. A compact skeletal mechanism for n-dodecane with optimized semi-global low-temperature chemistry for diesel engine simulations. Fuel 191:339–49. doi:https://doi.org/10.1016/j.fuel.2016.11.083.