
 ?Mathematical formulae have been encoded as MathML and are displayed in this HTML version using MathJax in order to improve their display. Uncheck the box to turn MathJax off. This feature requires Javascript. Click on a formula to zoom.
ABSTRACT
This paper performs a meta-analysis of the effect on economic growth of financial development and liberalization in European emerging markets and compares with that in European advanced economies. A meta-synthesis of 893 estimates extracted from 45 studies suggests that finance in emerging markets has a positive effect on growth. Furthermore, our findings indicate that the synthesized effect size in emerging markets was smaller than that in advanced economies. Results from meta-regression analysis and test for publication selection bias, however, show that some synthesis results cannot be reproduced when literature heterogeneity and publication selection bias are taken into consideration.
JEL Classification:
Introduction
Whether financial development and liberalization contribute to economic growth has long been a subject of debate among economists. Schumpeter (Citation1911) claimed that credit extended to the entrepreneur for purposes of innovation forms an element of economic development. This shows that when banks advance financial intermediary functions, they contribute to economic growth. On the other hand, Robinson (Citation1952) argued that financial development reacts passively to economic growth because economic growth increases demand for financial services. Classic studies arguing that the development of financial systems promotes economic growth as proposed by Schumpeter (Citation1911) include Gurley and Shaw (Citation1955), Goldsmith (Citation1969), and Hicks (Citation1969).
There are also diverse views on whether financial liberalization promotes economic growth. McKinnon (Citation1973) and Shaw (Citation1973) claimed that finance provided at artificially low interest rates is unnecessary because it introduces distortions in the financial system. Such distortions cause the inefficient allocation of resources by decreasing savings and preventing capital accumulation. If market mechanisms allow interest rates to adjust freely, entrepreneurs would have incentives to invest in projects that promise high yields. They both argued that financial liberalization contributes to economic growth on the basis of this viewpoint. In contrast, Van Wijnbergen (Citation1983) examined whether high interest rates on time deposits in developing countries increase production and economic growth, including the unorganized money market (curbmarket) in the model. The results suggest that the relationship between high interest rates on time deposits and economic growth or output increase is inconclusive. Therefore, the arguments of McKinnon (Citation1973) and Shaw (Citation1973) are not necessarily applicable to developing countries. Specifically, if households shift their portfolios from the curbmarket to bank deposits in developing countries as bank deposit interest rates rise, the funds that banks are able to lend will decrease because of their need to hold more reserve deposits. Rising interest rates result in decreased investment and production. This implies that financial liberalization does not necessarily promote economic growth.
In addition to the above debates, Stiglitz (Citation2000) argued that an increase in the frequency of financial crises is closely related to financial liberalization. This argument also suggests that financial liberalization does not necessarily contribute to economic growth.
So, what kinds of conclusions can we derive from empirical research on the relationship between financial development/liberalization and economic growth in European emerging markets and advanced economies? Prior to their economic system transition, European emerging markets had planned economies, in which the banking system consisted of central banks and state-owned banks under central bank control, and they provided loans only in accordance with state plans. Their transition to market economies resulted in the liberalization of their banking systems, accompanied by the establishment of privately owned banks and the privatization of state-owned banks (Iwasaki and Uegaki Citation2017). However, have financial development and liberalization contributed to economic growth after European emerging markets adopted market economies? As argued in the third section below, conclusions on this topic are diverse, and a unified conclusion has not been reached. On the other hand, although European advanced economies have highly developed financial systems, due to the lack of prior meta-analysis regarding European advanced economies, it is impossible to conclude whether financial development has promoted economic growth. Accordingly, this paper aims to derive a conclusion regarding the relationship between financial development/liberalization and economic growth in European emerging markets and advanced economies through a meta-analysis of previous studies.
The contributions of this study to the existing literature are as follows. First, it is the first study to employ meta-analysis to examine whether financial development and liberalization promote economic growth in European emerging markets. In particular, this study investigates the finance-growth nexus in the initial stage of the transition to a market economy. Second, it is the first study to perform meta-analysis to discuss whether financial development and liberalization promote economic growth in European advanced economies. While numerous studies examine this topic regarding European advanced economies, no unified conclusions have been derived. This study will provide a conclusion on this topic, employing meta-analysis. Third, this is the first meta-analysis that investigates the differences in the degree to which finance promotes economic growth between European emerging markets and European advanced economies. Comparing them, this paper suggests the possibility that factors such as regulation and supervision of the financial sector, banks’ abilities to identify promising projects, banks’ abilities to monitor business enterprises, and banks’ advisory capabilities vis-a-vis borrower firms can lead to differences in economic growth. This implies the importance of the above-mentioned perspectives in financial research.
Meta-synthesis of 893 estimates extracted from 45 previous studies strongly suggested that financial development and liberalization in European emerging markets has a positive effect on their economic growth and that the effect size varies considerably, depending on the countries studied, the estimation period, and the field studied. Furthermore, we also found that the synthesized effect size of European emerging markets was smaller than that of European advanced economies. However, results from meta-regression analysis (MRA) and test for publication selection bias show that some synthesis results cannot be reproduced when literature heterogeneity and publication selection bias are taken into consideration. Further research would be required in order to determine the causal relationship between finance and growth in Europe.
The remainder of this paper is structured as follows. The next section discusses banking system reforms in European emerging markets and advanced economies and introduces four characteristic examples of banking reforms in European emerging markets. The third section overviews previous studies and proposes a series of hypotheses regarding financial development/liberalization and economic growth. The fourth section discusses the methodologies of literature review and meta-analysis. The fifth section overviews the literature subject to the meta-analysis. The sixth section conducts meta-synthesis of the extracted estimates. The seventh section performs MRA of heterogeneity among studies. The eighth section tests for publication selection bias. Lastly, the ninth section summarizes major findings and concludes the paper.
Banking System Reforms in European Advanced Economies and European Emerging Markets
Before conducting the meta-analysis, the first subsection of this section discusses banking system reforms toward the creation of a single market in European advanced economies, and then the second subsection overviews banking system reforms and the state of bank lending in European emerging markets. Because transition to a market economy constitutes a substantial systemic change, the discussion below will be centered on European emerging markets.
Banking System Reforms toward the Creation of a Single Market in European Advanced Economies
On December 15, 1989, the European Council adopted the Second Council Directive on the coordination of laws, regulations, and administrative provisions relating to the taking up and pursuit of business of credit institutions (89/646/EEC). The main details of this directive are as follows. First, it established a minimum capital requirement for banks of 5 million ECU. It also permitted banks to operate anywhere in the European Community with a single license. That is, after obtaining a banking license in any country in the European Community, a bank could open a branch in another country of the European Community without a new license in that country. The country that issued the banking license would be responsible for banking supervision. Furthermore, it also permitted banks in the European Community to engage in investment banking as well as commercial banking. This was followed by the issue of the Council Directive on credit institutions’ own funds (89/299/EEC) and the Council Directive on a solvency ratio for credit institutions (89/647/EEC). In 2000, they were finally consolidated into the Directive of the European Parliament and of the Council relating to the taking up and pursuit of the business of credit institutions (2000/12/EC).
As for capital movements, the fourth directive on the liberalization of capital movements (88/361/EEC) was adopted on June 24, 1988, and capital movements in the European Community were fully liberalized in July 1990 based on it.
Here, let us survey bank lending relative to GDP in the European advanced economies. According to the International Financial Statistics of the IMF, the ratio of depository corporations, domestic claims, and claims on other sectors to the nominal GDP in the eurozone as a whole rose from 112% in 2001 to 145% in 2007. The real GDP index as well rose from 91.0 in 2001 to 102.1 in 2007. These data imply that there is a positive correlation between financial development and economic growth.
Banking System Reforms and Bank Lending in European Emerging Markets
Next we overview banking system reforms and bank lending in European emerging markets.
In a socialist planned economy, banks played only a passive role and did not function as voluntary financial intermediates between savers and investors (Schmieding Citation1993). The financial system basically served an accounting function of totaling funds allocated to businesses as decided by the authorities, and banks merely distributed funds in accordance with state plans (EBRD Citation1998). The state bank was in charge of overall control of the payment and credit system and was the sole provider of loans to enterprises. Loans could be given for short-term coverage of current expenditures and inventories and for long-term investment finance. Sometimes the latter function was carried out by a separate entity, a state investment or development bank. This socialist financial system was referred to as a monobank, or one-tier, banking system. Since there were no capital markets and credit markets in a planned economy, interest rates were fixed by the authorities (Barisitz Citation2007b).
The transition from a planned economy to a market economy required transformation from the one-tier banking system to a two-tier banking system, in which the central bank comprised Tier 1, and Tier 2 consisted of commercial banks. In the case of the Soviet Union, the development of a two-tier banking system began in 1987 (Johnson Citation2000; Barisitz Citation2007b; Aivazian et al. Citation2011).Footnote1 Based on a July 1987 decree by the Central Committee of the Communist Party of the Soviet Union and the Council of Ministers of the Soviet Union, the state bank (Gosbank) and the Construction Bank were split into a new organization consisting of the national bank and three new state-owned banks in January 1988: the Promstroibank (the Bank of Industrial Construction), the Agroprombank (the Agricultural Bank), and the Zhilsotsbank (the Bank of Residential Construction). Furthermore, the Vneshtorgbank (the Foreign Trade Bank) was reorganized into the Vnesheconombank (the Bank for Development and Foreign Economic Affairs) and the Sberkassa (the Labor Savings Bank) into the Sberbank (the Savings Bank). The May 26, 1988, Law on Cooperatives permitted the establishment of cooperative banks, and a September 1, 1988, decree by the Council of Ministers authorized the establishment of joint-stock banks.Footnote2 Moreover, a March 1989 decree by the Council of Ministers identified profit as the basis of banking activities, as an indicator of the efficiency of a state-owned bank’s activities.Footnote3 This process suggests that a two-tier banking system had been established in the Soviet Union in 1989.
As for socialist countries other than the Soviet Union, Yugoslavia transferred to a two-tier banking system in the 1960s, Hungary in 1987, Poland in 1989, and Czechoslovakia in 1990 (Barisitz Citation2007b).
Reform of the banking sector in the transition to a market economy was conducted based on policy recommendations from the International Monetary Fund and the World Bank. This so-called Washington consensus on transition in the banking sector demanded the separation of commercial banking functions from the central bank, the abolition of currency-exchange restrictions, the liberalization of interest rates, the reorganization and privatization of state-owned banks, and market entry by privately owned banks. At the same time, the government was required to ensure the soundness of the banking sector and supervise banking activities (Fries and Taci Citation2001).
Financial Development/liberalization and Economic Growth: Four Types
Panel (a) of depicts bank lending relative to GDP on the horizontal axis and the European Bank for Reconstruction and Development (EBRD) index for banking reform and interest rate liberalization (hereafter, the banking reform index) on the vertical. While at first, the banking reform index reflected classification into four ranges of 1 through 4, beginning in 1997, plus and minus signs were added to indicate borderline figures. In accordance with the description on the EBRD’s website, a plus sign was used to add 0.33 to the index and a minus sign to subtract 0.33 from the index in the following figures.Footnote4
Figure 1. Correlation between progress in banking reform and financial intermediation in European emerging markets.
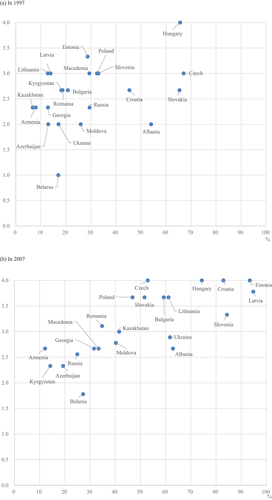
As can be seen in Panel (a) of , the banking reform index and bank lending relative to GDP are positively correlated, for the most part. Specifically, Hungary’s banking reform index of 4 and bank lending relative to GDP of 65.6% both represent relatively high levels, while Belarus’s banking reform index of 1 and bank lending relative to GDP of 17.0% both are relatively low. On the other hand, Albania’s bank lending relative to GDP is high at 54.0%, whereas its banking reform index remains low at 2. In contrast, in Estonia, Latvia, and Lithuania, bank lending relative to GDP is low at 28.7%, 13.9%, and 12.8% respectively, while their respective banking reform indices are relatively high at 3.33, 3, and 3.
Panel (b) of depicts bank lending relative to GDP and the banking reform index in 2007. While bank lending relative to GDP and the banking reform index both were low in Azerbaijan, Armenia, Kyrgyzstan, Georgia, Belarus, Macedonia, and Russia, bank lending relative to GDP was quite high in the Baltics. While the correlation coefficient between bank lending relative to GDP and the banking reform index was 0.40 in 1997, it was 0.76 in 2007, which suggests the correlation between the two indicators had strengthened.
Subsequent sections will overview banking sector reforms in the following countries: Hungary, where the banking reform index and bank lending relative to GDP both are high; Belarus, where the banking reform index and bank lending relative to GDP both are low; Albania, where the banking reform index is low but bank lending relative to GDP is high; and the Baltics, where the banking reform index is high but bank lending relative to GDP is low.
Hungary
Hungary’s commercial banking law enacted in January 1992 stipulated that banks’ capital adequacy ratios must satisfy Basel standards (EBRD Citation1996). It also required that the government’s share of stock ownership in all commercial banks must be lower than 25% by 1997 (Hasan and Marton Citation2003). However, large-scale state-owned banks were temporarily exempted from the application of Basel standards (EBRD Citation1996). While 15–28% of bank loans were nonperforming in 1992, this was due mainly to loans provided to state-owned enterprises during the years through 1989. In 1993, the government exchanged nonperforming loans for government bonds. As a result, nonperforming loans at 14 banks were exchanged for government bonds amounting to 105 billion forints in face value. This measure enabled them to remove the nonperforming loans from their balance sheets. Furthermore, the government injected a total of 360 billion forints in capital – equivalent to about 8% of the 1994 GDP – into banks, mainly during the years 1992–1994 (Hasan and Marton Citation2003). As a result, by the end of 1994, all large banks had capital adequacy ratios of more than 8% (EBRD Citation1997). After nonperforming loans were eliminated from their balance sheets and their capital was increased, the privatization of state-owned banks advanced in 1995–1996. While at the end of 1994, state-owned banks (those in which the government held more than 50% of stock) accounted for 62.8% of total bank assets, by the end of 1996, this figure fell to 16.3%. As of the end of 1997, the number of banks in which foreign capital held more than 50% of stock reached 30 out of Hungary’s 41 banks (EBRDCitation1999).
In 2001, in preparation for EU accession, Hungary abolished restrictions on capital movements and declared the forint to be convertible, as well as enacting a new central bank law that fully conformed to EU standards (National Bank of Hungary Citation2002).
As reviewed above, during the first half of the 1990s, the Hungarian government eliminated nonperforming loans from the balance sheets of existing banks and increased their capital; it then attempted to improve its laws and systems in preparation for EU membership.
Belarus
While Belarus implemented reforms toward a market economy in the initial period after independence, the Belarussian government shifted away from its prior policies of reform and began to strengthen the economic involvement of presidential decrees and directives after Alexander Lukashenko was inaugurated as President in 1994 (Barisitz Citation2007a, Citation2007b). The government demanded that not only commercial banks but even the Belarus People’s Bank (the central bank) provide loans to sectors such as agriculture and residential construction (EBRD Citation1996). Many such loans became nonperforming, worsening the financial state of banks (Barisitz Citation2007b). Former Soviet special-purpose banks were considered nonprofit organizations with a social obligation to contribute to economic development (Barisitz Citation2007b). Belarussian presidential decree No. 209 of May 24, 1996, increased the government’s ownership stake in banks handling national programs. As a result, the government’s stake increased, for example, from 17% to 39% in Belpromstroibank and from 18% to 48% in Priorbank (Barisitz Citation2007b). While state-owned banks (those in which the government held more than 50% of stock) accounted for 55.2% of total bank assets at the end of 1997, this figure rose to 76.5% by the end of 2007 (Fink, Haiss, and Vuksic Citation2006; EBRD Citation2003; EBRD Citation2008).
In 1998, the Belarussian government dismissed the members of the central bank board of governors and placed it under government supervision (EBRD Citation1998). Furthermore, presidential decree No. 152 of March 20, 1998, restricted decision-making on economic, fiscal, and monetary policy by the Belarus People’s Bank.
Investment relative to GDP in Belarus began to rise sharply after bottoming out in 2002, reaching more than 40% in 2010. One of the main reasons for this was directed lending provided by state-owned banks (Miksjuk, Ouliaris, and Pranovich Citation2015).Footnote5 The Development Bank of the Republic of Belarus, established in June 2011, was expected to make direct lending more transparent (EBRD Citation2012). While directed lending accounted for about 50% of the total bank lending in 2013–2014, it had fallen to just over 30% as of April 2018 (IMF Citation2019).
Belarus was able to achieve comparatively high economic growth rates while the economy of its neighbor, Russia, was strong. However, it continued to extend lending that could be described as a legacy of a planned economy.
Albania
While Albania’s real GDP shrank by 7.2% in 1992, it grew by roughly 9% in each of the years from 1993 to 1996. Its GDP growth rate was high among transitioning economies, and the economic conditions were favorable. At the same time, factors such as contractionary monetary policy, regulatory deficiencies, large-scale inflows of foreign capital, and a weak central government facilitated Ponzi schemes (Bezemer Citation2001). The Ponzi schemes collapsed in 1997, and as a result, real GDP growth in that year was −10.9%.Footnote6 Bank lending relative to GDP rose sharply to 54% in 1997 from 37% in the previous year, precipitated in part by the contraction of the GDP that year. Lending to the private sector accounted for only 3.8% of GDP in 1997, as most of the lending was provided to the public sector and state-owned enterprises. According to the annual report of the Albanian Central Bank, about 91% of lending was extended to the government in 1999 (Bank of Albania Citation2000).
As of 1997, banks in Albania numbered just nine, of which three were state owned. At the end of 1997, the share of total assets of state-owned banks accounted for 89.9% of all banks, and the ratio of nonperforming loans reached 91.3% (EBRD Citation1998). Banks were under powerful political pressure in transitioning economies to ensure the survival of major state-owned enterprises (EBRD Citation1998), and Albania has been no exception.
The nonperforming loan ratio of the Savings Bank was 87.7% at the end of 2000, which stood out from other banks. Among other banks, the rate of the Italian-Albanian Bank was 8.9%, but the rest had rates of less than 2% (Bank of Albania Citation2001). At the end of 2001, the ratio of nonperforming loans at the Savings Bank fell substantially to 7.3% (Bank of Albania Citation2002). This could be a result of the write-off of large amounts of nonperforming loans in preparation for the Savings Bank’s privatization in September 2001 (although the privatization at that time was unsuccessful).
Privatization of state-owned banks and foreign capital participation began around 2000. In June 2000, the National Commercial Bank, the second-largest state-owned bank in Albania by assets, was privatized (EBRD Citation2000). In 2004, the Savings Bank, the nation’s largest bank, was sold to the Raiffeisen Group, which finished the privatization of all state-owned banks. Because the Savings Bank had not previously extended loans to the private sector, lending to the private sector was expected to increase after that (EBRD Citation2004). As of 2008, 15 of the 16 banks in Albania had some foreign capital investment, and at the end of 2007, foreign banks (those in which foreign investors held more than 50% of stock) accounted for 94.2% of total bank assets (EBRD Citation2008). According to the International Monetary Fund, bank lending relative to GDP and lending to the private sector relative to GDP stood at 58.1% and 33.0% as of 2017, respectively.
A new banking law was enacted in June 2007 to strengthen bank supervision, which brought the country’s legislation closer to that of the EU (EBRD Citation2007).
To recapitulate, although at first reforms of the banking sector did not show substantial progress in Albania and most of lending by state-owned banks to the public sector became nonperforming, the privatization of state-owned banks later advanced, and lending to the private sector increased considerably.
The Baltics
Each of the Baltic states experienced a banking crisis: Estonia in 1992, and Latvia and Lithuania in 1995. Estonia’s banking crisis was caused by the freezing of the assets of Estonian banks held in Moscow and the depletion of low-interest loans provided by the Estonian Central Bank. The shortage of liquidity ultimately triggered the crisis. The total assets of the affected banks accounted for about 40% of the total assets of all Estonian banks. After the crisis, the Estonian Central Bank revised its bank licensing and strengthened supervision. As a result, in mid-1993, the number of banks in the nation decreased from 43 to 23 (Fleming, Chu, and Bakker Citation1996).
Latvia’s crisis was caused by a decrease in opportunities for highly profitable trade finance as well as banking corruption and bankruptcy, particularly Bank Baltija. The crisis was triggered because Latvia’s Central Bank required banks to undergo auditing in accordance with international accounting standards. Banks that could not satisfy the Latvian Central Bank’s demands were declared insolvent. The total assets of insolvent banks accounted for about 40% of the total assets of all banks in the nation. Following the crisis, a new commercial banking law was enacted in October 1995, and regulation and supervision were strengthened. The number of banks in Latvia fell to 39, as the banking licenses of 25 institutions were revoked (Fleming, Chu, and Bakker Citation1996).
The cause of the banking crisis in Lithuania was, as in Latvia, a decrease in opportunities for highly profitable trade finance, along with loans to the agricultural and energy sectors extended by state-owned banks and privately owned banks under pressure by the Lithuanian government, which later became nonperforming. While Innovation Bank and Litimpex Bank sought a merger beginning in summer 1995 in order to address the decrease in revenue, inspection of both banks by the Lithuanian Central Bank uncovered financial reporting violations at both. Runs on both banks erupted when the inspection reports were leaked to the media (Fleming, Chu, and Bakker Citation1996). While Innovation Bank was liquidated in 1997, Litimpex Bank later resumed operations (EBRD Citation1997).
Next, let us review the situations in each of the Baltic states after the financial crisis. In Estonia, the regulatory capital adequacy ratio increased in October 1997 from 8% to 10% (EBRD Citation1997). After 1997, the nation no longer had any state-owned banks in which the government held more than 50% of stock (EBRD Citation1998). While Optiva Bank was renationalized after bankruptcy in 1998, it was privatized again in June 2000, so that the nation’s ratio of state-owned banks fell to zero once again (EBRD Citation2003). While nonresidents held 40% of capital in Estonian banks as of April 1994 (EBRD Citation1997), this percentage rose to 55.5% at the end of 1998 and 85.7% at the end of 2003 (Bank of Estonia Citation2004). Furthermore, in preparation for EU accession, the Estonian government eliminated restrictions on capital movement in 2001 (EBRD Citation2001) and established an integrated financial sector supervisory agency to oversee banking, securities, and insurance in 2002 (EBRD Citation2002).
In Latvia, 38% of stock in Unibanka, the nation’s largest state-owned bank, was sold to the private sector in 1996. Moreover, 25% of stock in the Latvian Savings Bank was sold through public offerings in 1997 (EBRD Citation1997). As a result, while state-owned banks (those in which the government held more than 50% of stock) accounted for 25% of total bank assets in Latvia in 1997, this figure stood at 8.5% in 1998, falling to 4.1% in 2003 (EBRD Citation1997; EBRD Citation2004). Foreign banks (those in which foreign investors held more than 50% of stock) accounted for 15 of Latvia’s total of 32 banks at the end of 1997, whereas their proportion increased to 12 of 19 banks at the end of 2002 (EBRD Citation2003). Furthermore, a comprehensive financial supervision law was passed in 2000; in response, the unified Financial and Capital Market Commission began supervising banks, brokerages, insurers, and other financial institutions in 2001 (EBRD Citation2001).
Although the percentage of total Lithuanian bank assets held by state-owned banks stood at 48.8% at the end of 1997, which is higher than those of the other Baltic states (EBRD Citation1997), it fell to 38.9% at the end of 2000 and 0% at the end of 2002 (EBRD Citation2004). Foreign banks (those in which foreign investors held more than 50% of stock) accounted for none of Lithuania’s total of 22 banks at the end of 1994, but they were four of its 11 banks as of the end of 2002 (EBRD Citation2003). In 2003, as it prepared for EU membership, Lithuania strengthened its banking supervision in line with IMF and EU recommendations. Specifically, in addition to increasing the number of financial institution supervisory staff at the central bank, the Commission for Regulation and Supervision of Financial Institutions and Insurance Companies was established, which was aimed at unifying supervision of the whole financial sector (EBRD Citation2001).
To recapitulate, although the Baltics were faced with banking crises soon after independence, they also strengthened the supervision of their banking sectors and the privatization of state-owned banks. Systems based on EU standards were developed as they acceded to the EU, and bank lending relative to GDP increased significantly.
Summary
In this section we overviewed banking system reforms and bank lending in European advanced economies and emerging markets. Because bank lending relative to GDP and the real GDP growth rate generally showed increasing trends in each country, it is expected that there is a positive correlation between financial development/liberalization and economic growth.
What have previous studies on European emerging markets and advanced economies concluded regarding financial development, liberalization, and economic growth? In the next section we will review previous studies in the field.
Literature Review and Hypothesis Development
Koivu (Citation2002) is a pioneering study that focused on the relationship between financial development and economic growth in European emerging markets. Using bank lending to the private sector relative to GDP (CREDIT) as an indicator of financial development, the paper analyzed 25 Eastern European and CIS states during the period from 1993 to 2000. In a regression analysis using the real GDP growth rate as the dependent variable, the coefficient with a one-period lag against CREDIT was negative with statistical significance. With regard to this result, the study claims that the scale of the financial sector in European emerging markets does not necessarily mean its high quality. Specifically, soft budget constraints have permeated numerous European emerging markets, and credit extended to enterprises could be used for unproductive investments in such a condition.Footnote7 The paper also argued that unsustainable increases in credit were related to the numerous financial crises during the 1990s.
Fink, Haiss, and Mantler (Citation2005a), on the other hand, is a pioneering study that discussed the relationship between financial development and economic growth in European advanced economies. This study included 15 advanced EU economies in its analysis, using data mainly from the years 1990–2001. The analysis shows that total financial assets (the total of bank lending, stock market capitalization, and bonds outstanding), which were used as an indicator of financial development, were positively correlated to real GDP per employee.
Fink, Haiss, and Vuksic (Citation2006) used securities market figures as an indicator of financial development. They analyzed nine new EU member states, using data from 1996 through 2000 to discuss the relationship between financial development and economic growth. According to the results, the correlation between the total amount of bank lending relative to GDP and economic growth was positive with statistical significance, whereas no statistically significant correlation was identified between bank lending to the private sector relative to GDP or between stock market capitalization relative to GDP and economic growth. The sum of bank lending, stock market capitalization, and bonds outstanding relative to GDP are also used as indicators of financial development. They show statistically significant positive correlations with economic growth. Furthermore, Fink, Haiss, and Vuksic (Citation2006) reported that, while capital stock is positively correlated with economic growth, it is not clear whether labor and education play significant roles in economic growth. Based on the finding that the development of financial market segments with stronger links to the public sector has stimulated economic growth, they argued that the development of financial intermediation is necessary for nongovernmental economic entities to function efficiently. Another study using securities market figures as indicators of financial development is Wu, Hou, and Cheng (Citation2010), which employed data from 1976–2005 concerning 13 advanced European economies. According to the results, stock market capitalization relative to GDP and stock market turnover relative to GDP are positively correlated to economic growth in the long run.
Caporale et al. (Citation2015) discussed the relationship between financial liberalization and economic development, employing data of 10 new EU member states for the years 1994–2007. Using as indicators of financial development broadly defined liquidity relative to GDP and stock market capitalization relative to GDP, they found their significant positive correlations with economic development. However, the coefficients of both variables were small, indicating that their impacts on economic development were limited. The authors noted that this might be due to the countries’ large amounts of nonperforming loans and to financial crises in new EU member states. In contrast, the indicator of financial liberalization – that is, an indicator of financial institution reform calculated by the authors based on an EBRD database – had a statistically significant positive correlation with the indicator of economic growth, with a relatively large coefficient. The implementation of reforms, the entry of foreign banks, and the privatization of state-owned banks have reduced transaction costs and increased credit availability. This has improved the efficiency of the banking sector, which has played an important role as an engine of growth. The authors noted that better regulation and supervision were partly motivated by the EU accession process and the need to adopt EU standards. Thus, many of the banking sector weaknesses traditionally characterizing emerging markets have gradually been eliminated. On the other hand, Romero-Ávila (Citation2009) analyzed data from 15 advanced EU economies for the years 1960–2001, finding a statistically significant positive correlation with economic growth for both the indicator of interest rate liberalization and the indicator of liberalization of capital controls.
Asteriou and Spanos (Citation2019) employed data from 1990 to 2016 to examine the relationship between financial development and economic growth, considering the global financial crisis of 2008–2009. They used as indicators of financial development broadly defined liquidity relative to GDP (LLY), commercial bank assets relative to the total assets of commercial banks and central banks (BTOT), stock market capitalization relative to GDP (MCAP), and stock market turnover relative to stock market capitalization (TOR). The results suggest that there is a statistically significant positive correlation between BTOT and economic growth, not only prior to the crisis but also during and after it. LLY, however, showed a negative correlation with economic growth both during the global financial crisis and after it. The coefficient of MCAP was not statistically significant either before or after the crisis. The statistically significant positive coefficient of BTOT indicates that sufficient bank capital could secure financial system stability.
The signs of the coefficients of financial development/liberalization indicators from previous studies are as follows. Koivu (Citation2002) found a negative coefficient for bank lending to the private sector relative to GDP. Mehl, Vespro, and Winkler (Citation2005), Gehringer (Citation2013), Petkovski and Kjosevski (Citation2014), Musta (Citation2016), and Jimborean and Kelber (Citation2017), as in Koivu (Citation2002), used bank lending to the private sector relative to GDP as an indicator of financial development, finding that it was negatively correlated to economic growth. Furthermore, Mehl, Vespro, and Winkler (Citation2005) also used broadly defined liquidity relative to GDP as an indicator of financial development, finding that it was negatively correlated to economic growth. Narayan and Narayan (Citation2013) used bank lending relative to GDP as an indicator of financial development, finding that it was negatively correlated to economic growth.
Moreover, some studies, such as Bouzid (Citation2013) and Özdemir (Citation2014), showed negative correlations between indicators of financial liberalization and economic growth.
In contrast to the research findings above, some studies show positive correlations between financial development/liberalization and economic growth. As in Koivu (Citation2002), Valverde, Del Paso, and Fernández (Citation2007), Vaona and Patuelli (Citation2008), Akimov, Wijeweera, and Dollery (Citation2009), Cojocaru, Hoffman, and Miller (Citation2011), Cojocaru et al. (Citation2016), and Rama (Citation2018) used bank lending to the private sector relative to GDP as an indicator of financial development. However, they argued that it was positively correlated to economic growth. Furthermore, Akimov, Wijeweera, and Dollery (Citation2009), Petkovski and Kjosevski (Citation2014), Caporale et al. (Citation2015), Yaroson (Citation2015), and Fetai (Citation2018) used broadly defined liquidity relative to GDP as an indicator of financial development, and each of these studies found that it was positively correlated to economic growth. Fink, Haiss, and Vukšić (Citation2005b) and Fink, Haiss, and Vuksic (Citation2006) employed as financial development indicators the total of private-sector lending, stock market capitalization and bonds outstanding relative to GDP, and bonds outstanding relative to GDP, finding their positive correlations with economic growth. Zeqiraj et al. (Citation2020) and Zeqiraj et al. (Citation2021) found a positive and significant impact of banking sector performance on economic growth. Romero-Ávila (Citation2009) and Caporale et al. (Citation2015) also showed that financial liberalization promoted economic growth.
Some studies found no statistically significant relationship between financial development and economic growth. Papers finding no statistically significant coefficient for bank lending to the private sector relative to GDP include Mehl and Winkler (Citation2003), Fink, Haiss, and Vukšić (Citation2005b), Fink, Haiss, and Vuksic (Citation2006), Fink, Haiss, and Vukšić (Citation2009), Caporale et al. (Citation2015), and Yaroson (Citation2015). Studies finding that the coefficient for stock market capitalization relative to GDP was not statistically significant include Fink, Haiss, and Vukšić (Citation2005b), Fink, Haiss, and Vuksic (Citation2006), Fink, Haiss, and Vukšić (Citation2009), Yaroson (Citation2015), and Asteriou and Spanos (Citation2019).
The previous studies mentioned above on European emerging markets and advanced economies made the following points clear. First, conclusions vary in the literature regarding whether financial development and liberalization promote economic growth. For this reason, it is not possible to reach a conclusion on the relationship between financial development/liberalization and economic growth from individual previous studies alone. Second, a wide range of figures have been employed as indicators of financial development and liberalization. In some cases, use of different indicators led to different conclusions. In other cases, conclusions differed even when using the same indicator.
For these reasons, a meta-analysis integrating and comparing the empirical findings of previous studies could be highly effective for deriving some conclusions about whether financial development and liberalization promote economic growth in European emerging markets and advanced economies. Accordingly, this paper will investigate through a meta-analysis of the existing literature the effects of financial development and liberalization on economic growth in European emerging markets and in European advanced economies, which have been recognized widely in analysis of other regions.
Prior to beginning the meta-analysis, we will propose five hypotheses below based on the discussion in the second section and the literature review in this section.
Comparison of and each country’s statistics show that the indicator of financial development (in this case, bank lending relative to GDP) and the banking reform index shift upward and to the right, while GDP in each European emerging market trended upward. For this reason, a positive correlation is expected to exist between financial development/liberalization and economic growth. As noted above, some studies that used private sector lending relative to GDP as an indicator of financial development found negative correlation with economic growth. However, no previous study found a statistically significant negative correlation between bank lending relative to GDP and economic growth. Moreover, while some studies found a negative correlation between financial liberalization and economic growth, their financial liberalization indicator is the total of direct investment and securities investment, which differed from the banking reform index used in . The first hypothesis, reflecting these considerations, is proposed as follows.
Hypothesis 1: Financial development and liberalization will have a positive effect on economic growth in European emerging markets.
Figure 2. Kernel density estimation of collected estimates.
Note: Vertical axis is Kernel density. Horizontal axis is partial correlation coeffcient of collected estimates. See Table 1 for the descriptive statistics of collected estimates.
As mentioned above, new EU member states have not only the legal systems needed for a market economy to function, but also rigid supervision systems for financial institutions. Furthermore, because EU accession promotes competition among financial institutions, interest rates could be decreased, which could lead to the increase in bank lending. Specifically, as discussed in the second section, prior to EU accession, Hungary abolished its restrictions on capital movements, while the Baltics strengthened their supervision of financial institutions. Furthermore, there are numerous banks with a high foreign capital ownership ratio in new EU member states. Consequently, financial development and liberalization are expected to have stronger impact on economic growth in new EU member states. The second hypothesis, reflecting these considerations, is proposed as follows.
Hypothesis 2: The effect size of financial development and liberalization on economic growth will be larger in new EU member states than in other European emerging markets.
There would be no doubt that people’s demand for goods and services was not fully satisfied in the initial stage of the economic transition, as compared to a later time. For this reason, in the initial stage of transition, there were relatively large numbers of highly profitable businesses, and business’s demand for funds could potentially be quite high as well. On the other hand, financial institutions were, unlike during the time of a planned economy, able to decide on their own to lend funds to highly profitable businesses. As a result, financial development and liberalization can be expected to have comparatively stronger impact on economic growth in the initial stage of an economic transition, and then, as time passed, intensification of competition would lead to a decrease in overall profit margins. Based on the discussion above, the third hypothesis is proposed as follows.
Hypothesis 3: The effect of financial development and liberalization on economic growth in European emerging markets will diminish over time.
As noted in the second section, while financial liberalization was advanced broadly in European emerging markets, some banking crises erupted due to factors such as inadequate financial supervision. Specific examples can be seen in the cases of Estonia in 1992 and Latvia and Lithuania in 1995, as well as the Czech Republic and Bulgaria in 1996. Furthermore, in Russia, financial liberalization made it possible for banks to borrow large amounts externally, which was one of the factors behind the 1998 financial crisis (OECD Citation2000; Ono Citation2012). Although it is true that financial crises reorganize the banking sector and prepare conditions for development, the damage caused would remain for some time and retard economic growth. Economic growth also could be promoted by factors such as the increase in lending under conditions of financial liberalization rather than by the financial liberalization itself.Footnote8 If these factors are taken into consideration, the following hypothesis could be presented.
Hypothesis 4: The effect of financial development on economic growth in European emerging markets will exceed that of financial liberalization.
Regulation and supervision of the financial system in European emerging markets were less strict and, thus, more vulnerable than those of European advanced economies, particularly during the period soon after the transition to a market economy (see, e.g., EBRD Citation1996). Furthermore, European emerging economies have a short history of a two-tier banking system under a market economy, which required the separation of commercial banking functions from their central banks, interest rate liberalization, reorganization and privatization of state-owned banks, and the participation of newly established privately owned banks. Therefore, the banks of European emerging markets were far inferior to those of European advanced economies in terms of their abilities to identify promising projects, to monitor business enterprises, and to advise management of borrower firms (Fries and Taci Citation2001; Thimann Citation2002). Moreover, in European emerging markets, about 60% of small businesses had received no loans from banks at all, and even about 30% of large firms had received no bank loans (EBRD Citation2006). In Russia as well, lending to SMEs was inadequate, and only about 10% of investment in all businesses was financed through bank lending (Barnard Citation2009). These factors suggest that the financial intermediation functions of European emerging markets were underdeveloped as compared to those of European advanced economies. Furthermore, as noted in the discussion of Hypothesis 4, in some cases, financial liberalization was one of the factors spurring financial crises. While it is true that advanced economies also may be the epicenters of financial crises, as in the case of the global financial crisis that began in the United States in 2008, the impact of the crisis could be more severe on European emerging markets than on European advanced economies. Specifically, in many European emerging markets, high reliance on bank loans denominated in foreign currency led to capital outflows during the 2008 global financial crisis and to the collapse of domestic currencies, resulting in swelling debts.Footnote9 The countries that received IMF funding aid within one year of the collapse of Lehman Brothers were Ukraine, Hungary, Iceland, Latvia, Belarus, Serbia, Romania, Poland, and Bosnia. Therefore, it could not be denied that more active international capital movements as a result of financial liberalization made the crisis more severe. The discussion above implies that the effect of financial development and liberalization on economic growth in European emerging markets was smaller than that in European advanced economies. Accordingly, this paper proposes the following hypothesis.
Hypothesis 5: The effect of financial development and liberalization on economic growth will be smaller in European emerging markets than in European advanced economies.
To test the above five hypotheses, the following sections will conduct a meta-analysis of the existing literature.
Procedure of Literature Selection and Methodology of Meta-Analysis
In this section, as the first step of testing the series of proposed hypotheses, we first describe the procedure for identifying and selecting literature for use in the meta-analysis, and then explain the methodology of the meta-analysis performed in this paper.
To identify existing studies that empirically examined the impact of financial development and liberalization on economic growth in the emerging markets and advanced economies of Europe, we searched for related literature by accessing EconLit and major academic press websites.Footnote10 In utilizing these electronic databases of academic literature, we carried out an AND search of paper titles, using “finance” or “financial” and “growth” as keywords. This title search yielded nearly 2,870 hits in EconLit and more than 580 additional hits from major academic press websites. After eliminating duplication among the literature found through these mechanical searches, we confirmed that, at a minimum, the literature in this field consisted of more than 2,500 published works in English. Of course, this includes numerous studies intended for purposes other than empirical analysis of European economies.
As a second step, we closely examined the content of each of the studies found to determine whether it studied either European emerging markets or European advanced economies and, if so, whether it included estimates that could be used in our meta-analysis, narrowing the literature list to a total of 45 papers that could be subjected to meta-analysis in this paper.Footnote11 An overview of these 45 selected works is presented in the next section. For the present study, we adopted an eclectic coding rule in which we do not necessarily limit selection to one estimate per study; instead, multiple estimates are collected from these 45 studies, if and only if we can recognize notable differences from the viewpoint of empirical methodology in at least one item of the target area, data type, regression equation, estimation period, estimator, and so forth. The results are reported in detail in the following section. Hereafter, K denotes the total number of collected estimates.
Next, we will provide a brief description of the methodology of meta-analysis performed in this study. To synthesize and compare estimates derived from the selected studies, we employ the partial correlation coefficient (PCC). The PCC is a unitless measure of the association of a dependent variable and the independent variable in question when other variables are held constant. When tk and dfk denote the t value and the degree of freedom of the k-th estimate (k= 1, 2, …, K), respectively, the PCC (rk) is calculated with the following equation
The standard error (SEk) of rk is given by . We synthesize PCCs using the meta fixed-effect model and the meta random-effects model, and, according to the Cochran Q test of homogeneity and I2 and H2 heterogeneity measures, we adopt the synthesized effect size of one of these two models as the reference value.
Following the synthesis of collected estimates, we conduct MRA to explore the factors causing heterogeneity between selected studies. To this end, we estimate the meta-regression model:
where yk is the PCC (i.e., rk) of the k-th estimate, β0 is the constant, xkn denotes a meta-independent variable that captures the relevant characteristics of an empirical study and explains its systematic variation from other empirical results in the literature, sek is the standard error of the PCC, βn denotes the meta-regression coefficient to be estimated, and ek is the meta-regression disturbance term.
As Iwasaki, Ma, and Mizobata (Citation2020) pointed out, there is no clear consensus among meta-analysts about the best model for estimating EquationEq. (2)(2)
(2) . Hence, to check the statistical robustness of coefficient βn, we perform an MRA using the following six estimators: (1) the cluster-robust weighted least squares (WLS), which clusters the collected estimates by study, computes robust standard errors, and is weighed by the inverse of standard error as a measure of estimate precision; (2) the cluster-robust WLS weighed by the degrees of freedom to account for sample-size differences among the studies; (3) the cluster-robust WLS weighed by the inverse of the number of estimates in each study to avoid the domination of the results by studies with large numbers of estimates; (4) the multi-level mixed-effects RLM estimator; (5) the cluster-robust random-effects panel GLS estimator; and (6) the cluster-robust fixed-effects panel LSDV estimator. We report either a random-effects model or a fixed-effects model, according to the Hausman test of model specification.
As the final stage of meta-analysis, we examine publication selection bias using a funnel plot and by conducting a funnel-asymmetry test (FAT), a precision-effect test (PET), and a precision-effect estimate with standard error (PEESE), which were proposed by Stanley and Doucouliagos (Citation2012) and have been used widely in previous meta-studies.
A funnel plot is a scatter plot with the effect size (in the case of this paper, the PCC) on the horizontal axis and the precision of the estimate (in this case, the inverse of the standard error 1/SE) on the vertical axis. In the absence of publication selection bias, effect sizes reported by independent studies vary randomly and symmetrically around the true effect. Moreover, according to the statistical theory, the dispersion of effect sizes is negatively correlated with the precision of the estimate. Therefore, the shape of the plot must look like an inverted funnel. In other words, if the funnel plot is not bilaterally symmetrical but is deflected to one side, then an arbitrary manipulation of the study area in question is suspected, in the sense that estimates in favor of a specific conclusion (i.e., estimates with an expected sign) are more frequently published.
The FAT-PET-PEESE procedure has been developed to test publication selection bias and the presence of genuine evidence in a more rigid manner: FAT can be performed by regressing the t value of the k-th estimate on the inverse of the standard error (1/SE) using the next equation (3), thereby testing the null hypothesis that the intercept term is equal to zero:
where k is the error term. When the intercept term
is statistically significantly different from zero, we can interpret that the distribution of the effect sizes is asymmetric.
Even if there is publication selection bias, a genuine effect may exist in the available empirical evidence. Stanley and Doucouliagos (Citation2012) proposed examining this possibility by testing the null hypothesis that the coefficient is equal to zero in Eq. (3). The rejection of the null hypothesis implies the presence of genuine empirical evidence.
is the coefficient of precision; therefore it is called a PET.
Moreover, Stanley and Doucouliagos (Citation2012) also stated that an estimate of the publication-selection-adjusted effect size can be obtained by estimating the following Equationequation (4)(4)
(4) , which has no intercept. If the null hypothesis of
is rejected, then the non-zero true effect does actually exist in the literature, and the coefficient
can be regarded as its estimate.
This is the PEESE approach. We can see that the coefficient γ1 in EquationEq. (4)(4)
(4) may become the estimate of the publication-bias-adjusted effect size in light of the fact that the following equation is obtained when both sides of EquationEq. (4)
(4)
(4) are multiplied by the standard error:
When directly estimating EquationEq. (5(5)
(5) ), the WLS method, with
as the analytical weight, is used.
To test the robustness of the regression coefficients obtained from the above FAT-PET-PEESE procedure, we estimate EquationEquations (4)(4)
(4) and (Equation5
(5)
(5) ) using not only the unrestricted WLS estimator, but also the WLS estimator with bootstrapped standard errors, the cluster-robust WLS estimator, and the unbalanced panel estimator for a robustness check. In addition to these four models, we also run an instrumental variable (IV) estimation with the inverse of the square root of the number of observations used as an instrument of the standard error, because “the standard error can be endogenous if some method choices affect both the estimate and the standard error. Moreover, the standard error is estimated, which causes attenuation bias in meta-analysis” (Cazachevici, Havranek, and Horvath Citation2020).
Furthermore, as argued in Bajzik et al. (Citation2020) and Zigraiova et al. (Citation2021), the FAT-PET-PEESE approach implicitly assumes that publication selection bias is linearly proportional to the size of the standard error, which might not be practical in some cases. To deal with the possible nonlinear relationship between the two, some advanced techniques have been developed recently. They include the “Top 10” approach, proposed by Stanley, Jarrell, and Doucouliagos (Citation2010), who discovered that discarding 90% of the published findings greatly reduces publication selection bias and is often more efficient than conventional summary statistics; the selection model, developed by Andrews and Kasy (Citation2019), which tests for publication selection bias using the conditional probability of publication as a function of a study’s results; the endogenous kinked model, innovated by Bom and Rachinger (Citation2019), which presents a piecewise linear meta-regression of estimates of their standard errors, with a kink at the cutoff value of the standard error below which publication selection is unlikely; and the p-uniform method, introduced by van Aert and van Assen (Citation2021), which is grounded on the statistical theory that the distribution of p-values is uniform conditional on the population effect size. In this paper, we apply these four techniques to provide alternative estimates of the publication selection bias–corrected effect size and compare them with the PEESE estimates for a robustness check.
Overview of Selected Works for Meta-Analysis
Appendix Table A1 lists the studies selected for meta-analysis in order of publication year based on the literature selection procedure described in the previous section. As this table shows, of the 45 studies selected, 33 studied European emerging markets, and 17 studied European advanced economies, meaning that five studies performed empirical analyses of both emerging markets and advanced economies. The results of our literature search show that empirical works on the causal relationship between financial development/liberalization and macroeconomic growth in Europe began to be published in the early years of the first decade of the 21st century, after which numerous studies were published in almost every year. As noted in the second section, pioneering studies in this field were those of Koivu (Citation2002) and Dawson (Citation2003), while the most recent studies include those of Mtar and Belazreg (Citation2021) and Rehman and Hysa (Citation2021).
The vast majority of the 33 studies of European emerging markets concerned multiple countries. Only three of these concerned a single country each: Musta (Citation2016), which studied Albania, Radjenovic and Rakic (Citation2017), which studied Serbia, and Mtar and Belazreg (Citation2021), which studied the Czech Republic. Aside from these three single-country studies, all of the studies included in their subjects of empirical analysis all or some of 11 East European countries that joined the EU (“new EU member states,” hereinafter), while 17 of the selected studies investigated non-EU East European countries, and 13 of them studied former Soviet states other than the Baltics. The composition of target countries in these previous studies reflects restrictions on available data and high interest in the new EU member states in the international community and academia. Nevertheless, more than a few studies have reported empirical results on not only the new EU member states but also non-EU East European countries and former Soviet states; this should make it quite possible to test Hypotheses 1 and 2 through meta-analysis. On the other hand, among the 17 studies of European advanced economies, ten concerned multiple countries, and seven concerned single countries; overall, these 17 studies concerned EU-member advanced economies in a broad sense.
The 33 studies of European emerging markets cover the 29-year period from 1989 through 2017 as a whole. The presence of research findings covering a period of 29 years is a favorable condition for testing Hypothesis 3. In addition, a series of financial variables, pioneered by studies such as Beck, Ross, and Norman (Citation2000) and Levine, Loayza, and Beck (Citation2000), that has become standard empirical methodology today in this field is also used proactively in studies of European emerging markets. Actually, 30 studies report estimates of the effect of financial development on economic growth using the variables of financial depth (i.e., liquid liabilities to GDP), private credit to GDP, bank credit to GDP, private credit to domestic credit, share of private banks in total bank credit/assets, market capitalization, stock market activity, turnover ratio, comprehensive index of financial development, and other index of financial development. While four studies provide estimates of the impact of financial liberalization by employing the variables of capital account openness, financial market liberalization, comprehensive index of financial liberalization, and other index of financial liberalization. In other words, while research on European emerging markets is focused on the impact of financial development on economic growth, more than a few empirical findings have been reported on the growth-enhancing effect of financial liberalization, so that the extant literature enables us to test Hypothesis 4. At the same time, the 17 studies of European advanced economies as a whole analyze the period of 59 years from 1960 through 2018, with all 17 of those studies reporting on estimates for financial development variables and one reporting on estimates for financial liberalization variables. This condition is sufficient for testing Hypothesis 5.
As shown in the rightmost column of Appendix Table A1, we collected a total of 893 estimates from the above-mentioned 45 selected studies. The mean and median of estimates per study were 19.8 and 7, respectively. In the following sections, we perform a meta-analysis with these 893 collected estimates using the methodology described in the previous section.
Meta-Synthesis
As the first step of meta-analysis, this section conducts a meta-synthesis of the 893 collected estimates introduced in the preceding section.
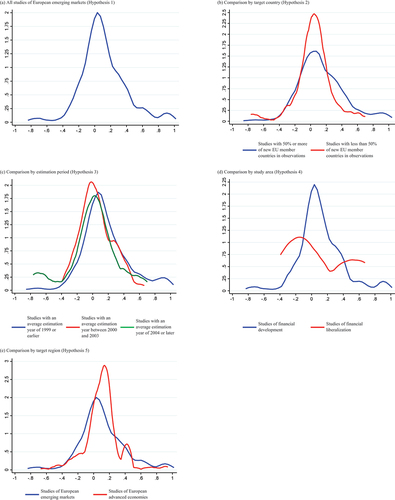
First, we will consider the distribution of the estimates. shows the descriptive statistics and the results of the t mean test and Shapiro–Wilk normality test for estimates extracted from all studies of European emerging markets and advanced economies individually as well as those grouped by target country, estimation period, and study area in the case of emerging market research. shows the kernel density estimation corresponding to the categories adopted in .
Table 1. Descriptive statistics of the partial correlation coefficients, t-test, and Shapiro–Wilk normality test of collected estimates
As shown in Column (a) of , both the mean and median for all studies of European emerging markets are positive, and according to the t test, the null hypothesis that mean is zero is rejected at the 1% statistical significance level. In addition, Panel (a) of shows the corresponding kernel density estimation biased in the positive direction. Accordingly, the empirical results reported in 33 studies as a whole demonstrate that financial development and liberalization do contribute to economic growth in European emerging markets – a finding that is in agreement with Hypothesis 1.
Furthermore, Columns (b) to (d) of show that the estimates collected from studies in which new EU member states account for 50% or more of observations, those of studies in which the average estimation year is 1999 or earlier, and studies of financial development have higher means and medians than studies in which new EU member states account for less than 50% of observations, those of studies in which the average estimation year is either between 2000 and 2003 or 2004 or later, and studies of financial liberalization, respectively; as shown in Panels (b) to (d) of , the dispersion of the former study types is more biased in a positive direction than that of the latter ones. Moreover, according to Column (e) of , while the mean for studies of European advanced economies is equal to that of European emerging markets, the median of the former is substantially higher than that of the latter. Besides, Panel (e) of shows that the distribution of estimates reported in the studies of advanced economies is much more strongly biased in the positive direction than that in studies of emerging markets. In sum, the above observations obtained from and are highly consistent with Hypotheses 2 to 5.
In light of the above considerations, we will turn next to the results of the meta-synthesis. reports synthesis results using a fixed-effect model and a random-effects model as well as the heterogeneity test and measures the median standard error and median statistical power of estimates.Footnote12 As shown in Column (B) of the table, in all eight cases, the Cochran Q test of homogeneity rejects the null hypothesis at the 1% significance level. In addition, the I2 and H2 statistics also indicate the presence of heterogeneity among studies concerned. Accordingly, we adopt the estimates of the random-effects model reported in Column (A) as reference synthesis values.
Table 2. Synthesis of collected estimates
As Column (a) of shows, the synthesis value using estimates collected from all studies of European emerging markets is positive and statistically significant at the 1% level, indicating that financial development and liberalization tend to promote economic growth in European emerging markets, which is in line with Hypothesis 1. According to the standards of Doucouliagos (Citation2011) regarding the evaluation of PCCs in economics research, however, the synthesized effect size of 0.084 is below the threshold of a small effect.Footnote13
also provides evidence supporting Hypotheses 2 to 5. In fact, Columns (b) to (d) in the table show that the synthesized effect sizes for studies with 50% or more of observations of new EU member countries, studies with an average estimation year of 1999 or earlier, and studies of financial development exceed those of the studies subject to comparison. In addition, the synthesis values for studies with 50% or more of observations of new EU member states and studies with an average estimation year of 1999 or earlier account for 0.110 and 0.136, respectively, or greater than the minimum threshold of a small effect as proposed by Doucouliagos (Citation2011) with 1% statistical significance, while the synthesis values for the counterparts are in contrast to the very small one or statistically insignificant. Furthermore, the result that the synthesized effect size for studies of European advanced economies overreaches that of European emerging markets (0.105 versus 0.084) coincides with our expectations under Hypothesis 5.
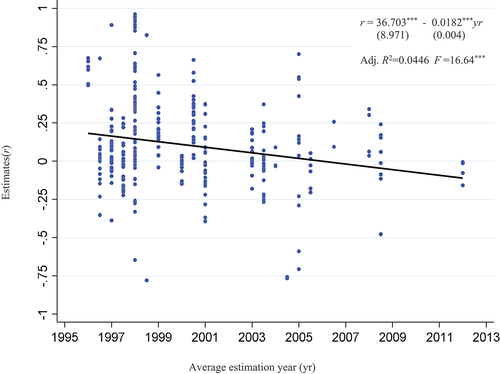
To complement the results in Column (c) of regarding Hypothesis 3, we looked at changes over time in the impact of finance on growth through a more detailed subdivision of collected estimates. The results are shown in . The approximation curve depicted in the figure shows that, as the average estimation year advances one year closer to the present, the effect size decreases by 0.0182 at the 1% significance level. This finding also supports the presence of a diminishing trend over time as proposed in Hypothesis 3.
Figure 3. Chronological order of partial correlation coefficients: All studies of European emerging markets.
Notes: The values in parenthese below the coefficients in the equation are roubustness standard errors. ***denotes statistical significance at the 1% level.
As discussed above, both the synthesis results in and the simple regression analysis in are consistent with our expectations, proving the presence of a positive effect on economic growth of financial development and liberalization in European emerging markets and strongly suggesting that its effect size could vary markedly with differences in the target country, estimation period, and study type. We also confirmed that, in Europe, the growth-enhancing effect of finance in advanced economies tends to outperform that in emerging markets.
Meta-Regression Analysis
In this section, as the second step of meta-analysis, we estimate EquationEq. (2)(2)
(2) to identify the effects of literature heterogeneity on the empirical results of selected studies. As described in the fourth section, we introduce the PCCs of the collected estimates into the left-hand side of the regression equation, while a total of 29 independent variables are employed on the right-hand side. They consist of variables that capture the differences in the number of countries studied, data type, estimator, types and attributes of economic growth variables, attributes of financial variables, presence of control for endogeneity, selection of control variables, and research quality, in addition to the variables of target country composition, estimation period, study area, and region that aim to test Hypotheses 2 to 5 and standard errors of PCCs. lists the names, definitions, and descriptive statistics of these meta-independent variables.
Table 3. Names, definitions, and descriptive statistics of meta-independent variables
As pointed out by Polák (Citation2019) and Havranek and Sokolova (Citation2020), MRA involves the issue of model uncertainty, in the sense that the true model cannot be identified in advance. In addition, there is a high risk that the simultaneous estimation of multiple meta-independent variables could lead to multicollinearity. Accordingly, in line with the approach of Bayesian meta-analysts, we first estimated the posterior inclusion probability (PIP) of each meta-independent variable other than the variables needed for hypothesis testing and standard error of PCCs, using the Bayesian model averaging (BMA) method. Then, we conducted an OLS frequentist check of variables with PIPs of 0.50 or more, adopting a policy of employing variables for which the estimates are statistically significant at a level of 10% or above as control variables in EquationEq. (2)(2)
(2) . As a result, when we estimated EquationEq. (2)
(2)
(2) using estimates obtained from research on European emerging markets, six variables – cross-sectional data, no conversion, nonlinear effects, political stability, human capital, and education – were selected as robust moderators against model uncertainty and multicollinearity. Similarly, for all studies, including estimates collected from research on European advanced economies, 13 variables from average estimation year to education were selected as robust moderators.Footnote14
reports the estimation results of EquationEq. (2)(2)
(2) using estimates available in studies of European emerging markets to test Hypotheses 2, 3, and 4 in light of the moderator-selection process outlined above. As shown in this table, most of the moderators were repeatedly estimated to be significant, proving that these are desirable control variables. The points focused on here are the estimates of meta-independent variables that identify studies in which non-EU member states make up the majority of countries studied, studies with an average estimation year between 2000 and 2003, studies with an average estimation year of 2004 or later, and studies of financial liberalization by a value of one.
Table 4. Meta-regression analysis of the study of European emerging markets: Baseline model
As shown in , the variable of non-EU majority studies is estimated to be significant and negative in three of five models, indicating that non-EU majority studies tend to report smaller effect sizes of financial development and liberalization on economic growth in a range between 0.0736 and 0.1181 than EU majority studies, ceteris paribus. In addition, the variables of average estimation year between 2000 and 2003 and average estimation year of 2004 or later each show a significant and negative coefficient in three models, implying that studies of the growth-promoting effect of finance in emerging markets in recent decades found its smaller impact as compared with those in the first decades of transition. In other words, these estimation results back up Hypotheses 2 and 3, in unison with the meta-synthesis results reported in the previous section. With regard to Hypothesis 4, while the variable of study of financial liberalization exhibits a negative coefficient in all five models, it is statistically significant in just one model. Hence, Hypothesis 4 is not supported by the MRA.
Test results of Hypothesis 5 are reported in . The table shows that, although the variable of study of European emerging markets shows a negative coefficient in all five models consistent with the hypothesis, it is estimated to be statistically significant in only one model. In other words, the estimation results in do not support our prediction about the difference between emerging markets and advanced economies in Europe in terms of the effect size of finance on growth.
Table 5. Meta-regression analysis: Comparison between the study of European emerging markets and the study of European advanced economies
The MRA performed in this section supports our hypotheses selectively. Nevertheless, we obtained some insights for deeper understanding of the empirical literature regarding the finance–growth nexus in Europe.
Test of Publication Selection Bias
This section tests for publication selection bias in the selected literature using a funnel plot and the FAT-PET-PEESE procedure as the final step of meta-analysis.
displays a funnel plot of collected estimates. As shown in Panel (a) of the figure, the distribution of collected estimates extracted from studies of European emerging markets is biased toward the positive side. Accordingly, our assessment of the likelihood of publication selection bias will be greatly impacted by whether we assume that the true effect is zero or that it takes a positive sign. The same observation is obtained from Panel (b) in respect to studies of European advanced economies as well.
Figure 4. Funnel plot of partial correlation coefficients.
Note: Solid line indicates the synthesized effect size of the random-effects model reported in .
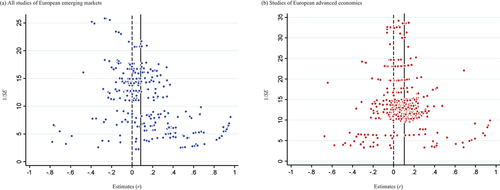
reports the univariate test results on this point. As shown in Column (a) of this table, if we assume that the true effect size of finance on growth is zero in European emerging markets, as illustrated by the dotted line in , then the number of positive to negative estimates among collected estimates would be 223:113, and the null hypothesis that the ratio of positive to negative estimates is equivalent to 1:1 is rejected strongly by the goodness-of-fit test (z= 6.0010, p= .000). On the other hand, if we assume that the synthesis value of the random-effects model in , depicted by the solid line in , approximates the true effect, then the collected estimates would be distributed largely evenly(175:161) on the left and right sides of the value of 0.084; thus, the null hypothesis is not rejected (z= −0.7638, p= .445). With regard to studies of European advanced economies, Column (e) shows results identical to those in Column (a) and, in Columns (b) to (d), similar test results are found in nearly all cases that categorize estimates by target country, estimation period, or study area.
Table 6. Univariate test of publication selection bias
As seen above, the determination of funnel symmetry differs greatly depending on what the true value is assumed to be. Accordingly, we will rely on the methodologically stricter FAT-PET-PEESE procedure for a final judgment. Results using all estimates collected from studies of European emerging markets are shown in . As reported in Panel (a) of the table, in four of the five models, FAT rejected the null hypothesis that the intercept (γ0) is zero, suggesting that publication selection bias in this research domain could be quite high. However, even if publication selection bias is involved, the collected estimates could contain genuine empirical evidence. PET is used to test for this possibility. Panel (a) of shows that the null hypothesis that the coefficient (γ1) of the inverse of the standard error (1/SE) is zero is rejected in four models, and as such the presence of genuine evidence is confirmed. However, the PEESE approach reported in Panel (b) failed to generate a non-zero publication-selection-adjusted effect size in three models. In sum, the results of FAT-PET-PEESE procedure fail to support Hypothesis 1.
Table 7. Meta-regression analysis of publication selection bias in the study of European emerging markets
shows test results for studies of European advanced economies. From this table, we see that publication selection bias is very likely in this research field as well as research on European emerging markets. Due to the presence of strong publication selection bias, the literature does not contain genuine evidence of the growth-enhancing effect of finance in the region as a whole. In fact, although the PEESE method produced a non-zero publication-selection-adjusted effect size in three models in Panel (b), we cannot adopt it because the PET never rejects the null hypothesis in Panel (a).
Table 8. Meta-regression analysis of publication selection bias in the study of European advanced economies
As argued in the fourth section, the FAT-PET-PEESE procedure assumes a linear relationship between publication selection bias and standard errors, which might not be appropriate in the case of this study. For a robustness check, therefore, we carried out alternative estimations of the publication selection bias–corrected effect size using four advanced techniques. The results, reported in , indicate that the selected literature probably contains evidence of the truth effect size both in studies of European emerging markets and advanced economies, if publication selection bias and standard errors are related to each other in a non-linear fashion. Nevertheless, even the statistically significant estimates are very close to zero and, hence, do not significantly override the results obtained from the FAT-PET-PEESE tests in .
Table 9. Alternative estimates of publication selection bias–corrected effect size
Furthermore, we also attempted the FAT-PET-PEESE procedure separately by target country, estimation period, and study area. The results are summarized in , together with those for all studies of European emerging markets and studies of European advanced economies in Columns (a) and (e), respectively. As the table shows, FAT identified publication selection bias in five of the seven cases in Columns (b) to (d). PET suggested the presence of genuine empirical evidence in six cases. However, the PEESE approach generated a non-zero publication-selection-adjusted effect size that is statistically significantly different from zero only in studies with an average estimation year between 2000 and 2003 and studies on financial liberalization. These results are also largely consistent with alternative estimations of publication selection bias–corrected effect size as in .
Table 10. Summary of publication selection bias test
To sum up, this section revealed a high possibility that the empirical findings reported in the selected literature involve publication selection bias, and, as a counter effect, the existing studies are lacking in genuine empirical evidence. For this reason, the test results for publication selection bias could not be used to examine our hypotheses.
Conclusions
Following the collapse of socialism, Central and East European countries devoted considerable policy efforts to the creation of two-tier banking systems and capital markets in order to break away from their previous monobank systems (Iwasaki and Uegaki Citation2017). Their reform outcomes were stunning, even when compared with other emerging markets and developing economies. Faced such great transformations, numerous researchers have focused on the possibility that the development of financial systems in this region could have significantly impacted economic growth, examining this issue empirically from a wide range of perspectives and methods. In this paper, we performed a meta-analysis of the extant literature to identify the true effect size of financial development and liberalization on economic growth in European emerging markets and tested a series of hypotheses related to possible variation in the effect size of finance on growth between different target countries, estimation periods, and study areas. From this perspective, we also compared the research outcomes of European emerging markets with those of European advanced economies.
Meta-synthesis of 893 estimates collected from 45 selected studies conformed to Hypothesis 1, suggesting that financial development and liberalization are highly likely to have a positive impact on economic growth in European emerging markets. The synthesis results also supported Hypothesis 2, which posits that the financial impact on promoting growth in new EU member states would be larger in size than in non-EU member states in Eastern Europe and the former Soviet states; Hypothesis 3, which predicts that the growth-enhancing effect of finance would diminish over time; Hypothesis 4, which supposes that financial development would have a greater impact on economic growth than would financial liberalization; and Hypothesis 5, which postulates that the finance-growth nexus in European emerging markets would be weaker than in European advanced economies.
The following MRA, however, revealed that the results of meta-synthesis concerning Hypotheses 4 and 5 could not be reproduced when controlling for various types of heterogeneity arising in research conditions and quality of the collected studies. Furthermore, test results for publication selection bias showed a very high risk of publication selection bias in this research domain. For this reason, the results of the selected studies were determined to be lacking in genuine empirical evidence regarding the financial effects on economic growth in both European emerging markets and advanced economies; thus, it was not possible to verify our hypotheses.
The results of meta-analysis in this paper, summarized above, show that insufficient research findings have been accumulated to ascertain the true nature of the finance–growth nexus in Europe. For this reason, as implied by the low median statistical power of collected estimates shown in Column (C) of , further research is needed to develop empirical results with higher precision. Thus, it is hoped that European financial research will advance further with regard to both emerging markets and advanced economies.
Acknowledgements
We are grateful to Christopher Hartwell (editor-in-chief) and two anonymous reviewers of the journal for their helpful comments and suggestions. We also thank Michie Kano and Eriko Yoshida for their research assistance and Tammy Bicket for her editorial assistance. Finally, we wish to express our deepest respect to the authors of the literature subject to the meta-analysis in this paper. The usual disclaimer applies.
Disclosure Statement
No potential conflict of interest was reported by the authors.
Additional information
Funding
Notes
1. The Decree of the CPSU Central Committee and the USSR Ministerial Council of July 17, 1987, on improving the country’s banking system and strengthening their impact on enhancing the effectiveness of the economy, No. 821.
2. The Act of the USSR of May 26, 1988, on cooperatives in the USSR, No. 8998-XI; the Decree of the USSR Ministerial Council of September 1, 1988, on the approval of the statute of the Gosbank of the USSR, No. 1061.
3. The Decree of the USSR Ministerial Council of March 31, 1989, on the transition of specialized banks of the USSR to be fully self-supporting and self-financing, No. 280.
5. While Miksjuk, Ouliaris, and Pranovich (Citation2015) referred to this as “state program lending,” here we will use the more commonly used term directed lending. Directed lending refers to lending provided through banks to specific state-owned enterprises under advantageous terms, as directed by the government or financial authorities.
6. Individual investment amounts totaled USD 1 billion (EBRD Citation1998).
7. Soft budget constraints are a concept proposed by Kornai (Citation1979, Citation1980, Citation1986) as characteristic of lax fiscal discipline on state-owned firms in a planned economy. Budget constraints soften when fiscal support from external sources (particularly the national government) can be expected with a high probability, and these expectations for fiscal support are strongly reflected in actions.
8. Schnabel and Seckinger (Citation2019) claim that the presence of foreign banks has a substantial positive effect on industry growth differentials. This implies that bank lending under financial liberalization contributed to economic growth.
9. According to the International Monetary Fund (IMF) (Citation2009), the share of lending denominated in foreign currency was 89.3% in Latvia, 85.3% in Estonia, 66.9% in Bulgaria, and 65.7% in Hungary.
10. The following academic press websites were used in this literature search: Emerald insight, Oxford University Press, Sage Journals, Science Direct, Springer Link, Taylor and Francis Online, and Wiley Online Library. The search of academic press websites was conducted for the most recent studies, published since January 2020, to supplement the results of the EconLit search. The final search of literature was conducted in June 2021.
11. Studies that mix advanced economies and emerging markets in empirical analysis, such as Prochniak and Wasiak (Citation2017) and Agiropoulos et al. (Citation2020), were not included in the meta-analysis because they do not fit with testing the series of hypotheses described in the previous section.
12. In addition to the traditional meta-synthesis method using fixed-effect and random-effects models, we also utilized the unrestricted weighted least squares weighted average (UWA) method proposed by Stanley and Stanley and Doucouliagos (Citation2017) and Stanley and Doucouliagos (Citation2017) as a new synthesis approach. They argued that, as compared to the fixed-effect and random-effects models, the UWA is less influenced by publication selection bias. Furthermore, Stanley and Doucouliagos (Citation2017) proposed conducting a UWA of estimates whose statistical power exceeds the threshold of 0.8 and called this estimation method the weighted average of the adequately powered (WAAP). The WAAP estimate is more robust against publication selection bias than the other two conventional estimators. However, as the low median statistical powers reported in Column (C) of indicate, due to a lack of adequately powered estimates in the selected literature, we could not perform a WAAP synthesis.
13. As the evaluation criteria of the correlation coefficient, Doucouliagos (Citation2011) proposed 0.104, 0.226, and 0.386 to be the lowest thresholds of small, medium, and large effects, respectively, as the new general standard in macroeconomic research (ibid., Table 3, p. 11).
14. The results of BMA estimations and OLS frequentist checks for studies of emerging markets and all studies are reported in Panels (a) and (b) of Appendix Table A2, respectively.
References
- Agiropoulos, C., M. L. Polemis, M. Siopsis, and S. Karkalakos. 2020. ”Revisiting the finance-growth nexus: A socioeconomic approach.” International Journal of Finance and Economics. ( Early View)
- Aivazian, S., I. Andrievskaia, R. Konnoli, and G. I. Penikas. 2011. ”The influence of systemically significant financial institutions: An overview of methodologies.” Money and Credit 8: 13–18. (in Russian)
- Akimov, A., A. Wijeweera, and B. Dollery. 2009. “Financial Development and Economic Growth: Evidence from Transition Economies.” Applied Financial Economics 19 (12): 999–1008. doi:https://doi.org/10.1080/09603100701857880
- Andrews, I., and M. Kasy. 2019. “Identification of and Correction for Publication Bias.” American Economic Review 109 (8): 2766–94. doi:https://doi.org/10.1257/aer.20180310
- Asteriou, D., and K. Spanos. 2019. “The Relationship between Financial Development and Economic Growth during the Recent Crisis: Evidence from the EU.” Finance Research Letters 28:238–45. doi: https://doi.org/10.1016/j.frl.2018.05.011.
- Bajzik, J., T. Havranek, Z. Irsova, and J. Schwarz. 2020. “Estimating the Armington Elasticity: The Importance of Study Design and Publication Bias.” Journal of International Economics 127( Article): 103383. doi:https://doi.org/10.1016/j.jinteco.2020.103383.
- Bank of Albania. 2000. Annual Report 1999. Tirana: Bank of Albania.
- Bank of Albania. 2001. Annual Report 2000. Tirana: Bank of Albania.
- Bank of Albania. 2002. Annual Report 2001. Tirana: Bank of Albania.
- Bank of Estonia. 2004. Annual Report 2003. Tallinn: Bank of Estonia.
- Barisitz, S. 2007a. “Banking in Belarus: On a Trajectory of its Own.” Financial Stability Report (Austrian Central Bank). 14: 85–103.
- Barisitz, S. 2007b. Banking in Central and Eastern Europe 1980–2006: From Communism to Capitalism. Routledge. London, New York: Routledge.
- Barnard, G. 2009. “Russia’s Long and Winding Road to a More Efficient and Resilient Banking Sector.” OECD Economics Department Working Papers No. 731. Paris: Organisation for Economic Co-operation and Development.
- Beck, T., L. Ross, and L. Norman. 2000. “Finance and the Sources of Growth.” Journal of Financial Economics 58 (1–2): 261–300. doi:https://doi.org/10.1016/S0304-405X(00)00072-6
- Benczúr, P., S. Karagiannis, and V. Kvedaras. 2019. “Finance and Economic Growth: Financing Structure and Non-linear Impact.” Journal of Macroeconomics 62( Article): 103048. doi:https://doi.org/10.1016/j.jmacro.2018.08.001.
- Bezemer, D. J. 2001. “Post-socialist Financial Fragility: The Case of Albania.” Cambridge Journal of Economics 25 (1): 1–23. doi:https://doi.org/10.1093/cje/25.1.1
- Bom, P. R. D., and H. Rachinger. 2019. “A Kinked Meta-regression Model for Publication Bias Correction.” Research Synthesis Methods 10 (4): 497–514. doi:https://doi.org/10.1002/jrsm.1352
- Bouzid, A. 2013. “Governance, Financial Liberalization and Economic Growth: Dynamic Panel Data Approach.” Romanian Economic and Business Review 8 (2): 59–74.
- Bussière, M., and M. Fratzscher. 2008. “Financial Openness and Growth: Short-Run Gain, Long-run Pain?” Review of International Economics 16 (1): 69–95. doi:https://doi.org/10.1111/j.1467-9396.2007.00727.x
- Capolupo, R. 2018. “Finance, Investment and Growth: Evidence for Italy.” Economic Notes 47 (1): 145–85. doi:https://doi.org/10.1111/ecno.12097
- Caporale, G. M., C. Rault, A. D. Sova, and R. Sova. 2015. “Financial Development and Economic Growth: Evidence from 10 New European Union Members.” International Journal of Finance and Economics 20 (1): 48–60. doi:https://doi.org/10.1002/ijfe.1498
- Cazachevici, A., T. Havranek, and R. Horvath. 2020. “Remittances and Economic Growth: A Meta-analysis.” World Development 134( Article): 105021. doi:https://doi.org/10.1016/j.worlddev.2020.105021.
- Cojocaru, L., E. M. Falaris, S. D. Hoffman, and J. B. Miller. 2016. “Financial System Development and Economic Growth in Transition Economies: New Empirical Evidence from the CEE and CIS Countries.” Emerging Markets Finance & Trade 52 (1): 223–36. doi:https://doi.org/10.1080/1540496X.2015.1013828
- Cojocaru, L., S. D. Hoffman, and J. B. Miller: Financial Development and Economic Growth in Transition Economies: Empirical Evidence from the CEE and CIS Countries. Working Paper No. 2011-22. Alfred Lerner College of Business and Economics, University of Delaware, Newark (2011)
- Dawson, P. J. 2003. “Financial Development and Growth in Economies in Transition.” Applied Economics Letters 10 (13): 833–36. doi:https://doi.org/10.1080/1350485032000154243
- Djalilov, K., and J. Piesse. 2011. “Financial Development and Growth in Transition Countries: A Study of Central Asia.” Emerging Markets Finance & Trade 47 (6): 4–23. doi:https://doi.org/10.2753/REE1540-496X470601
- Doucouliagos, H. 2011. “How Large is Large? Preliminary and Relative Guidelines for Interpreting Partial Correlations in Economics.” School Working Paper No. SWP 2011/5. Melbourne: School of Accounting, Economics and Finance, Faculty of Business and Law, Deakin University.
- Dudian, M., and R. A. Popa. 2013. “Financial Development and Economic Growth in Central and Eastern Europe.” Theoretical and Applied Economics 20 (8): 59–68.
- European Bank for Reconstruction and Development (EBRD). 1996. Transition Report 1996. London: European Bank for Reconstruction and Development.
- European Bank for Reconstruction and Development (EBRD). 1997. Transition Report 1997. London: European Bank for Reconstruction and Development.
- European Bank for Reconstruction and Development (EBRD). 1998. Transition Report 1998. London: European Bank for Reconstruction and Development.
- European Bank for Reconstruction and Development (EBRD). 1999. Transition Report 1999. London: European Bank for Reconstruction and Development.
- European Bank for Reconstruction and Development (EBRD). 2000. Transition Report 2000. London: European Bank for Reconstruction and Development.
- European Bank for Reconstruction and Development (EBRD). 2001. Transition Report 2001. London: European Bank for Reconstruction and Development.
- European Bank for Reconstruction and Development (EBRD). 2002. Transition Report 2002. London: European Bank for Reconstruction and Development.
- European Bank for Reconstruction and Development (EBRD). 2003. Transition Report 2003. London: European Bank for Reconstruction and Development.
- European Bank for Reconstruction and Development (EBRD). 2004. Transition Report 2004. London: European Bank for Reconstruction and Development.
- European Bank for Reconstruction and Development (EBRD). 2006. Transition Report 2006. London: European Bank for Reconstruction and Development.
- European Bank for Reconstruction and Development (EBRD). 2007. Transition Report 2007. London: European Bank for Reconstruction and Development.
- European Bank for Reconstruction and Development (EBRD). 2008. Transition Report 2008. London: European Bank for Reconstruction and Development.
- European Bank for Reconstruction and Development (EBRD). 2012. Transition Report 2012. London: European Bank for Reconstruction and Development.
- Fetai, B. T. 2018. “Does Financial Development Accelerate Economic Growth?” Journal of Financial Economic Policy 10 (3): 426–35. doi:https://doi.org/10.1108/JFEP-11-2017-0118
- Fink, G., P. Haiss, and G. Vukšić. 2005a. Importance of Financial Sectors for Growth in Accession Countries. Paper presented at the European Finance Association Annual Meeting, Moscow.
- Fink, G., P. Haiss, and G. Vuksic. 2006. “Importance of Financial Sectors for Growth in Accession Countries.” In Financial Development, Integration and Stability: Evidence from Central, Eastern and South-Eastern Europe, edited by K. Liebscher, J. Christl, P. Mooslechner, and D. Ritzberger-Grünwald, 154–85. Edward Elgar, Cheltenham and Northampton.
- Fink, G., P. Haiss, and G. Vukšić. 2009. “Contribution of Financial Market Segments at Different Stages of Development: Transition, Cohesion and Mature Economies Compared.” Journal of Financial Stability 5 (4): 431–55. doi:https://doi.org/10.1016/j.jfs.2008.05.002
- Fink, G., P. R. Haiss, and H. C. Mantler. 2005b. The Finance-Growth Nexus: Market Economies Vs. Transition Countries. EI Working Paper No. 64, Vienna University of Economics and Business, Vienna.
- Fleming, A., L. Chu, and M-R. Bakker. 1996. The Baltics: Banking Crises Observed. The World Bank Policy Research Working Paper. No. 1647. The World Bank, Washington DC.
- Fries, D., and A. Taci. 2001. “Banking Transition: A Comparative Analysis.” In Financial Transition in Europe and Central Asia: Challenges of the New Decade, edited by L. Bokros, A. Fleming, and C. Votava, 173–88. Washington DC: The World Bank.
- Gaffeo, E., and P. Garalova. 2014. “On the Finance-growth Nexus: Additional Evidence from Central and Eastern Europe Countries.” Economic Change and Restructuring 47 (2): 89–115. doi:https://doi.org/10.1007/s10644-013-9143-x
- Gehringer, A. 2013. “Growth, Productivity and Capital Accumulation: The Effects of Financial Liberalization in the Case of European Integration.” International Review of Economics and Finance 25:291–309. doi: https://doi.org/10.1016/j.iref.2012.07.015.
- Georgantopoulos, A. G., A. D. Tsamis, and M-E. K. Agoraki. 2015. “The Euro-adoption Effect and the Bank, Market, and Growth Nexus: New Evidence from EU Panels.” Journal of Economic Asymmetries 12 (1): 41–51. doi:https://doi.org/10.1016/j.jeca.2015.01.002
- Giritli, N., and D. B. Kalmaz.Re-examining the Impact of Financial Development on the Economic Growth of North Cyprus through the Moderating Role of the Education Sector.Journal of Public Affairs (Early View).2020.https://doi.org/10.1002/pa.2517
- Goldsmith, R. W. 1969. Financial Structure and Development. New Haven: Yale University Press.
- Gurley, J. G., and E. S. Shaw. 1955. “Financial Aspects of Economic Development.” American Economic Review 45 (4): 515–38.
- Hasan, I., and K. Marton. 2003. “Development and Efficiency of the Banking Sector in a Transitional Economy: Hungarian Experience.” Journal of Banking and Finance 27 (12): 2249–71. doi:https://doi.org/10.1016/S0378-4266(02)00328-X
- Hasan, I., M. Koetter, and M. Wedow. 2009. “Regional Growth and Finance in Europe: Is There a Quality Effect of Bank Efficiency?” Journal of Banking & Finance 33 (8): 1446–53. doi:https://doi.org/10.1016/j.jbankfin.2009.02.018
- Havranek, T., and A. Sokolova. 2020. “Do Consumers Really Follow a Rule of Thumb? Three Thousand Estimates from 144 Studies Say “Probably Not.” Review of Economic Dynamics 35:97–122. doi: https://doi.org/10.1016/j.red.2019.05.004.
- Hicks, J. R. 1969. A Theory of Economic History. Oxford: Oxford University Press.
- International Monetary Fund (IMF).2009. Global Financial Stability Report.April. Washington DC: International Monetary Fund.
- International Monetary Fund (IMF). 2019. Republic of Belarus: 2018 Article IV Consultation-Press Release; Staff Report; and Statement by the Executive Director for Republic of Belarus, IMF Country Report No. 19/9. Washington DC: International Monetary Fund.
- Iwasaki, I., X. Ma, and S. Mizobata. 2020. “Corporate Ownership and Managerial Turnover in China and Eastern Europe: A Comparative Meta-analysis.” Journal of Economics and Business 111( Article): 105928. doi:https://doi.org/10.1016/j.jeconbus.2020.105928.
- Iwasaki, I, and A. Uegaki. 2017. “Central Bank Independence and Inflation in Transition Economies: A Comparative Meta-analysis with Developed and Developing Economies.” Eastern European Economics 55 (3): 197–235. doi:https://doi.org/10.1080/00128775.2017.1287548
- Jimborean, R., and A. Kelber. 2017. “Foreign Direct Investment Drivers and Growth in Central and Eastern Europe in the Aftermath of the 2007 Global Financial Crisis.” Comparative Economic Studies 59 (1): 23–54. doi:https://doi.org/10.1057/s41294-016-0018-9
- Johnson, J. 2000. A Fistful of Rubles: The Rise and Fall of the Russian Banking System. Ithaca, NY: Cornell University Press.
- Koetter, M., and M. Wedow. 2010. “Finance and Growth in a Bank-based Economy: Is It Quantity or Quality that Matters?” Journal of International Money and Finance 29 (8): 1529–45. doi:https://doi.org/10.1016/j.jimonfin.2010.05.015
- Koivu, T.2002. Do Efficient Banking Sectors Accelerate Economic Growth in Transition Countries? BOFIT Discussion Paper No. 14. Bank of Finland Institute for Economies in Transition, Helsinki.
- Kornai, J. 1979. “Resource-constrained versus Demand-constrained Systems.” Econometrica 47 (4): 801–19. doi:https://doi.org/10.2307/1914132
- Kornai, J. 1980. Economics of Shortage. Amsterdam: North-Holland.
- Kornai, J. 1986. “The Soft Budget Constraint.” Kyklos 39 (1): 3–30. doi:https://doi.org/10.1111/j.1467-6435.1986.tb01252.x
- Lee, C-C., and C-P. Chang. 2009. “FDI, Financial Development, and Economic Growth: International Evidence.” Journal of Applied Economics 12 (2): 249–71. doi:https://doi.org/10.1016/S1514-0326(09)60015-5
- Levine, R., N. Loayza, and T. Beck. 2000. “Financial Intermediation and Growth: Causality and Causes.” Journal of Monetary Economics 46 (1): 31–77. doi:https://doi.org/10.1016/S0304-3932(00)00017-9
- Masten, A. B., F. Coricelli, and I. Masten. 2008. “Non-linear Growth Effects of Financial Development: Does Financial Integration Matter?” Journal of International Money and Finance 27 (2): 295–313.
- McKinnon, R. I. 1973. Money and Capital in Economic Development. Washington DC: Brookings Institution.
- Mehl, A., and A. Winkler. 2003. The Finance-Growth Nexus and Financial Sector Environment: New Evidence from Southeast Europe. Paper presented at the Ninth Dubrovnik Economic Conference on Banking and the Financial Sector in Transition and Emerging Market Economies. Hotel Argentina, Dubrovnik, June.
- Mehl, A., C. Vespro, and A. Winkler. 2005. The Finance-Growth Nexus and Financial Sector Environment: New Evidence from Southeast Europe, mimeo.
- Mehl, A., C. Vespro, and A. Winkler. 2006. “Financial Sector Development in South-Eastern Europe: Quality Matters.” In Financial Development, Integration and Stability: Evidence from Central, Eastern and South-Eastern Europe, edited by K. Liebscher, J. Christl, P. Mooslechner, and D. Ritzberger-Grünwald, 186–203. Edward Elgar, Cheltenham and Northampton.
- Miksjuk, A., S. Ouliaris, and M. Pranovich. 2015. The Game of Anchors: Studying the Causes of Currency Crises in Belarus. IMF Working Paper WP/15/281. Washington DC: International Monetary Fund.
- Mtar, K., and W. Belazreg.On the Nexus of Innovation, Trade Openness, Financial Development and Economic Growth in European Countries: New Perspective from a GMM Panel VAR Approach.International Journal of Finance & Economics (Early View).2021.https://doi.org/10.1002/ijfe.2449
- Musta, E. 2016. “Financial Development Influence on Economic Growth in Albania.” European Journal of Economics and Business Studies 2 (2): 59–65. doi:https://doi.org/10.26417/ejes.v5i1.p59-65
- Narayan, P. K., and S. Narayan. 2013. “The Short-run Relationship between the Financial System and Economic Growth: New Evidence from Regional Panels.” International Review of Financial Analysis 29:70–78. doi: https://doi.org/10.1016/j.irfa.2013.03.012.
- National Bank of Hungary. 2002. Annual Report: Business Report and Financial Statements of the National Bank of Hungary for 2001. Budapest: National Bank of Hungary.
- Ono, S. 2012. “Financial Development and Economic Growth: Evidence from Russia.” Europe-Asia Studies 64 (2): 247–56. doi:https://doi.org/10.1080/09668136.2012.635484
- Organisation for Economic Co-operation and Development (OECD). 2000. OECD Economic Surveys: Russian Federation, Paris: OECD Publishing.
- Özdemir, D. 2014. “Economic Growth and Financial Liberalization in the EU Accession Countries.” Applied Economics Letters 21 (15): 1036–44. doi:https://doi.org/10.1080/13504851.2014.907470
- Padoan, P., and F. Mariani. 2006. “Growth and Finance, European Integration and the Lisbon Strategy.” Journal of Common Market Studies 44 (1): 77–112. doi:https://doi.org/10.1111/j.1468-5965.2006.00615.x
- Petkovski, M., and J. Kjosevski. 2014. “Does Banking Sector Development Promote Economic Growth? an Empirical Analysis for Selected Countries in Central and South Eastern Europe.” Economic Research-Ekonomska Istraživanja 27 (1): 55–66. doi:https://doi.org/10.1080/1331677X.2014.947107
- Polák, P. 2019. “The Euro’s Trade Effect: A Meta-analysis.” Journal of Economic Surveys 33 (1): 101–24. doi:https://doi.org/10.1111/joes.12264
- Prochniak, M., and K. Wasiak. 2017. “The Impact of the Financial System on Economic Growth in the Context of the Global Crisis: Empirical Evidence for the EU and OECD Countries.” Empirica 44 (2): 295–337. doi:https://doi.org/10.1007/s10663-016-9323-9
- Radjenovic, T., and B. Rakic. 2017. “Interdependence between Level of Financial System Development and Economic Growth in Serbia.” Journal of Balkan and near Eastern Studies 19 (6): 645–65. doi:https://doi.org/10.1080/19448953.2017.1328896
- Rama, A. 2018. “Investigating the Nexus between Financial Development and Economic Growth in SEE 10 Economies.” European Journal of Marketing and Economics 1 (1): 67–83. doi:https://doi.org/10.26417/ejme.v1i1.p67-83
- Rehman, N., and E. Hysa. 2021. “The Effect of Financial Development and Remittances on Economic Growth.” Cogent Economics & Finance 9(1): Article. 1932060. doi:https://doi.org/10.1080/23322039.2021.1932060.
- Robinson, J. 1952. “The Generalisation of the General Theory.” In The Rate of Interest, and Other Essays, edited by J. Robinson, 67–142. London: Macmillan.
- Romero-Ávila, D. 2009. “Liberalization of Capital Controls and Interest Rates Restrictions in the EU-15: Did It Affect Economic Growth?” Applied Financial Economics 19 (20): 1625–48. doi:https://doi.org/10.1080/09603100802599571
- Schmieding, H. 1993. “From Plan to Market: On the Nature of the Transformation Crisis.” Weltwirtschaftliches Archiv 129 (2): 216–53. doi:https://doi.org/10.1007/BF02707696
- Schnabel, I., and C. Seckinger. 2019. “Foreign Banks, Financial Crises and Economic Growth in Europe.” Journal of International Money and Finance 95:70–94. doi: https://doi.org/10.1016/j.jimonfin.2019.02.004.
- Schumpeter, J. A. 1911. The Theory of Economic Development. Cambridge: Harvard University Press.
- Shaw, E. S. 1973. Financial Deepening inEconomic Development. New York: Oxford University Press.
- Stanley, T. D., and H. Doucouliagos. 2012. Meta-Regression Analysis in Economics and Business. London and New York: Routledge.
- Stanley, T. D., and H. Doucouliagos. 2017. “Neither Fixed nor Random: Weighted Least Squares Meta-regression.” Research Synthesis Method 8 (1): 19–42. doi:https://doi.org/10.1002/jrsm.1211
- Stanley, T. D., S. B. Jarrell, and H. Doucouliagos. 2010. “Could It Be Better to Discard 90% of the Data? A Statistical Paradox.” The American Statistician 64:70–77. doi: https://doi.org/10.1198/tast.2009.08205.
- Stiglitz, J. E. 2000. “Capital Market Liberalization, Economic Growth, and Instability.” World Development 28:1075–86. doi: https://doi.org/10.1016/S0305-750X(00)00006-1.
- Thimann, C., ed. 2002. Financial Sectors in EU Accession Countries. Frankfurt: European Central Bank.
- Valverde, S. C., R. L. Del Paso, and F. R. Fernández. 2007. “Financial Innovations in Banking: Impact on Regional Growth.” Regional Studies 41 (3): 311–26. doi:https://doi.org/10.1080/00343400600928350
- van Aert, R.C., and M. van Assen. 2021. Correcting for Publication Bias in a Meta-Analysis with the P-uniform Method, Working paper, Tilburg University and Utrecht University.
- Van Wijnbergen, S. 1983. “Interest Rate Management in LDCs.” Journal of Monetary Economics 12 (3): 433–52. doi:https://doi.org/10.1016/0304-3932(83)90063-6
- Vaona, A., and R. Patuelli. 2008. “New Empirical Evidence on Local Financial Development and Growth.” Letters in Spatial and Resource Sciences 1 (2–3): 147–57. doi:https://doi.org/10.1007/s12076-008-0014-4
- Wu, J-L., H. Hou, and S-Y. Cheng. 2010. “The Dynamic Impacts of Financial Institutions on Economic Growth: Evidence from the European Union.” Journal of Macroeconomics 32 (3): 879–91.
- Yaroson, E. 2015. “Finance and Growth in Transition Economies: What Does Bootstrapping Tell Us.” American Journal of Economics 5 (6): 553–64.
- Zagorchev, A., G. Vasconcellos, and Y. Bae. 2011. “Financial Development, Technology, Growth and Performance: Evidence from the Accession to the EU. Journal of International Financial Markets.” Institutions and Money 21 (5): 743–59. doi:https://doi.org/10.1016/j.intfin.2011.05.005
- Zeqiraj, V., F. Mrasori, O. Iskenderoglu, and K. Sohag. 2021. “Dynamic Impact of Banking Performance on Financial Stability: Fresh Evidence from Southeastern Europe.” Journal of Central Banking Theory and Practice 10 (1): 165–81. doi:https://doi.org/10.2478/jcbtp-2021-0008
- Zeqiraj, V., S. Hammoudeh, O. Iskenderoglu, and A. K. Tiwari. 2020. “Banking Sector Performance and Economic Growth: Evidence from Southeast European Countries.” Post-Communist Economies 32 (2): 267–84. doi:https://doi.org/10.1080/14631377.2019.1640988
- Zigraiova, D., T. Havranek, Z. Irsova, and J. Novak. 2021. “How Puzzling Is the Forward Premium Puzzle?” A Meta-analysis. European Economic Review 134( Article): 103714. doi:https://doi.org/10.1016/j.euroecorev.2021.103714.
APPENDIX
METHOD FOR EVALUATING THE QUALITY LEVEL OF A STUDY
This appendix describes the evaluation method used to determine the quality level of the studies subjected to our meta-analysis.
For journal articles, we used the ranking of economics journals published as of February 1, 2018, by IDEAS – the largest bibliographic database dedicated to economics and available freely on the Internet (http://ideas.repec.org/)—as the most basic information source for our evaluation of quality level. IDEAS provides the world’s most comprehensive ranking of economics journals; as of February 2018, 2159 academic journals were ranked.
We divided these 2159 journals into 20 clusters, using a cluster analysis based on overall evaluation scores. We then assigned each journal cluster a score (weight) from 1 (the lowest journal cluster) to 20 (the highest).
For academic journals that are not ranked by IDEAS, we referred to the Thomson Reuters Impact Factor and other journal rankings and identified the same level of IDEAS ranking–listed journals that correspond to these non-listed journals. We have assigned each of them the same score as its counterpart.
For academic books and book chapters, we assigned a score of 1 in principle; however, if at least one of the following conditions was met, each of the relevant books or chapters uniformly received a score of 10, which is the median value of the scores assigned to the above-mentioned IDEAS ranking–listed economics journals: (1) the academic book or book chapter clearly states that it has gone through a peer review process; (2) its publisher is a leading academic publisher that has external evaluations carried out by experts; or (3) the research level of the study has been evaluated by the authors to be obviously high.
Table A1. List of selected studies on the finance-growth nexus in Europe for meta-analysis
Table A2. Meta-regression analysis of model uncertainty for selection of moderators