
 ?Mathematical formulae have been encoded as MathML and are displayed in this HTML version using MathJax in order to improve their display. Uncheck the box to turn MathJax off. This feature requires Javascript. Click on a formula to zoom.
Abstract
This laboratory study examined human stair ascending capacity and constraining factors including legs’ local muscle fatigue (LMF) and cardiorespiratory capacity. Twenty-five healthy volunteers, with mean age 35.3 years, maximal oxygen uptake (VO2max) of 46.7 mL·min−1·kg−1 and maximal heart rate (HR) of 190 bpm, ascended on a stair machine at 60 and 75% (3 min each) and 90% of VO2max (5 min or until exhaustion). The VO2, maximal heart rate (HRmax) and electromyography (EMG) of the leg muscles were measured. The average VO2highest reached 43.9 mL·min−1·kg−1, and HRhighest peaked at 185 bpm at 90% of VO2max step rate (SR). EMG amplitudes significantly increased at all three levels, p < .05, and median frequencies decreased mostly at 90% of VO2max SR evidencing leg LMF. Muscle activity interpretation squares were developed and effectively used to observe changes over time, confirming LMF. The combined effects of LMF and cardiorespiratory constraints reduced ascending tolerance and constrained the duration to 4.32 min.
Practitioner Summary: To expedite ascending evacuation from high-rise buildings and deep underground structures, it is necessary to consider human physical load. This study investigated the limiting physiological factors and muscle activity rate changes (MARC) used in the muscle activity interpretation squares (MAIS) to evaluate leg local muscle fatigue (LMF). LMF and cardiorespiratory capacity significantly constrain human stair ascending capacities at high, constant step rates.
1. Introduction
Stair ascension is a physically challenging activity requiring both cardiorespiratory endurance and leg muscle power (Macdonald et al. Citation2007). Serious concerns in evacuation research include the physiological limitations, maximum capacities and durations in climbing stairs. Nonstop prolonged ascending can be required in an emergency evacuation to reach a safe refuge level from deep underground structures, such as subways and in high-rise buildings (Lam et al. Citation2014; Ronchi et al. Citation2015; Delin et al. Citation2016). From both the performance and evacuation perspectives, it is impossible for a person to continue ascending with the same maximum speed for a long duration. Emergency stair ascent requires strong repetitive leg muscle activity to carry the entire body weight. Generally, cardiorespiratory constraints limit human physiological performance. However, the effects of local muscle fatigue (LMF) due to a repetitive activity can further reduce the ascending capacity before the cardiorespiratory capacity limits are reached (Cheng and Rice Citation2013).
Several field and laboratory studies have assessed ascending capacity by measuring heart rate (HR) and blood pressure and oxygen uptake (VO2) and have estimated energy costs in preferred and prescribed speeds on different stair machines (O'Connell et al. Citation1986; Butts, Dodge, and McAlpine Citation1993; Bassett et al. Citation1997; Teh and Aziz Citation2002; Lam et al. Citation2014). On a step mill, the relative VO2 values observed were 26, 32, 38 and 46 mL·min−1·kg−1 during ascending for 5 min at 60, 77, 95 and 112 steps·min−1, respectively (Butts, Dodge, and McAlpine Citation1993). Another study used gradual increments of step rates (SRs) every 2 min on a step ergometer and obtained a lower VO2max than when running on a treadmill, suggesting a contribution of leg LMF (Ben-Ezra and Verstraete Citation1988). The onset of fatigue may have constrained the capacity and kept the VO2 lower than the subjects’ maximal levels, indicating another possible performance constraining factor.
Electromyography (EMG) studies have reported that muscle activity while ascending was significantly higher than descending as the calf muscles worked proportionately at a higher level than the shin muscles during ascension on regular stairs. (Eteraf Oskouei et al. Citation2014). One study on an inclined treadmill demonstrated that greater ankle and knee extensor activity was required for propulsion during a double-step stance phase compared to a single-step (Gottschall, Aghazarian, and Rohrbach Citation2010). Scheuermann, Tripse McConnell, and Barstow (Citation2002) showed that both EMG and VO2 measurements were used to observe physiological responses during cycling where the EMG median frequency (MDF) decreased during fast ramp cycling (64 W·min−1), while it remained relatively constant at slow ramp cycling (8 W·min−1) at the same pedaling cadence of 70 cycles per minute. The increase in amplitude (AMP) was related to the work rate increase. Another study showed the level of muscle fatigue using the ratio of muscle maximum voluntary contraction (MVC) to AMP at the beginning and end of repetitive work (Oksa, Ducharme, and Rintamaki Citation2002). However, the observation of muscle activity, including the development of fatigue over time during stair ascending evacuation at high intensity exercise, was not studied.
Therefore, the laboratory study presented in this article aimed to observe changes in both the AMP and MDF over time in order to evaluate the development of muscle fatigue during constant pace ascents on a stair machine. This was accomplished based on the muscle activity rate changes (MARC) presented in the muscle activity interpretation squares (MAIS) (Halder et al. Citation2018), which in turn are based on Cifrek et al.’s (Citation2009) four possible assumptions of muscle activity during any kind of work. Running and cycling physiological responses have been examined using both EMG and VO2, but there is a lack of research on leg muscle fatigue in prolonged stair ascension. The measurements of leg muscle EMG and VO2 presented here are a complementary and novel approach to better observe and assess fatigue that can constrain human ascending capacity during an evacuation. Thus, the overall aim of the laboratory study was to explore stair ascending physiological limitations and capacity by measuring VO2, HR and leg muscle EMG during ascending on a stair machine. Specifically, the study investigated the extent to which the effects of LMF and VO2 constrain human ascending endurance during simulated urgent evacuation at 90% of VO2max SR.
2. Methods
2.1. Subjects
The noninvasive methods and procedures used in this study comply with the Declaration of Helsinki. The study was approved by the Regional Ethics Board in Lund, Sweden (Dnr 2014/54). The subjects, representing a varied population with regards to age, gender and body build, were recruited through announcements in the social media. To determine their eligibility, the subjects completed a questionnaire that covered basic information including history of disease and disabilities and medications. Twenty-five healthy subjects without any musculoskeletal problems were selected for the study. They received both verbal information and written information about the test procedures during the recruiting period and before the tests. presents the subjects’ anthropometrics, gender and VO2max data with mean and standard deviation (SD).
Table 1. Anthropometric, gender and maximum aerobic capacity (VO2max) data of the total number of subjects (N = 25) and for the males (N = 13) and females (N = 12) separately with mean (SD).
The subjects were asked to abstain from any vigorous exercise or sporting activity prior to the tests. They were tested in the laboratory on two occasions, and a separate informed consent was obtained for each test. On the first occasion, a brief description of the necessary safety information, test procedures and apparatus was repeated both orally and in writing. They then performed a maximal aerobic capacity test on a treadmill to determine their individual maximal oxygen uptake (VO2max). On the second visit, after a recovery period of at least 24 h, the subjects performed the ascension test on the stair machine. They were given the opportunity to practice walking on the treadmill or climbing on the stair machine before the tests. Two researchers were available nearby at all times for safety purposes.
2.2. Maximal aerobic capacity test
In order to determine each subject’s VO2max, maximal aerobic capacity tests were carried out on a treadmill (Exercise™, x-track elite, Sweden). The subjects started with a 5-min rest followed by walking at 4 km·h−1 for 3 min and then running at 8 km·h−1 for 2 min. The speed was further increased every 2 min until the subject reached a comfortable pace and then continued running while the inclination was increased by 3% every 2 min until exhaustion was reached (ACSM Citation2010). The highest VO2 in mL·min−1·kg−1 and HR values obtained during the VO2max test period were designated as the individual’s VO2max and HRmax, respectively.
2.3. Stair ascending test
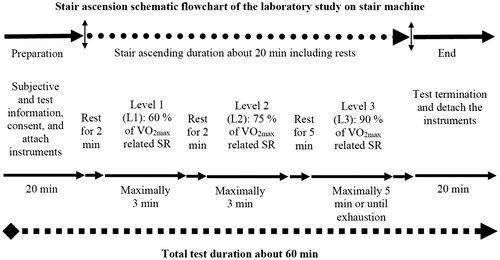
Subjects performed an ascending task on a stair machine (StairMaster, SM5; StairMaster, Vancouver, WA, USA) () with a step height of 20.5 cm and a depth of 25.0 cm. The StairMaster was selected for the task because it resembles ascending a long escalator (Arias et al. Citation2016). The subjects were allowed to hold onto the handrails during ascent. Individual subject’s ascending SRs were determined at three levels based on their relative VO2max values in mL·min−1·kg−1: a VO2max of 60% for Level 1 (L1), 75% for Level 2 (L2) and 90% for Level 3 (L3) (Kuklane and Halder Citation2016). The subjects performed the ascent at each level and were allowed to rest between levels for 2 or 5 min following the test protocol described in the schematic flowchart in . They were encouraged to keep on stepping for the given durations at each level but were assured in advance that they could withdraw at any time. The presumption is that people in the general population will choose their maximal possible ascending speed to reach a safe place in an evacuation situation. Thus, it was only at L3 (90% of VO2max) that the subjects were instructed to ascend for 5 min at the most or until exhaustion. They rated their perceived exertion on the Borg Scale after the test.
Figure 1. A subject ascending on the StairMaster after full instrumentation.
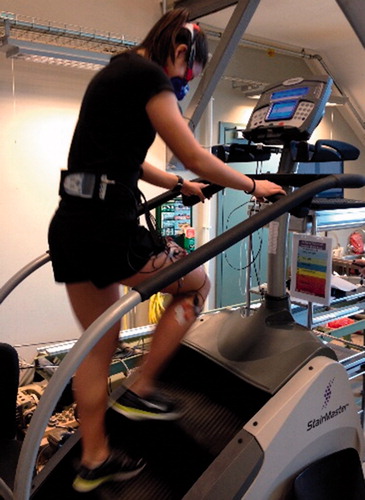
Figure 2. Schematic flowchart and protocol of the stair ascending test.
2.4. Instruments and subject preparation
The instruments included a HR transmitter buttoned to a chest belt and a wristwatch (RS400; Polar Electronics, Finland). A cardiopulmonary exercise testing system (Metamax II; Cortex Medical GmbH, Germany), consisting of a facemask with a volume transducer fastened with a head cap, sampled the respiratory gasses every 10 s. An EMG biomonitor (Megawin ME6000-T16; Mega Electronics, Kuopio, Finland) recorded the raw EMG at a sampling rate of 1024 Hz. The EMG system was fastened to the subjects’ waists with straps during the tests. Electromyography was recorded from the dominant lower limb muscles including the knee extensors, such as vastus lateralis (VL) and rectus femoris (RF), and the foot plantar flexors, such as gastrocnemius medialis (GM) and gastrocnemius lateralis (GL).
The skin was cleaned with 70% isopropyl alcohol after scrubbing lightly with fine sandpaper before applying the electrodes. EMG signals were obtained by using pre-gelled bipolar (AgCl) surface electrodes in pairs (Neuroline-720; Ambu, Ballerup, Denmark). Thigh and calf muscles’ fibre arrangements were considered before positioning the electrodes over the contracted muscle belly in line with the direction of the muscle fibres, with a centre-to-centre distance of approximately 15–20 mm. The reference electrodes were attached to the tubercle and shaft of the tibia and fibular head. The same investigator performed the placement of electrodes following the guidelines of surface electromyography for the noninvasive assessment of muscles (SENIAM) at www.seniam.org, Enschede, Netherlands (Hermens et al. Citation2000). Clothing and shoes were not standardised; subjects were allowed to wear their own sports clothes.
2.5. Data collection and processing
Prior to the test, EMG recordings were also taken of the isometric MVC of the ankle plantar flexion (calf) and knee extension (quadriceps). The middle range of motion of the ankle and knee joints was positioned so they could exert maximum isometric force. The MVC durations were kept for 3–5 s.
2.5.1. EMG data processing and normalization
The raw EMG signals were first filtered through a band-pass filter (20–499 Hz) (Merletti Citation1999). The Megawin Software, version 3.1-b10, was used. All the ascending durations (ADs) from L1, L2 and L3 for each subject were divided into 10 equal-length periods in order to achieve time normalization of the individual ADs. The ADs at L3 varied between subjects depending on individual capacities. This normalization method was applied in order to compare the dynamic muscle activities at each 10th percentile interval (MacIsaac, Parker, and Scott Citation2001; Dingwell et al. Citation2008). The MDF in Hz was retrieved from an average spectrum analysis using the calculation window. Root mean square averaging was applied to obtain the average AMP in µV from each 10% period. Each average 10% AMP data set was normalized by the average AMP recorded during the MVC tests of the respective muscles. Due to excess noise from the EMG signals, the GM muscle AMP data from two participants and the RF and VL muscle AMP data from another participant were excluded from the analyses.
2.5.2. EMG data interpretation through MARC and MAIS
The MAIS were developed and used to interpret the dynamic EMG data during stair ascending on regular stairs (Halder et al. Citation2018). The MAIS are based on the following four assumptions of EMG muscle activity (AMP and MDF) rate changes (MARC) over the ADs. The first assumption is that an increase in both AMP and MDF is an indication of muscle force increase. The second assumption is that an increase in AMP and a decrease in MDF is an indication of muscle fatigue. The third assumption is that a decrease in both AMP and MDF is an indication of decreasing muscle force. The fourth assumption is that a decrease in AMP and an increase in MDF are an indication of recovery from muscle fatigue (Cifrek et al. Citation2009). MARC were observed on the both AMP and MDF values of the 10 equal length divisions (10%) of the total ascending period (100%). The 10% of periodical average EMG activity during repeated movements of a task may provide an estimation of fatigue based on the relative changes that occur in the MDFs and AMPs of the leg muscles (Asplund and Hall Citation1995). The averages of the MDF and the normalized AMP for each equally divided 10% period were calculated to yield one data point, giving a total of 10 data points for each subject. These 10 periodical average AMP and MDF data points (10–100%) and the changes between the unit times represent the MARC for each muscle during ascension. Later, both the AMP and MDF MARC values were combined to obtain one final point for each 10th percentile duration and that was presented into the MAIS.
2.5.3. Calculation and statistics
The maximums (highest) and means of the last 30 s (last 30 s) of the cardiorespiratory parameters, including HR, VO2 and metabolic rate (M), were extracted from the data after the initial sharp increase for all three ascending levels separately.
The assumption of normality of the EMG values was not satisfied in the mixed model and analysis of variance (ANOVA) tests. Thus, the Friedman’s test of nonparametric-related samples was performed to observe how the related muscle activities changed over time for both the AMP and MDF. Independent t tests were performed to determine the statistical significance of the physiological variables between genders.
During an emergency evacuation, an ascending speed is expected to be close to the individual’s maximal capacity (on average about 90% of VO2max related speed). Pronounced muscle fatigue was not expected within the 3-min duration for low intensity tests at L1 and L2 (60 and 75% of VO2max) (ISO Citation2004; Holmer and Gavhed Citation2007). Accordingly, correlation and regression analyses and the MARC and MAIS were applied to L3 (90%) results where the SRs were, as expected, relevant to an emergency and quick evacuation. Pearson’s correlation analyses were performed among the three muscle variables of AMP, MDF and VO2 at L3 to determine if the extent of the fixed speed can explain the changes in AMPs and MDFs during the slow component increase in VO2. Individual ADs were different at L3. All physiological data, including VO2, HR and M data, were also normalized to 0–100% periods following the same procedure of EMG normalization.
As stated in Section 2.5.2, the averages of the parameter values were calculated for each of the 10% normalized periods for each subject and then for all subjects. In addition, the MARC representing average EMG AMPs and MDFs were calculated by the following equation:
where Δ is change in a selected parameter over a normalized period;
is the selected parameter value at a normalized time point n;
is the selected parameter value at a normalized time point n–1;
is the average duration in seconds for ascending at 90% of VO2max SRs and 10 is the total number of normalized periods.
Statistical analyses were carried out in Excel (Microsoft Corporation, USA) and the Statistical Package for the Social Science (SPSS), version 22.0 (IBM Corporation, USA). A probability (p) value of ≤0.05 was considered to be statistically significance for all tests.
3. Results
3.1. Stair ascending capacity
All 25 participants managed to ascend for the two 3-min durations at the lower intensities at L1 and L2 without major cardiovascular strain and exertion. Notably, the %VO2max were slightly higher than the targets based on VO2max: 63 and 79%, respectively, for L1 and L2 (). Seventeen of the 25 participants managed to sustain ascending for the stipulated 5-min duration at L3 and they rated the SR as ‘extremely hard’, especially regarding leg exertion. The remaining eight quit between 2 and 4 min (). The mean (SD) perceived exertion measured on the Borg Scale at the end of the test was 19 (1). The %HRmax reached varied widely during exercising at these fixed SRs. The calculated mean (SD) M per step was 1.38 (0.59) W·m−2. Interestingly, the M and VO2 per step were lowest during ascending at the highest SRs and highest during low SRs at all three levels.
Table 2. Stair ascending capacity comparisons of three individual step rates for all subjects (N = 25) with mean (SD).
3.2. Comparisons between males and females
There were statistically significant gender differences in the anthropometric data including body weight (p = .025), height (p = .016), body surface area (p = .009) and absolute VO2max values in L·min−1 (p = .019) (). No stair ascending performances between genders at L3 showed a statistically significant difference except average absolute values in L·min−1 for VO2last 30 s and VO2highest, p = .022 and .014, respectively. Moreover, the male participants’ ADs were shorter than the females at L3 ().
Table 3. Stair ascending capacity comparisons between males (N = 13) and females (N = 12) at L3 (90% of VO2max) with mean (SD).
In the L1 exercise, the mean (SD) VO2highest for the males and females reached 29.3 (6.0) and 29.7 (6.7) mL·min−1·kg−1 while the average HRhighest peaked at 139.9 (15.1) and 144.2 (16.8) bpm, respectively. The average M highest values for men and women were 410.9 (71.9) and 366.7 (73.0) W·m−2, respectively. At L2, the VO2highest reached 36.2 (6.3) and 37.4 (7.5) mL·min−1·kg−1 for the males and females, respectively. The HRhighest peaked at 164.0 (16.4) and 167.2 (12.1) bpm during ascending at L2 for men and women, respectively. The average M highest values for males and females reached 519.0 (88.7) and 476.4 (84.1) W·m−2, respectively.
At L1, the average ascending speed, the calculated vertical height reached (V height reached) and the vertical displacement (V disp) were almost equal for males and females at 0.36 m·s−1, 40 m and 13 m·min−1, respectively. In contrast at L2, the average ascending speeds for men and women were 0.47 and 0.48 m·s−1, respectively. The calculated mean value for the V height reached was 52.3 m for men and 53.7 m for women. The V disp was over 17.5 m·min−1 for both genders in the 3-min test at 75%. The %HRmax was about 71% for men and 77% for women at L1 (60%: 66 steps·min−1 for both genders). Similarly, at L2 (75%: 87 steps·min−1 for males and 89 steps·min−1 for females), the percentages reached 84% and 90% of the HRmax levels for men and women, respectively, based on the VO2max test.
3.3. Oxygen uptake (VO2) at three SRs
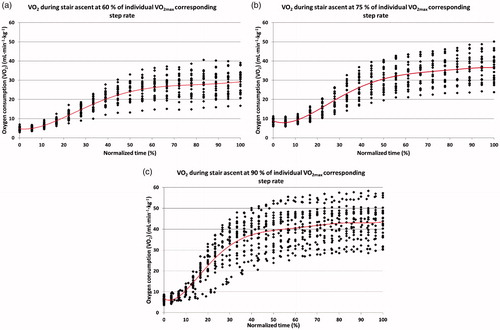
The VO2 values obtained from the three levels of ascending tests indicated that every cardiorespiratory steady state of VO2 and its kinetics were related to each of the stair ascending intensity at the fixed rate. The levels of VO2 increased as the stair ascending intensities increased from L1 to L2. The VO2 values were on average below 30, above 35 and above 40 mL·min−1·kg−1, respectively, for 60% (L1), 75% (L2) and 90% (L3) of VO2max (). At the L1 and L2 3-min tests, the cardiorespiratory steady state reflected in VO2last 30 s values, accumulated at 90% of the total normalized ascending period and during the VO2 slow components’ increase. In contrast, the stable VO2 started to accumulate after 70% of the total normalized ascending period at L3. This time was equal to 3.0 min after the onset of ascending.
Figure 3. Average oxygen uptakes in normalized periods (0–100%) for all subjects (N = 25) for 3 min each at L1 (a) and L2 (b) and a maximum of 5 min or until exhaustion at L3 (c). The average absolute ascending times were 3.0, 3.0 and 4.3 min at L1, L2 and L3, respectively.
3.4. Changes over time in EMG MDF and AMP
The VL (p = .039) and RF (p = .043) MDF values differed significantly between their average normalized periods (10–100%) during ascending at L1 and L2, as shown in the Friedman’s test, . In contrast, the MDFs of the VL (p < .001), RF (p = .009) and GL (p = .011) muscles decreased significantly over time (except GM) during the L3, intensive ascending exercise ().
Figure 4. Average changes in EMG MDFs (left column: a, c and e) and normalized AMPs (right column: b, d and f) over the normalized (10–100%) periods at L1, L2 and L3, respectively.
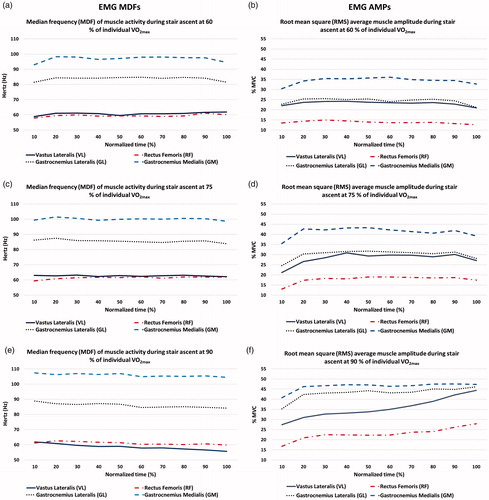
The EMG AMPs clearly showed an increase at the initial 10–20% periods for all muscles and at three levels. They reached a steady state and decreased at the end of ascending at L1 and L2, while there was a continuous increase over time during ascending at L3. However, the average AMPs for all of the four muscles increased significantly across the time normalized periods (10–100%) at all three levels (L1, L2 and L3, p < .05), .
3.5. MARC in MAIS
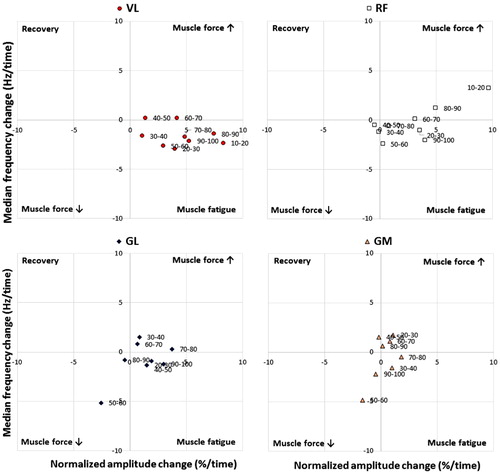
All four muscles’ AMP and MDF rate changes during the test at L3 showed a similar pattern in the MAIS. Most of the values aggregated between the muscle force increase and muscle fatigue squares of each muscle diagram (towards the right half of the diagrams in ). It is important to note that the end periods’ (90–100%) MARC values of the muscles were concentrated in the muscle fatigue square except for GM, which showed a decreased muscle force ().
Figure 5. Muscle activity rate changes (MARC) for four muscles in normalized periods (10–100%) periods at 90% VO2max (L3) in the muscle activity interpretation squares (MAIS).
4. Discussion
4.1. Stair ascending aerobic capacities at three speeds
The main finding of this study was that the average VO2highest and HRhighest values reached 43.9 mL·min−1·kg−1 and 184.9 bpm during ascending at approximately 90% of VO2max SR (L3), and the values were 94% VO2max and 97% HRmax, respectively. However, the VO2highest was lower than the subjects’ VO2max (46.7 mL·min−1·kg−1) ( and ). The average ascending duration was 4.32 min with an SR range between 68 and 133 steps·min−1 and the calculated V height reached 95 m. These data were used to develop an ascending evacuation model (Kuklane and Halder Citation2016).
The average M highest was about 600 W·m−2 during ascending at 90% of VO2max SR. The observed VO2highest and calculated M highest ranges were between 30.7 and 58.3 mL·min−1·kg−1 and 423.8 and 764.4 W·m−2, respectively (). The calculated average M highest values were about 400 W·m−2 at 60% of VO2max, which means that it is an activity that can be continued for up to 2 h according to ISO 8996 (ISO Citation2004). The M highest achieved during the ascents at 75% of VO2max (L2) () is in agreement with the suggested M of about 475 W·m−2 (approximately 70% of VO2max) for an activity lasting about 15–20 min (Holmer and Gavhed Citation2007). Holmer and Gavhed (Citation2007) have also shown that people can manage an activity at this M for up to 5 min; in their study, the average M highest reached 612 W·m−2, VO2highest to 44 mL·min−1·kg−1 and HRhigehst peaked at 179 bpm. In another ascending study involving a 5-min activity on a different step machine with a similar SR of 112 steps·min−1, the average VO2highest reached 42 mL·min−1·kg−1 and the HRhighest peaked at 175 bpm (Butts, Dodge, and McAlpine Citation1993). Notably, the present study’s HRhighest was higher than the values of the previous two studies. The high HR indicates that the L3 workload appeared excessive for the leg muscles, resulting in fatigue. Leg muscle fatigue and exhaustion may have forced the subjects to discontinue during the 5-min long ascending and LMF was presumably responsible for lowering the VO2highest values more than their VO2max but equal to previously studied high intensity simulated tasks. In a previous experiment on simulated firefighting tasks, the VO2max rose to 44 mL·min−1·kg−1 (83% of VO2max) in the process of rescuing six victims and climbing six flights of stair for 5 min (von Heimburg, Rasmussen, and Medbo Citation2006).
The males’ average AD was shorter than the females’ at L3. Most of the subjects were males who quit before 5 min, showing that their significantly higher body mass made the difference in their ability to sustain the critical power during stair ascending at 90% VO2max. The male participants’ body mass ranged between 61 and 128 kg while the females’ was between 53 and 77.5 kg. The ascending distance (V height reached) calculated for the female participants was longer because they carried a low body mass resulting in a longer AD (Poole et al. Citation2016). Moreover, there was a high variation in their selected SRs. The men’s VO2max range was between 32.8 and 59.5 mL·min−1·kg−1, and the women’s was between 30.7 and 60.6 mL·min−1·kg−1. The M highest for men was higher than that for women (). The considerable differences in energy demands could lead to exhaustion in L3 (). However, women reached the higher percentage of their VO2max, 94.8 vs 92.5%, and HRmax, 98.0 vs 95.9%, compared to men at L3.
4.2. Muscle activity EMG AMP and MDF
The analysis of muscle activity was a guide in evaluating how LMF in the legs affected the stair ascending oxygen uptake and performance at the three ascending intensities, especially L3. The AMPs increased significantly in all three controlled ascending speeds ()), and three muscles MDFs decreased significantly at L3 (), providing strong evidence of LMF. The decrease in MDF results is supported by the progressive decreased MDF results found by Scheuermann, Tripse McConnell, and Barstow (Citation2002) in fast ramp increase cycling with a constant pedalling rate, suggesting that the MDF decrease was associated with fatigue during the constant ascending pace.
At L3, the MARC percentile points over time supported the muscle fatigue results. Most of the MARC points, especially during the last 90–100% period, were in the ‘muscle fatigue’ square in the MAIS. This provided evidence of leg muscles fatigue during the test at 90% VO2max SR (). We observed that some points corresponding to the starting periods were in the ‘force increase’ square, which suggests that subjects were strong enough to exert a high force in the beginning of the ascents. The MARC points shifted to the ‘muscle fatigue’ square after the onset of fatigue while ascending was kept at a constant high speed with minimal possibilities of postural adaptations. However, in the previous field study during ascending on the regular stairs, the subjects tried to cope with fatigue by inclining forward and transferring their body weights through their forearms to the handrails to reduce the leg muscles’ workload (Halder et al. Citation2018). The recruitment of additional muscle fibres may not have been possible during high-intensity and constant ascents, and the decrease in muscle working efficiency from the fibres already recruited may be associated with leg LMF, which reduced the ascending tolerance (Cannon et al. Citation2011; Jones et al. Citation2011; Vanhatalo et al. Citation2011; Zoladz et al. Citation2008).
The EMG results of the two lower SRs (L1 and L2) indicate that workloads and durations were insufficient to cause fatigue, especially for the calf muscles. The leg muscular exertion was high only for VL and RF muscles at 3-min test durations at L1 and L2, while MDFs significantly shifted to lower frequencies ()) (Samuel et al. Citation2011). The EMG AMPs showed a relationship to the constant ascending intensities and reflected the workloads of the lower limb muscles measured at different intensities (). A 3–5% higher percentage of muscle activations were required at L3 than in the two lower SRs. Moreover, individual muscles had their own AMP and relative MDF levels to comply with the ascending intensities ().
4.3. Muscle activity and VO2
The average AMP increase was relatively stable after an initial sharp increase within 1 min. Each intensity of ascension progressively recruited the required fibres to maintain the constant SR (). The ascending intensities were above the threshold for a prolonged activity that was supported by the 97% of VO2max reached, which required high velocity leg muscular movements, while the EMG AMP threshold reached 45% of MVC during ascending. The greater use of fast, type II muscle fibres increases the energy demand and causes a progressive, simultaneous VO2 increase and later a relatively steady state (Saunders et al. Citation2000), which was observed after the initial increase during the continuation of ascent at 90% VO2max SR (L3) (). At higher work rates above the ventilatory threshold, VO2 did not reach a steady state immediately but continued to rise slowly (Barstow Citation1994; Whipp and Wasserman Citation1972) as did lactate to the point of fatigue (Roston et al. Citation1987). The VO2 values were still increasing at the point of exhaustion or at the end of the 5-min ascending test, while the muscles’ force production was consistent for maintaining the fixed SR. The pumping capacity of the heart reached its upper limit at about 97% of HRmax due to high and constant repetitive activities, which is evidence of reaching the ventilatory threshold. The oxygen supply might be insufficient to meet the increasing energy demands for the aerobic metabolism of the leg muscles, constraining work efficiency. The body needed to recover by either slowing down the ascending speed or taking micropauses in order to continue the ascent for a long duration. Ascending speed reductions or micropauses were impossible in the machine-controlled SR where the subjects had no control over their ascents.
The anaerobic energy-yielding process dominated after the onset of ascents. It was primarily dependent on the storage of adenosine tri-phosphate and creatine phosphate (Costill, Wilmore, and Kenney Citation2012). When there is limited energy storage available in the muscles, the aerobic energy process takes over the synthesis of new fuel on demand. The delay in both VO2 uptake and oxygen utilization in the body should be considered when relating EMG to VO2. The progressive increase in AMP and decrease in MDF at L3 suggest an association with fatigue (Scheuermann, Tripse McConnell, and Barstow Citation2002; Cifrek et al. Citation2009). Research documented that the AMP and spectral characteristics of the EMG signal would increase over the duration of the VO2 slow component (Sabapathy, Schneider, and Morris Citation2005). During these high-intensity exercises, as more and more fast-twitch fibres were recruited in order to maintain the same speed, the rate of oxygen uptake had to increase. At the same time, the muscle fibres that became fatigued earlier in ascending might continue to consume oxygen as they recover and this might also reduce efficiency and contribute to the VO2 slow component. The VO2 slow component observed after stabilization with high AMP results indicated a progressive loss of muscle contractile efficiency due to leg LMF (Jones et al. Citation2007; Cannon et al. Citation2011).
The inability of the subjects to sustain energy transportation at a tolerable aerobic level in the local leg muscles due to controlled and repetitive tasks is responsible for shortening the ascending duration and causing an early cessation. The controlled and high SR resulted in overall fatigue and exhaustion of the entire body due to lack of recovery (Vogiatzis et al. Citation1996) and inhibited the VO2highest from reaching the VO2max during ascents (Ben-Ezra and Verstraete Citation1988). The cardiorespiratory capacity and natural anaerobic processes combined caused LMF in the leg muscles and prevented subjects from reaching any of these limits in the ascensions involving fixed and high SRs. Thus, the results of this study suggest that evacuation at 90% intensity can be sustained for 2–6 min. It is necessary to carry out more controlled studies at different predetermined SRs to further examine stair ascending endurance, oxygen uptake and muscle performance until exhaustion.
5. Conclusions
Stair ascending capacity reached 94% and 97% of the subjects’ average VO2max and HRmax, respectively, at 90% of VO2max (L3) at an average step rate (SR) of around 109.4 (17.8) steps·min−1. The VO2highest registered 43.9 mL·min−1·kg−1 during stair ascending tests. An average, HRhighest peaked at 185 bpm and the metabolic rate reached about 600 W·m−2, indicating the maximal cardiorespiratory capacity. One-third of the subjects terminated the ascension at L3 before reaching the stipulated test duration of 5-min, so that the average ascending duration was 4.32 min. At L3, high repetitive muscle activity and controlled, constant speed denied recovery, which caused an imbalance between the energy availability and local demand that led to local muscle fatigue (LMF) in the legs. The significant increase in EMG AMPs and decrease in MDFs evidenced LMF. High intensity ascents at controlled SRs at 90% of VO2max or above could be sustained for 2–6 min on the stair machine, depending on prerequisites such as body mass and step rate. The points of the MARC appeared in the muscle fatigue area of the MAIS. MARC and MAIS are useful for observing muscle activity changes over time during dynamic tasks. The study results infer that the combined effects of leg LMF and high cardiorespiratory demand limited the subjects’ ascending tolerance and consequently, forced them to stop their ascents on the stair machine.
| Abbreviations | ||
| HRmax | = | maximum heart rate reached during maximal aerobic capacity test (bpm) |
| HRlast 30 s | = | average heart rate during the last 30 s of each ascending exercise (bpm) |
| HRhighest | = | maximum heart rate reached during ascending test (bpm) |
| MAIS | = | muscle activity interpretation squares |
| MARC | = | muscle activity rate changes |
| M highest | = | maximum metabolic rate reached during ascending test (W·m−2) |
| M last 30 s | = | average metabolic rate during the last 30 s of each ascending exercise (W·m−2) |
| V disp | = | vertical displacement (m·min−1) |
| V height reached | = | vertical height reached (m) |
| VO2max | = | maximum oxygen uptake reached during maximal aerobic capacity test (L·min−1, mL·min−1·kg−1) |
| VO2highest | = | maximum oxygen uptake reached during stair ascending test |
| VO2last 30 s | = | average oxygen uptake during the last 30 s of each ascending exercise |
| %VO2max | = | the average VO2highest during the stair ascending test that reached the percentage of VO2max |
| %HRmax | = | the average HRhighest during the stair ascending test that reached the percentage of HRmax |
Acknowledgements
The work was sponsored by the Swedish Fire Research Board (Brandforsk) and the Swedish Transport Administration (Trafikverket). The sponsors had no role in the study design, data collection and analysis, decision to publish or preparation of the manuscript. The authors appreciate the useful contributions made by the project leaders, Karl Fridolf and Enrico Ronchi from the Division of Fire Safety Engineering, and the cooperation partners, Mattias Delin from DeBrand Sverige AB and Johan Norén from Brand & Riskingenjörerna AB. Finally, we acknowledge Eileen Deaner for editing the language.
Disclosure statement
The authors declare that no competing interests exist.
Additional information
Funding
Related Research Data
References
- ACSM. 2010. American College of Sports Medicine, ACSM's Guidelines for Exercise Testing and Prescription. 8th ed. Philadelphia, USA: Wolters Kluwer/Lippincott Williams & Wilkins.
- Arias, S., E. Ronchi, J. Norén, M. Delin, K. Kuklane, A. Halder, and K. Fridolf. 2016. “An Experiment on Ascending Evacuation on a Long, Stationary Escalator.” In 14th International Conference and Exhibition on Fire Science and Engineering (Interflam), 2016. Windsor, United Kingdom
- Asplund, D. J., and S. J. Hall. 1995. “Kinematics and Myoelectric Activity During Stair-Climbing Ergometry.” Journal of Orthopaedic & Sports Physical Therapy 22 (6): 247–253. doi:10.2519/jospt.1995.22.6.247.
- Barstow, T. J. 1994. “Characterization of VO2 Kinetics During Heavy Exercise.” Medicine and Science in Sports Exercise 26 (11): 1327–1334. doi:10.1249/00005768-199411000-00006.
- Bassett, D. R., J. A. Vachon, A. O. Kirkland, E. T. Howley, G. E. Duncan, and K. R. Johnson. 1997. “Energy Cost of Stair Climbing and Descending on the College Alumnus Questionnaire.” Medicine and Science in Sports Exercise 29 (9): 1250–1254. doi:10.1097/00005768-199709000-00019.
- Ben-Ezra, V., and R. Verstraete. 1988. “Stair Climbing: An Alternative Exercise Modality for Firefighters.” Journal of Occupational Medicine 30 (2): 103–105.
- Butts, N. K., C. Dodge, and M. McAlpine. 1993. “Effect of Stepping Rate on Energy Costs During StairMaster Exercise.” Medicine and Science in Sports Exercise 25 (3): 378. doi:10.1249/00005768-199303000-00013.
- Cannon, D. T., A. C. White, M. F. Andriano, F. W. Kolkhorst, and H. B. Rossiter. 2011. “Skeletal Muscle Fatigue Precedes the Slow Component of Oxygen Uptake Kinetics During Exercise in Humans.” The Journal of Physiology 589 (Pt 3): 727–739. doi:10.1113/jphysiol.2010.197723.
- Cheng, A. J., and C. L. Rice. 2013. “Factors Contributing to the Fatigue-Related Reduction in Active Dorsiflexion Joint Range of Motion.” Applied Physiology, Nutrition, and Metabolism 38 (5): 490–497. doi:10.1139/apnm-2012-0357.
- Cifrek, M., V. Medved, S. Tonkovic, and S. Ostojic. 2009. “Surface EMG Based Muscle Fatigue Evaluation in Biomechanics.” Clinical Biomechanics 24 (4): 327–340. doi:10.1016/j.clinbiomech.2009.01.010.
- Costill, L. D., H. J. Wilmore, and W. L. Kenney. 2012. Physiology of Sport and Exercise. 5th ed. Champaign, IL: Human Kinetics.
- Delin, M., J. Norén, E. Ronchi, K. Kuklane, A. Halder, and K. Fridolf. 2016. “Ascending Stair Evacuation: Walking Speed as a Function of Height.” Fire and Materials 41 (5): 514–534. doi:10.1002/fam.2410.
- Dingwell, J. B., J. E. Joubert, F. Diefenthaeler, and J. D. Trinity. 2008. “Changes in Muscle Activity and Kinematics of Highly Trained Cyclists During Fatigue.” IEEE Transactions on Biomedical Engineering 55 (11): 2666–2674. doi:10.1109/TBME.2008.2001130.
- Eteraf Oskouei, A., N. Ferdosrad, I. Dianat, M. Asghari Jafarabadi, and J. Nazari. 2014. “Electromyographic Activity of Soleus and Tibialis Anterior Muscles during Ascending and Descending Stairs of Different Heights.” Health Promotion Perspectives 4 (2): 173–179. doi:10.5681/hpp.2014.023.
- Gottschall, J. S., G. S. Aghazarian, and E. A. Rohrbach. 2010. “The Metabolic and Muscular Differences Between Two Stair-Climbing Strategies of Young Adults.” The Journal of Strength & Conditioning Research 24 (9): 2558–2563. doi:10.1519/JSC.0b013e3181e83a6f.
- Halder, A., K. Kuklane, C. Gao, M. Miller, M. Delin, J. Noren, and K. Fridolf. 2018. “Limitations of Oxygen Uptake and Leg Muscle Activity During Ascending Evacuation in Stairways.” Applied Ergonomics 66: 52–63. doi:10.1016/j.apergo.2017.08.003.
- Hermens, H. J., B. Freriks, C. Disselhorst-Klug, and G. Rau. 2000. “Development of Recommendations for SEMG Sensors and Sensor Placement Procedures.” Journal of Electromyography and Kinesiology 10 (5): 361–374. doi:10.1016/S1050-6411(00)00027-4.
- Holmer, I., and D. Gavhed. 2007. “Classification of Metabolic and Respiratory Demands in Fire Fighting Activity with Extreme Workloads.” Applied Ergonomics 38 (1): 45–52. doi:10.1016/j.apergo.2006.01.004.
- International Organization for Standardization (ISO). 2004. ISO 8996 Ergonomics of Thermal Environment – Determination of Metabolic Heat Production. Geneva, Switzerland: ISO.
- Jones, A. M., B. Grassi, P. M. Christensen, P. Krustrup, J. Bangsbo, and D. C. Poole. 2011. “Slow Component of VO2 Kinetics: Mechanistic Bases and Practical Applications.” Medicine and Science in Sports Exercise 43 (11): 2046–2062. doi:10.1249/MSS.0b013e31821fcfc1.
- Jones, A. M., D. P. Wilkerson, N. J. Berger, and J. Fulford. 2007. “Influence of Endurance Training on Muscle [PCr] Kinetics During High-Intensity Exercise.” American Journal of Physiology. Regulatory, Integrative and Comparative Physiology 293 (1): R392–R401. doi:10.1152/ajpregu.00056.2007.
- Kuklane, K., and A. Halder. 2016. “A Model to Estimate Vertical Speed of Ascending Evacuation from Maximal Work Capacity Data.” Safety Science 89: 369–378. doi:10.1016/j.ssci.2016.07.011.
- Lam, J. H. T., J. K. K. Yuen, E. W. M. Lee, and R. Y. Y. Lee. 2014. “Experimental Study on Upward Movement in a High-Rise Building.” Safety Science 70 (70): 397–405. doi:10.1016/j.ssci.2014.07.011.
- Macdonald, A. S., D. Loudon, P. J. Rowe, D. Samuel, V. Hood, A. C. Nicol, M. A. Grealy, and B. A. Conway. 2007. “Towards a Design Tool for Visualizing the Functional Demand Placed on Older Adults by Everyday Living Tasks.” Universal Access in the Information Society 6 (2): 137–144. doi:10.1007/s10209-007-0078-8.
- MacIsaac, D., P. A. Parker, and R. N. Scott. 2001. “The Short-Time Fourier Transform and Muscle Fatigue Assessment in Dynamic Contractions.” Journal of Electromyography and Kinesiology 11 (6): 439–449. doi:10.1016/S1050-6411(01)00021-9.
- Merletti, R. 1999. “Standards for Reporting EMG Data.” Journal of Electromyography and Kinesiology 9 (1): 3–4.
- O'Connell, E. R., P. C. Thomas, L. D. Cady, and R. J. Karwasky. 1986. “Energy Costs of Simulated Stair Climbing as a Job-Related Task in Fire Fighting.” Journal of Occupational Medicine 28 (4): 282–284.
- Oksa, J., M. B. Ducharme, and H. Rintamaki. 2002. “Combined Effect of Repetitive Work and Cold on Muscle Function and Fatigue.” Journal of Applied Physiology 92 (1): 354–361. doi:10.1152/jappl.2002.92.1.354.
- Poole, D. C., M. Burnley, A. Vanhatalo, H. B. Rossiter, and A. M. Jones. 2016. “Critical Power: An Important Fatigue Threshold in Exercise Physiology.” Medicine and Science in Sports Exercise 48 (11): 2320–2334. doi:10.1249/mss.0000000000000939.
- Ronchi, E., J. Norén, M. Delin, K. Kuklane, A. Halder, S. Arias, and K. Fridolf. 2015. Ascending Evacuation in Long Stairways: Physical Exertion, Walking Speed and Behaviour. Lund, Sweden: Lund University.
- Roston, W. L., B. J. Whipp, J. A. Davis, D. A. Cunningham, R. M. Effros, and K. Wasserman. 1987. “Oxygen Uptake Kinetics and Lactate Concentration During Exercise in Humans.” The American Review of Respiratory Disease 135 (5): 1080–1084. doi:10.1164/arrd.1987.135.5.1080.
- Sabapathy, S., D. A. Schneider, and N. R. Morris. 2005. “The VO2 Slow Component: Relationship Between Plasma Ammonia and EMG Activity.” Medicine and Science in Sports and Exercise 37 (9): 1502–1509. doi:10.1249/01.mss.0000182497.43221.e1.
- Samuel, D., P. Rowe, V. Hood, and A. Nicol. 2011. “The Biomechanical Functional Demand Placed on Knee and Hip Muscles of Older Adults During Stair Ascent and Descent.” Gait Posture 34 (2): 239–244. doi:10.1016/j.gaitpost.2011.05.005.
- Saunders, M. J., E. M. Evans, S. A. Arngrimsson, J. D. Allison, G. L. Warren, and K. J. Cureton. 2000. “Muscle Activation and the Slow Component Rise in Oxygen Uptake During Cycling.” Medicine and Science in Sports Exercise 32 (12): 2040–2045. doi:10.1097/00005768-200012000-00012.
- Scheuermann, B. W., J. H. Tripse McConnell, and T. J. Barstow. 2002. “EMG and Oxygen Uptake Responses During Slow and Fast Ramp Exercise in Humans.” Experimental Physiology 87 (1): 91–100. doi:10.1113/eph8702246.
- Teh, K. C., and A. R. Aziz. 2002. “Heart Rate, Oxygen Uptake, and Energy Cost of Ascending and Descending the Stairs.” Medicine and Science in Sports Exercise 34 (4): 695–699. doi:10.1249/00005768-200204000-00021.
- Vanhatalo, A., D. C. Poole, F. J. DiMenna, S. J. Bailey, and A. M. Jones. 2011. “Muscle Fiber Recruitment and the Slow Component of O2 Uptake: Constant Work Rate Vs. All-Out Sprint Exercise.” American Journal of Physiology. Regulatory, Integrative and Comparative Physiology 300 (3): R700–R707. doi:10.1152/ajpregu.00761.2010.
- Vogiatzis, I., N. C. Spurway, S. Jennett, J. Wilson, and J. Sinclair. 1996. “Changes in Ventilation Related to Changes in Electromyograph Activity During Repetitive Bouts of Isometric Exercise in Simulated Sailing.” European Journal of Applied Physiology and Occupational Physiology 72 (3): 195–203. doi:10.1007/BF00838638.
- von Heimburg, E. D., A. K. Rasmussen, and J. I. Medbo. 2006. “Physiological Responses of Firefighters and Performance Predictors During a Simulated Rescue of Hospital Patients.” Ergonomics 49 (2): 111–126. doi:10.1080/00140130500435793.
- Whipp, B. J., and K. Wasserman. 1972. “Oxygen Uptake Kinetics for Various Intensities of Constant-Load Work.” Journal of Applied Physiology 33 (3): 351–356. doi:10.1152/jappl.1972.33.3.351.
- Zoladz, J. A., L. B. Gladden, M. C. Hogan, Z. Nieckarz, and B. Grassi. 2008. “Progressive Recruitment of Muscle Fibers Is Not Necessary for the Slow Component of VO2 Kinetics.” Journal of Applied Physiology 105 (2): 575–580. doi:10.1152/japplphysiol.01129.2007.