
Abstract
Outcomes, which are the result state or condition from a process or intervention, are essential elements of healthcare system design and an important indicator of performance. They are included in well-known system analysis frameworks such as the Systems Engineering Initiative for Patient Safety (SEIPS) and Cognitive Work Analysis (CWA). However, fewer practical approaches exist for understanding and communicating interactions among healthcare outcomes. This study applies a novel mapping method as a practical approach to collect, aggregate and visualise interrelations among multiple healthcare outcomes. Graphic facilitation mapping sessions with eleven healthcare providers and ten patients with chronic conditions were conducted. Participants created outcome interrelationship maps following a six-step process. Two outcome-based network visualisations were synthesised using network analysis. This outcome-based approach advances how we frame healthcare systems, focussing on accommodating multiple stakeholders’ visions, understanding interrelations, and defining trade-offs. This practical approach may complement frameworks such as SEIPS and CWA.
Practitioner summary: The presented outcome-based mapping approach can facilitate the understanding of outcomes as part of the interrelated healthcare system. The approach allows the discussion and integration of different stakeholders’ outcome priorities to identify critical elements and better inform the development or adaptation of healthcare systems.
Abbreviations: SEIPS: engineering initiative for patient safety; CWA: cognitive work analysis; HFE: human factors and ergonomics; AH: abstraction hierarchy; POTS: postural orthostatic tachycardia syndrome; DRM: design research methodology; FA2: forceAtlas2; HbA1c: glycated haemoglobin; NHS: National Health Service; UK: United Kingdom
1. Introduction
Worldwide, healthcare systems are facing critical and complex situations due to the existence of multiple driving forces. These forces emerge from different stakeholders’ purposes, values, outcome priorities, and local and global regulations. Despite the purpose of healthcare seeming straightforward, the diversity of healthcare stakeholders triggers multiple and commonly conflicting outcome prioritisation (Reuben and Tinetti Citation2012; Woolf et al. Citation2012). Outcomes are the result state or condition from a process or intervention and are an important indicator of performance; thus, outcomes can create feedback loops to adapt and improve systems (Holden et al. Citation2013); even further, there is recognition that outcomes in healthcare are interrelated and influence/impact each other (Carayon et al. Citation2020). Consequently, how outcomes are valued/prioritised by different stakeholders needs to be understood in a holistic way to assist the development and improvement of new and existing healthcare systems.
Given this situation, healthcare development is integrating a systems thinking paradigm to make sense of multiple perspectives from the different stakeholders. Systems thinking can facilitate the holistic understanding of elements of a system, challenge stakeholders’ assumptions and redistribute decision-making (Khan et al. Citation2018; Peters Citation2014; The Health Foundation Citation2011). Human factors and systems thinking approaches such as the Systems Engineering Initiative for Patient Safety (SEIPS) (Pascale Carayon et al. Citation2020; Holden et al. Citation2013) and Cognitive Work Analysis (CWA) (Rasmussen, Pejtersen, and Goodstein Citation1994; Read, Salmon, Lenné, and Stanton Citation2015) recognise and understand outcomes as an important part of system development. However, there is still a need to provide a more straightforward understanding of outcome interactions and how other healthcare systems elements vary in different contexts (Holden et al. Citation2013; Paz-Ybarnegaray and Douthwaite Citation2017; Petticrew et al. Citation2019). Furthermore, limited practical approaches exist for gathering, discussing, understanding, and communicating outcomes as interrelated systems (Akinluyi, Ison, and Clarkson Citation2019; Holden et al. Citation2013).
The aim of this study was to develop and apply a participatory mapping method as a practical approach to collect, aggregate and visualise interrelations among multiple healthcare outcomes. This practical approach was intended to provide a mechanism for different stakeholders to communicate and negotiate priorities to inform the design of healthcare activities and processes meaningfully.
Firstly, the concept of outcomes and how some systems thinking methods have previously integrated and communicated them are presented. Then, the bespoke method and data analysis of the mapping method is described. Next, two outcome-based visualisations (one for patients and one for providers) are explained. Subsequently, the need for a multiple outcome perspective and how this approach provides a novel mechanism to identify and communicate critical outcomes among stakeholders is discussed. Finally, the limitations of the research and direction for future work are presented.
2. What are outcomes, and how can they be used for the development of healthcare systems?
Generally, outcomes can be considered a (visible) effect that happens as a result of doing (or not) a specific action (Lewis and Killaspy Citation2014). In healthcare, these actions are commonly called interventions which could involve both patients and providers, and their environment (Davies and Crombie Citation1997; Wilkin, Hallam, and Doggett Citation1993). Outcomes have played a critical role in healthcare monitoring and evaluating the progression of interventions (Lewis and Killaspy Citation2014), while in clinical trials, outcomes attempt to inform future interventions. However, it has been recognised that outcomes from clinical trials often fail to translate into benefits for patients in a real context (Heneghan, Goldacre, and Mahtani Citation2017).
The Healthcare sector has recognised the need for integrating a broader range of outcomes to reflect meaningful aspects beyond the traditional health settings/trials studies (Lewis and Killaspy Citation2014). Healthcare providers had the responsibility to define outcomes and started using Patient-Reported Outcomes, Patient-Reported Experiences and Clinician-Related Outcomes to complement their traditional evaluations (Black et al. Citation2016; Greenhalgh Citation2009; Lewis and Killaspy Citation2014). It was recognised that there is a further need to include outcomes that emerge from qualitative or anecdotal data, to capture a broader range of human attributes and to consider a more extensive range of stakeholders (McConachie et al. Citation2018; Reuben and Tinetti Citation2012). Also, tensions between quantitative and qualitative evaluations in healthcare need to be tackled to integrate complex concepts and multiple outcomes (Gear, Eppel, and Koziol-Mclain Citation2018).
2.1. Outcomes as interrelated systems
It is critical to complex systems such as healthcare to identify its purpose to align its actions (Jones Citation2014), which can potentially be done by understanding outcomes. Complex systems with a common purpose contain essential parts that also have (sub)purposes of their own (Ackoff Citation1994). These (sub)purposes commonly trigger discrepancies between the different stakeholders and compromise the achievement of the common purpose. However, a proper understanding of the (sub)purposes often includes different ways of achieving the expected results; then, the expected outcomes should emerge during the purpose identification.
There are different challenges to integrating outcomes into system thinking-based intervention development. Interventions in complex systems rarely perform in an expected way and achieve the expected outcomes (Paina and Peters Citation2012). Systems thinking approaches characterise outcomes as unpredictable, unstable and path-dependent rather than caused by a lineal causal effect (Braithwaite et al. Citation2018). Thus, outcomes cannot be predicted precisely, but possible condition configurations of how the outcomes can be met can be constructed. Hence, methods for better understanding and communicating the interactions of multiple outcomes are needed to develop better healthcare systems interventions (Flemming et al. Citation2019; Petticrew et al. Citation2019). Thanks to this understanding, it could be possible to define a complex system-based monitoring and evaluation strategy (Paterson et al. Citation2009; Paz-Ybarnegaray and Douthwaite Citation2017) to inform the continuous adaptations needed in healthcare systems (Holden et al. Citation2013). Furthermore, a holistic understanding of the priorities can positively impact the design of more human healthcare services that embrace the different priorities of stakeholders.
2.2. Outcomes in complex system analysis frameworks
Some practical methods have utilised outcomes as key drivers for interventions. For example, Outcome Evidencing (Paz-Ybarnegaray and Douthwaite Citation2017), Outcome Harvesting (Wilson-Grau and Britt Citation2012) and Outcome Mapping (Earl, Carden, and Smutylo Citation2001) employ a backward mapping strategy to trace the links between outcomes and process/trajectories of change. From these, Outcome Evidencing integrates systems thinking attributes to include emergent and unexpected outcomes to monitor and evaluate. Still, it remains unclear how Outcome Evidencing can be implemented to inform the development of new complex interventions. This proactive application of outcomes is rarely used, but it could provide meaningful insights for system design (Akinluyi, Ison, and Clarkson Citation2019).
Human Factors and Ergonomics (HFE) approaches such as Cognitive Work Analysis (CWA) and the Systems Engineering Initiative for Patient Safety (SEIPS) have recognised the role of outcomes for complex system analysis and design. CWA is a formative framework to define the work demands of complex systems in terms of constraints (Naikar Citation2017; Rasmussen, Pejtersen, and Goodstein Citation1994). CWA tools such as the Abstraction Hierarchy (AH) help to understand constraints in a five-level means-ends structure. The structure is formed (in order of influence) by purpose, outcomes, functions, processes and objects. CWA understands the outcome level as the criteria to judge whether the system is achieving its purpose. It also expands this level, including values (principles, beliefs, rationale, laws and regulations, among others) to ensure a comprehensive inclusion of meaningful criteria (Naikar, Hopcroft, and Moylan Citation2005). The AH tool allows outcomes to link with functions and system purpose but did not expand about how to communicate the relationships between outcomes. Despite the dissemination and extensive repertoire of CWA tools (including a design-oriented toolkit by Read et al. Citation2018) that develop explicit dependent systems, there are less practical approaches focussing on multi outcome integration that deal with the trade-offs of values and priority measures (Read, Salmon, Lenné, and Jenkins Citation2015). A trade-off is well exemplified in healthcare when decisions about how to spend the budget are made; however, it is common that decisions are made based on the expected linear/direct benefits and may overlook the indirect consequences.
SEIPS is a healthcare model that aims to integrate HFE for quality and care improvements (Carayon et al. Citation2006). The three versions of SEIPS have explained and structured the role of outcomes in healthcare systems development. SEIPS defines outcomes as indicators of performance that gather different stakeholders’ goals. According to SEIPS, outcomes create feedback loops to inform and adapt systems. The original SEIPS version categorised outcomes into two stakeholder groups (patient and organisation), while the second version (Holden et al. Citation2013) expands the categorisation adding un/desirable, distal, and proximal attributes. The latest version of SEIPS categorises outcomes to patients (including safety), caregivers, clinicians and health organisations (Carayon et al. Citation2020). SEIPS acknowledges that the healthcare systems produce/influence multiple outcomes (Carayon et al. Citation2020) but has also recognised the lack of practical approaches to understand and relate this multi-outcome perspective (Holden et al. Citation2013). Therefore, the research presented in this paper aims to address this shortcoming through the development of an outcome-based approach.
The presented review of methods and frameworks is not exhaustive, and other important ones also integrate outcomes as part of their elements. Nonetheless, the selected approaches were included because they have tried to understand and conceptualise outcomes in depth. Nonetheless, these approaches still recognised that more is needed (Holden et al. Citation2013) to facilitate the understanding and analysis as dynamic and interrelated elements of the system.
2.3. The proposed outcome-based approach
The above-mentioned research landscape highlights an essential need for reconceptualising outcomes into systems thinking approach that pushes forward the development of healthcare systems. Although other methods exist that integrate outcomes, the novelty of this approach relies on the following three aspects: an open mapping approach to collect the data; the inclusion of a holistic range of outcomes as elicitation strategy; the analysis of visual data using a network approach. The final results from the analysis with these three combined aspects offer a unique perspective to influence the improvement of systems in a novel and less explored way.
In this method, outcomes will have the following attributes and roles:
Summative analysis of outcomes will not provide a holistic understanding, as parts will not represent the whole. However, formative analysis and synthesis of multiple outcome interactions should demonstrate/establish the purpose of the system.
The holistic nature of multiple outcome interactions calls for an integration of clinical, behavioural, psychosocial, organisational and environmental outcomes, among others. Consequently, outcomes should cover different stakeholders’ needs, which require a mix of quantitative/qualitative dimensions, multiple sources of data and evidence, as well as other types of unstructured elements.
Outcomes need to be defined in a participatory way. This participatory process means that the different stakeholders will be open to collectively discuss and build a new shared understanding of outcomes and their meanings from different perspectives. Instead of getting consensus, the aim is to build a holistic understanding of the complex perspectives, including tensions and trade-offs as a basis for negotiation.
Outcomes should represent a dynamic target that helps to understand ongoing situations and continuously adapt future interventions. Apart from evaluation, this understanding will trigger awareness of potential, emergent and unintended consequences. This could contribute to a bigger picture to coproduce transformational knowledge and co-create learning systems.
This expanded reconceptualisation of outcomes guided the development of this approach that aims to collect and understand multiple and interrelated stakeholders’ perspectives about what is meaningful to them. This approach will define a common ground to understand trade-offs and negotiate priorities in healthcare systems design. Further applications of the approach may include using the outcomes configuration to define initial priorities. However, one property of outcomes in complex systems is that they are dynamic and emergent; consequently, the outcome configuration should not be considered a fixed/unchangeable list of priorities.
The aim of this study was to apply a novel participatory mapping method as a practical approach to collect, aggregate and visualise interrelations among multiple healthcare outcomes. This practical approach was intended to provide a mechanism for different stakeholders to communicate and negotiate priorities to inform the design of healthcare activities and processes meaningfully.
3. Methods
A series of graphic facilitation mapping sessions (with simultaneous verbalisation) was conducted to identify how patients and providers conceptualise and prioritise outcomes as interrelated elements. Specific objectives were (i) to gain a deeper understanding of the participants’ perspectives about the concept of outcome and its interactions and (ii) to assess the feasibility of the outcome-based mapping method. One-to-one sessions were considered a suitable strategy to fulfil the objectives mentioned above.
3.1. Participants
3.1.1. Recruitment
Participants were recruited using purposive sampling to ensure representativeness from specific roles and chronic conditions. The participants were recruited from the East Midlands region in the UK, where the research team was based. Two main groups were considered for this study. The first group was a healthcare commissioner and providers group (providers), while the second consisted of people living with chronic conditions (patients). The groups of providers were identified as critical because they are commonly involved in making whole systems decisions and assigning budgets considering multiple priorities; in addition, this group could be seen as an extreme from patients, and a comparison between these groups is scarce in the literature.
The providers’ groups were contacted by direct email invitation based on the public data of their online profiles. The criteria consisted of having experience and currently leading an integrated healthcare project for long-term conditions; and they should be involved in engagement processes. This engagement process consisted of integrating patients in different ways (from being members of boards and consultations to co-design) to improve or redesign service delivery (Bombard et al. Citation2018). The patients’ group were invited through social media, posters on strategic announcement boards (community centres, supermarkets and schools) and following referrals from previous participants. The selection criteria were having a diagnosis of at least one long-term condition and experience of UK healthcare services.
3.1.2. Description of the participants
Twenty-one people were recruited for this study. The providers’ group included senior managers (n = 6), commissioners (n = 2) and local authorities (n = 3). Years of experience in the role ranged from four to twenty-one years (avg. 13 years). Ten persons living with chronic conditions formed the patients’ group. The chronic conditions from participants were diabetes (n = 2), fibromyalgia, Postural Orthostatic Tachycardia Syndrome (POTS), leukaemia, psoriasis, sarcoidosis, polycystic kidney disease, rosacea and myotonic dystrophy (n = 1 each). Our interest was not patients’ perspectives on disease-specific outcomes but general outcomes of any long-term conditions. The age of patients ranged from twenty-four to eighty-nine (avg. of 51.6 years); years living with the condition ranged from one year to thirty years (avg. of 10.9 years).
3.2. Summary of the research process to develop the outcome-based method
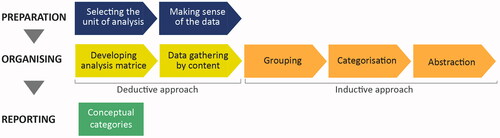
The proposed outcome-based method was developed following the Design Research Methodology (DRM) by Blessing and Chakrabarti (Citation2009, p. 15). DRM has four stages for systematically developing an approach. summarises these stages and the actions completed in each of them. A more detailed description of the development process can be consulted in other publications (Landa-Avila et al. Citation2018, Citation2020).
Table 1. Summary of the development process of the approach.
During the conceptualisation, four functions that this method needs to performed were defined: i) providing a shared language achieved by the use of outcomes as ‘boundary objects’; ii) identifying agreements and tensions using network analysis; iii) provided a balanced understanding of the needs by integrating a mix of outcomes from different categories and using an open mapping approach, and iv) encouraging whole systems decision and negotiation by using maps to visualise relationships and envisioned expected and unexpected consequences.
This paper focuses on the findings from the prescriptive study stage. This stage is the core and more intensive application stage involving patients and healthcare providers. This paper presents the application of the method in one-to-one sessions; this type of session was selected because a depth understanding was needed about individual perceptions and ways of interacting with the open mapping method. Also, this presented an opportunity to test a participatory approach in an asynchronous manner that could contribute to overcoming the challenges of gathering different healthcare stakeholders at the same time.
3.3. Outcome-based method procedure
3.3.1. Pilot
The mapping process was piloted to test the appropriateness of the materials and the level of researcher support needed for the mapping activity. Three one-to-one sessions formed the pilot. One session was conducted with a person living with diabetes and two with academic researchers.
Following the pilot, amendments and improvements were made, such as providing more precise instructions (with printed examples) for the mapping activity, additional questions during mapping and final feedback questions. Overall, the pilot sessions helped the researcher determine how to offer balanced support during the mapping task.
3.4. Procedure
The one-to-one sessions of this study followed a bespoke six-step process, following recommendations from graphic facilitation and mapping methods (Jones and Bowes Citation2017; Sevaldson Citation2015). Graphic facilitation (especially diagramming) has been recognised as excellent support for interviews to encourage communication, discuss abstract topics, and evidencing and organise the structure of complex conversations (Comi, Bischof, and Eppler Citation2014; Crilly, Blackwell, and Clarkson Citation2006). Additionally, mapping methods can generate complex visual system analyses of causalities and processes (Jones and Bowes Citation2017).
The expected total duration of the session was one hour, in which more than half of the session was expended in the mapping task (steps 2–5). All the session was audio-recorded to be analysed, and photos of the maps were taken as part of the data collected.
1) Introduction: Providers were asked about their current project, main goals/achievements and major barriers to assessing their progress. Patients were asked about their chronic condition journey, care plan goals and ways to monitor their condition. This introduction step helped as a stimulus to contextualise and frame the next step.
2) Selecting meaningful outcomes and clarifying their meaning: Participants were presented with previous mapping examples and sixty-six outcomes in the context of long-term conditions (), and no definition was provided. These outcomes emerged from a comprehensive literature review process following recommendations from Arksey and O’Malley (Citation2005), and further feedback on workshop sessions during the conceptualisation of the tool (Landa-Avila et al. Citation2020). This list of outcomes aimed to bring a holistic perspective, and different categories of outcomes were included. Participants were asked to select those that were the most important and meaningful to them from the provided outcomes. No restrictions were given regarding the number of outcomes that could be selected. Biometric outcomes (e.g. sugar levels for diabetes or heart rate for POTS) were slightly adapted for each patient condition, but the final number of outcomes remained the same. Participants had the opportunity to include new outcomes which were not included in the initial sixty-six. No restrictions were made regarding what could be considered as an outcome at this stage. The remaining outcomes were left in reach of the participants during the whole session () and could be added at any time during the mapping process.
Figure 1. Layout for the one-to-one mapping sessions.
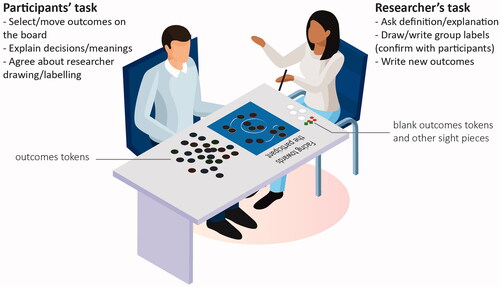
Table 2. List of outcomes presented in this study and previous categorisation.
The list of outcomes assisted in focussing on the discussion around the same aspect of the given context (defined in the introduction). The intention of this list was not prescribed outcomes but to elicit a holistic perspective of the range of outcomes that could be included.
3) Making sense of outcomes by creating influence relationships/groups: Participants were prompted to freely make sense of the outcomes after the initial outcome selection. Grouping and relationship lines were suggested as graphical elements to the participants; however, any layout structure was accepted. The lack of a preconceived structure has proved to increase the richness and diversity of information (Jones and Bowes Citation2017; Sevaldson Citation2015); this rationale suits the aim of understanding outcomes interrelations, as participants could incorporate any type of relationship that fits their sensemaking.
Open mapping could be overwhelming for some participants as there is no clear starting point; to mitigate this point, examples of previous maps were briefly presented as inspiration but removed from participants’ views to avoid influencing the participants. Participants were asked to verbalise the process to capture their sensemaking and rationale. The researcher helped drawing lines on the board according to the participants’ expressions () if participants were less comfortable with drawing. The researcher always confirmed with participants when manipulating/drawing on the map.
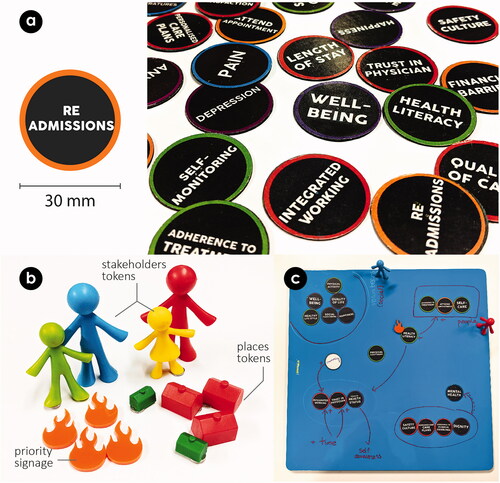
Figure 2. a) Outcome tokens used during the mapping task, b) Other tokens and c) Board during mapping.
Also, from this step, additional elements, such as people or places (), were added to the map as requested/mentioned by the participants.
4) Narrating the visualisations: Participants were asked to reflect and talk through the selected outcomes and their groupings. This narrative will assist the researcher in clarifying each of the meanings of outcomes and why they were clustered/related in that way.
5) Selecting the most important outcomes from the final map: Participants were asked to select up to three of their most important outcomes and explain the reason for the selection. A priority signage was placed next to the outcomes indicated for the participants.
6) Debrief and feedback: Participants explained their overall experience of mapping/using the tool and responded to open questions regarding its utility and usability.
After each session, the researcher reflected on the experience of applying the method using a semi-structured diary containing the following sections: i) methodological issues (things that worked well and not), ii) unexplicit feedback and participants’ behaviours, and iii) potential changes to the procedure.
3.5. Supporting mapping materials
In this study, outcome maps took the role of a ‘boundary object’. Boundary objects can be described as a common ground interface across communities of practice that act as translators of idiosyncratic meanings and practices (Sajtos, Kleinaltenkamp, and Harrison Citation2018; Star and Griesemer Citation1989). Various elements can be considered boundary objects as long as they offer interpretive flexibility, the structure of work and dynamic relationship to scale (Star Citation2010). Examples of boundary objects include repositories, diagrams, geographic maps, standardised forms, and controlled vocabulary.
‘Outcome tokens’ () were created and provided to represent the boundary object functions mentioned above. These tokens are small coin-sized pieces with outcomes written in text form. A magnet is fixed to the back of each one to allow participants to re-position the outcomes on a magnetic board according to their mapping process. Outcomes were presented randomly without establishing a definition or context to avoid assigning a meaning, context or relationship with a stakeholder.
Some other token pieces were produced () to represent stakeholders, places and priorities. These pieces were used during the mapping and were placed next to the related outcomes ().
3.6. Data analysis
The individual outcome maps were synthesised applying network analysis, which uses two basic elements: nodes (also called vertex) and their edges (also called links) (Havlin et al. Citation2012). According to the type of network, nodes can represent people (social networks), papers (information networks) and metabolic products (biological networks), among others (Newman Citation2003). Edges are different types of connections and links between the nodes, such as personal relationships (social networks), citations (information networks) and metabolic reactions (biological networks). Other essential elements of networks are the direction of the relationships and the weight/strength of the relationship.
In this study, the following novel criteria were established to transform the raw data into a suitable database to carry out the aggregated network analysis: i) each outcome was a node. Then, three types of edges were defined: i) each connection/line between outcomes without arrowheads was an undirected edge with a weight of two; ii) each connection/line between outcomes with one arrowhead was a directed edge with a weight of two, and iii) outcomes grouped within a circle were assigned an undirected edge with a weight of one. The graphical input and simultaneous verbalisation were used to reconstruct the edges and weights if the raw data was unclear (Stork and Richards Citation1992).
The network analysis was carried out using the open-source software Gephi (Bastian, Heymann, and Jacomy Citation2009). Gephi provides an interface to explore and manipulate the networks. The ForceAtlas2 (FA2) algorithm was selected for this study due to the high degree of continuous manipulation of elements such as repulsion, inertia, and stabilisation. Compare to others algorithms (e.g. Yinfan HU, Fruchtermand-Reingold and LinLong), FA2 performs well in small to large networks, has a better-measured quality and it is easier to identify the clusters (Jacomy et al. Citation2014). Therefore, FA2 was a suitable option for this study to explore new communities in small to medium networks.
The network measures degree, closeness and betweenness, were calculated as part of this analysis. Each of these measures and their meaning on the graph is described in .
Table 3. The three network measures calculated in this study.
The visualisations were produced using Gephi and edited in Adobe Illustrator software to improve the readability of labels and colour contrast between nodes.
In the case of the information from the interviews and simultaneous verbalisation, a content analysis was conducted using a hybrid (deductive-inductive) approach (Elo and Kyngäs Citation2008) (). An initial analysis matrix was defined using the network analysis to gather the content in a deductive way. This means that the outcomes that rank high in any network measures () will be included in the matrix. Then, the audio recording will be analysed to identify information about those outcomes that could help expand the perceptions and meaning of them. However, the grouping, categorisation and abstraction phases were conducted using the inductive approach called Affinity Diagrams. For conducting this technique, findings are clustered according to relationships such as similarity, dependence, and proximity, among others (Moggridge Citation2007). This technique is more experiential driven and allows identifying overarching and abstract themes (Haskins Lisle, Merenda, and Gabbard Citation2020).
Figure 3. The process conducted for the content analysis (Based on Elo and Kyngäs Citation2008).
3.7. Ethics
The Ethics Sub-Committee granted full ethical approval for Human Participants of Loughborough University.
4. Results
4.1. Performance of the participants and descriptive data
Reflections from step 6 of the process were analysed to identify actions about how participants engaged with the method. Patients were observed to be able to contextualise the mapping task to their everyday life experiences easily. On the other hand, providers preferred to select a project as a guide to conduct the mapping. The researcher ensured that all selected projects were chronic-care related. Patients' sessions were up to 1.5 hours long due to the detail and anecdotal data they provided during the mapping process. In all cases, at least half of the session was spent on the mapping task (steps 2–5).
Initial descriptive data were identified from the individual outcome-based maps (). Providers used between thirteen to twenty-seven outcomes in each map (average 18), while patients used between fourteen to twenty-five per map (average of 20). The white tokens represent the new outcomes included by the participants.
Figure 4. Examples of individual outcome-based maps from a) providers and b) patients.
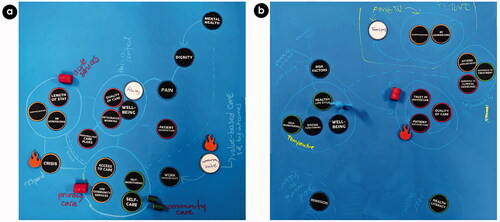
shows the outcomes that were used the most on the maps. Wellbeing and quality of life were included in most of the maps, 18 and 17 of 21 maps, respectively; these two outcomes were the most prioritised by both groups. Surprisingly, there were no other important coincidences among the rest of the outcomes between groups. Biometrics include specific-condition measures, such as HbA1c for diabetes or blood count for leukaemia. The rest of the prioritised outcomes are not listed because they were selected only once.
Following the criteria to construct the network, 889 edges were identified in the providers' maps and 690 edges in the patients’ maps. From these edges, two outcome-based network visualisations emerged from the network analysis.
These two outcome-based network visualisations are presented in the following sections, followed by a table synthesising major agreements, disagreements, and critical outcomes. Then, themes that emerged from the initial and final questions, as well as the verbalisation of the mapping process, are presented.
4.2. Aggregated outcome-based network visualisation – providers
The providers' outcome-based network visualisation shows how providers understand multiple outcome relationships (). The ten most relevant (considering the three main network measures) outcomes appear coloured. Each colour indicates a community of outcomes created by the network analysis; these communities grouped outcomes differently than in the initial groups presented in . The colours were assigned arbitrarily and did not have a specific meaning. The thickness of the lines represents the strength of the relationships. Outcomes without an edge (such as care at home or health literacy) appear on the map because there is a weak relationship with the outcomes in their surroundings.
Figure 5. Aggregated outcome-based network visualisations – Providers (closeness view).
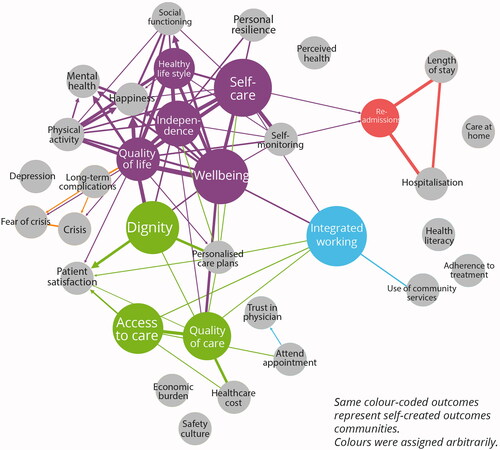
This network visualisation shows how outcomes such as integrated working or readmissions play a bridge role as they ranked high in the betweenness measure; as indicated by measure, this could mean that these outcomes have more control over the others. Community services and care at home are weakly integrated into the healthcare system. This can suggest a lack of appreciation/contribution to traditional external care settings. A similar weak interrelation exists between mental health outcomes, such as anxiety and depression.
Two of the most prioritised outcomes from the interviews, quality of care and wellbeing, were highlighted in the aggregated network visualisation, indicating particular importance. Interestingly, integrated working and self-care are some of the most critical outcomes (bigger node size), but they were not equally prioritised during the interview; only one provider selected integrated working as a priority.
4.3. Aggregated outcome-based network visualisation – patients
The outcome-based network visualisation for patients shows different outcome arrangements ().
Figure 6. Aggregated outcome-based network visualisations- Patients (closeness view).
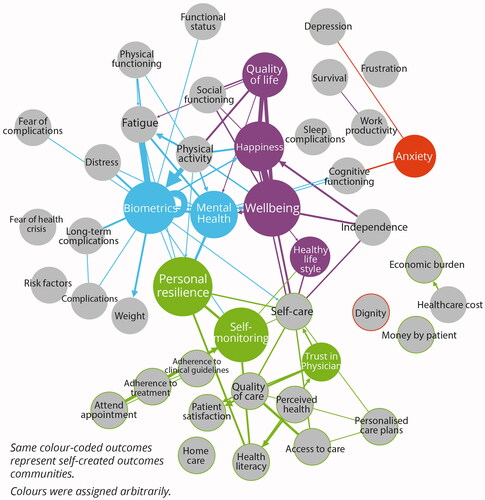
Overall, the network looks more compact and integrated; however, outcomes such as integrated working and readmissions, which are critical in providers’ visualisation, do not appear in this network. Similar to providers' network, new communities of outcomes were created and represented by different colours assigned arbitrarily.
In this aggregated network visualisation, personal resilience, wellbeing and self-monitoring are among the most critical. Other important outcomes, such as mental health, act as a bridge towards outcomes such as personal resilience. Interestingly, anxiety and depression are integrated, but neither is strongly connected with the rest of the network. Like providers’ visualisations, care at home and community services are weakly integrated, suggesting that patients do not perceive the importance of care settings.
4.4. Agreements, disagreements and critical outcomes
summarises the most critical outcomes and spot disagreements between providers and patients based on network measures such as degree, closeness, and betweenness. Three main network measures such as degree, closeness and betweenness have been selected to identify the critical outcomes. The top ten outcomes for each of these measures are presented in the external columns respectively for providers and patients; the outcomes considered critical for both groups of stakeholders are labelled as agreements and placed in the middle column. Finally, disagreements were identified based on the outcomes that are critical exclusively for each group but not for the other. The agreements and disagreements are based on the most critical outcomes; therefore, if an outcome appears as disagreement, this does not necessarily mean that it was not included at all by the opposite group of stakeholders.
Figure 7. Summary of main agreements and disagreements based on the main network measures.
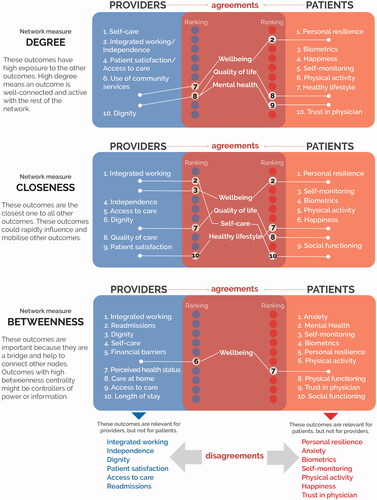
For example, personal resilience is critical for patients. It appears in the aggregated outcome-based network from the providers (); however, the size of the network dimension, the weight of the link, and colour show that personal resilience is not critical for providers. A remark to this finding is the fact that personal resilience refers to how providers perceived patients' personal resilience and did not refer to the personal resilience of the provider.
Wellbeing is the only outcome critical to both groups considering the three measures. This demonstrates that wellbeing influences most of the other outcomes rapidly and helps to connect different groups of outcomes. This can suggest that wellbeing may play an elevated role in the system purpose. On the contrary, this critical importance of wellbeing can be considered a risk since a failure to achieve wellbeing can compromise most of the other outcomes.
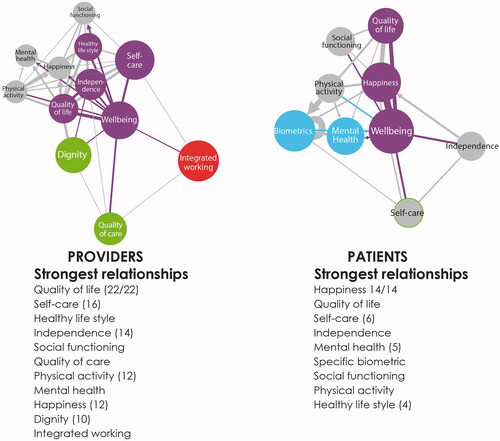
Exploring the critical outcomes in detail can be achieved by identifying the strongest outcome relationships. shows the strongest relationships of wellbeing with both the most critical outcomes (coloured) and some other outcomes (grey). The providers’ strongest relationship from wellbeing was made with quality of life, while the strongest patients' link from wellbeing was with happiness and quality of life. In addition, other related outcomes are present in both networks. For example, for providers, integrated working and dignity are essential, but wellbeing is more strongly related to the quality of life, self-care and healthy lifestyle. In the case of patients, wellbeing sustains stronger relationships with happiness and quality of life and does not relate to integrated working and dignity. This exemplifies how some stakeholders envisioned certain outcome connections and contributions differently while some other stakeholders reached a consensus. For example, there were clear agreements between stakeholders on the importance of quality of life that helped to connect diverse network structures to align the actions towards the overall purpose of wellbeing.
Figure 8. Wellbeing strongest relationships for providers and patients.
4.5. Participants’ feedback on the participatory outcome mapping
Feedback from participants during and after the mapping task was analysed, from which four themes emerged.
i. Outcomes to reconfigure systems comprehensively. This theme refers to the benefits spotted by participants about outcome-based mapping. By mapping outcomes, participants believed it could promote an ongoing learning practice to envision future impacts and assess potential scenarios:
“I like the fact that we can move things and create different configurations… like, ask the other, if for the patient that is the most important, how the (other) outcomes should change?”
ii. Challenge assumptions and trigger conflict-based conversations. Participants were also positive about how mapping a broad range of outcomes collectively may provoke discussions about stakeholders' disagreements. Far from being a problem, this was considered a benefit, as much of the time, those discussions are avoided, focussing only on agreements.
“This exercise will give us the ability to identify discrepancies in teams and to question why we think in that way… I would suggest bringing conflicting outcomes because certain groups are vandalising the data; for a small number of people, these (cost, financial outcomes) are important, but for the majority is this (wellbeing)”.
iii. Decision-making in systems thinking. Although participants did not have experience in systems theory, they spotted some systems properties and anticipated how this understanding could influence their decisions. Seeing the whole picture of healthcare systems made it harder to identify clear gains recognising everything is important.
“It is useful to break them down and look at those connections… Sometimes looking that (whole outcome-based maps) are necessary rather than looking at the pieces…" "Everything is important; I cannot choose only one aspect; I need to be concern about everything”.
iv. This dilemma needs to be handled during the mapping process, while facilitation is provided to avoid participants feeling overwhelmed during the decision-making process.
v. Performance of the mapping task. The mapping task triggered initial messy discussions, but the interaction with the outcome tokens helped refocus participants on the topic. However, participants recognised that they need support while drawing and that they probably would not be able to replicate the task on their own. Also, there were concerns about whether the final map could be misunderstood if explanations were not provided.
“The final map… I think potentially some people could interpret some of the things differently, but it makes sense to me”.
These four themes reflect critical impacts and considerations to be made when employing the participatory outcome mapping approach.
5. Discussion
This study aimed to develop and apply a participatory mapping method as a practical approach to collect, aggregate and visualise interrelations among multiple healthcare outcomes. The findings of this study showed that the outcome-based participatory mapping in combination with aggregated network visualisation and network analysis can provide in-depth insights into which outcomes matter to whom, how outcomes are interrelated, and how critical they are collectively. This study demonstrated the practicality of the outcome-based mapping approach in collecting, visualising and analysing interrelations among multiple healthcare outcomes. This approach allowed stakeholders to discuss meaningful outcomes and to put together a visual representation of how those priorities interact with and impact others. The aggregated network visualisation and network analysis provided comprehensive information to identify critical outcomes such as wellbeing that influence and connect with other outcomes among both groups of stakeholders. Also, discrepancies about the importance of personal resilience and anxiety (for patients) and integrated working and dignity (for providers) were identified.
The following sections present a discussion about the healthcare outcomes and the application of the method. Sections 5.1 and 5.2 focus on the findings of healthcare outcomes interrelations, while 5.3 and 5.4 cover the reflections about the method. The discussion concludes with the limitations of the study in section 5.5.
5.1. Understanding multi outcomes to develop healthcare systems
This study illustrated how different stakeholders prioritise outcomes differently, as demonstrated widely in literature (Baldeh et al. Citation2020; Guyatt et al. Citation2011; Woolf et al. Citation2012). This study aims to offer a new practical approach to understand, communicate, and integrate outcomes – a need that other studies (Akinluyi, Ison, and Clarkson Citation2019; Holden et al. Citation2013) have called for. This approach is supported by literature about the limitation of forecasting outcomes and recognises that outcomes in complex systems are unpredictable and unstable (Braithwaite et al. Citation2018). This study has provided a practical approach that aims to offer a more proactive and holistic role of outcomes in healthcare and fits within a systems thinking perspective.
The discrepancies among critical outcomes were highlighted only after the outcomes were analysed as an interrelated system using network analysis measures. Also, participants struggled to prioritise outcomes because they recognised the interdependencies among them through the maps (). These findings support the suggestion that outcomes need to be understood as interrelated elements to inform better and adapt systems (Flemming et al. Citation2019; Holden et al. Citation2013; Petticrew et al. Citation2019). Furthermore, these findings align with additional implications about how a multi-outcome approach may reconcile knowledge about how interventions influence outcomes (Akinluyi, Ison, and Clarkson Citation2019) and how outcomes could play a role with other systems elements. Nevertheless, integrating multiple outcomes increases the risk of attributing false effectiveness to an intervention (Heneghan, Goldacre, and Mahtani Citation2017).
Understanding and communicating outcomes as networks may also be beneficial for CWA and SEIPS. The six-step process can be implemented as a dialogical method to go in-depth in level two of CWA, which refers to values, priority measures and outcomes; then, critical outcomes from the network visualisations can take the place of the criteria and priority measures. Although the mapping process triggered discussion around values (part of level two of CWA), there are still some questions about whether values can be managed likewise as outcomes. The variety of outcomes (and sometimes values, goals or needs) included by the participants is supported by Naikar, Hopcroft, and Moylan (Citation2005, 36), who suggest that relations between purpose, values and outcomes and functions can be confusing, and all applications may be correct (pp. 25). Similarly, the consistency of the wellbeing outcomes with all the participants can align with the identification of wellbeing as a system purpose rather than an outcome (Naikar, Hopcroft, and Moylan Citation2005, 23). Further work is required to clarify these categories in both the outcome-based approach of this study and CWA.
Similarly, this practical outcome-based approach and network visualisations can be implemented in SEIPS to inform the feedback loops and adapt the system. Unlike the SEIPS model (Holden et al. Citation2013), this approach did not categorise outcomes according to stakeholders in advance. This approach proposes to maintain outcomes as neutral elements to encourage more democratic discussions, but it does agree that different stakeholders prioritise and make sense of outcomes differently. SEIPS can also be strengthened by including an understanding of values and purposes.
It is worth mentioning that some outcomes were articulated in a way that participants could assign a specific meaning and interpretation. For example, self-care could refer to the quantity or quality; participants orally clarified this distinction, but it is not explicitly communicated in the outcome-based network maps. This limitation should be further explored to be mitigated.
5.2. Lessons about outcomes from the aggregated network visualisations
The variety of outcomes from the outcome-based maps and participants’ feedback indicated how this approach might change the concept of outcomes. Outcomes from all the categories were consistently included in the maps, without a clear predominance of objective or subjective dimensions. Previous studies have established that a complex model of outcomes should include a variety of outcome dimensions and categories that considered the context and values of the stakeholders (Lowe Citation2013; Paterson et al. Citation2009). Still, it was ambiguous how different stakeholders make sense of this variety. This study filled this gap using the visualisation maps.
The results have shown a strong agreement about the importance of wellbeing, in both the initial descriptive data () and the network maps. Still, both groups struggled to articulate the meaning of wellbeing, which aligns with previous studies (Dooris, Farrier, and Froggett Citation2018). Providers indicated wellbeing is the ultimate goal of the healthcare system but never referred to their own wellbeing, while patients attempted to relate it with a whole life ongoing search. Wellbeing is a complex thing in itself, consisting of subjective (e.g. happiness) and objective (measurable) wellbeing. The broadness of this concept and its meanings for different people may explain why participants considered it important, and consequently, wellbeing ranked high in all the measures. Nevertheless, wellbeing can be conceptualised in this study by looking at the outcome relationships in both visualisations. Although both groups indicated the strongest relationships with similar outcomes (), the inclusion of dignity and integrated working may suggest functions to support patients' wellbeing. Unexpectedly, patients mentioned the influence of biometrics (objective measures) on their wellbeing; however, they also expressed a low self-monitoring behaviour, which may suggest that subjective perceptions of biometrics are integrated as part of a monitoring plan.
The main disagreements were identified in outcomes such as integrated working that rank high with providers, but it was irrelevant for patients. Integrated working has been added to the agenda of national healthcare systems, such as the National Health Service (NHS) in the UK. The inclusion of integrated working aims to provide better care, reduce duplication of work and improve communication across different levels of care settings, including health and social care (Warwick-Giles and Checkland Citation2018). Although providers identified the importance of integrated working for building working relationships, they pointed out that struggles with collaboration among organisations and the inclusion of patients are a consistent barrier (). This highlights the fragile integration of community services with the wider system, which still seems like an external agent for both patients and providers. Patients should be consciously included in this integration to trigger collaboration that influences the wider system (Khan et al. Citation2018). Another disagreement was found with the relevance of personal resilience. Patients expressed that personal resilience helped them to overcome crises and low moments of their care. Personal resilience was highly related to mental health and self-monitoring; surprisingly, it was not related to wellbeing as established in previous literature (La Placa, McNaught, and Knight Citation2013). While resilience has been studied widely as an attribute of systems to overcome disruptions/changes, these results suggest that providers may not perceive how personal (social) resilience may influence whole system behaviour. This finding may support others who identified a low understanding of individual/social resilience among different stakeholders (Taysom and Crilly Citation2017). Even further, this suggests that bridge outcomes such as mental health can leverage other outcomes such as resilience, and more attention should be made to integrate them. This is an important finding that can also highlight that we cannot assume providers may be aware of all the patients' priorities.
Table 4. Summary of most used and prioritised outcomes.
The network analysis identified critical but weakly related outcomes such as readmissions and anxiety. The providers’ network visualisation shows the mid-strong relationships among readmissions, length of stay and hospitalisations; however, only weak links with self-care and self-monitoring exist. In the patients' network visualisation, a similar pattern occurs with anxiety, which, despite its importance, it is only related to depression and cognitive functioning. These findings may suggest that weakly integrated outcomes are perceived as poorly attended/supported holistically.
5.3. Communicating multiple outcomes: the power of network visualisations
The discussion mentioned above of the outcome findings is not exhaustive; it exemplifies how the network analysis provides a strategy to holistically understand outcomes. Some recent studies have applied network analysis in healthcare system analysis for various purposes using novel allocations of nodes and edges (Benhiba, Loutfi, and Idrissi Citation2017). For example, emergency pathways were used to construct emergency services networks by assigning patient locations as nodes and patient transfers as edges. Edges were weighted considering the type of pathways and the frequency of transfer (Kohler and Ercole Citation2020). Different network measures such as betweenness centrality were especially meaningful to identify outcomes that construct a bridge; however, these outcomes may have a significant impact on the integration and functioning of the system if they are unattended. The interactive measures of the networks and the high degree of the manipulation of the software fostered zoom-in into specific outcomes (sub-networks) to expand the information about them.
There are still some challenges and unsolved questions around applying network analysis. Initial comparisons between providers and patients can be made just by scanning the network visualisations. This study employed hierarchies of the most significant network measures () to compare the network visualisations based on previous studies that have employed Venn diagrams or tables (Burns, Bisantz, and Roth Citation2004; St-Maurice and Burns Citation2018). However, a more sophisticated and accurate comparison technique such as node projection (Li, Yang, and Hadden Citation2009) may reduce the time spent in this task and increase the precision of the similarities and discrepancies identified. While the network analysis offered more rigour to analyse visual data, the time and expertise needed may exceed the skills of the healthcare community of practice. Therefore, other analysis techniques (e.g. affinity diagramming) mays still be explored for encouraging and initial thinking through practical applications.
Although complex systems visualisations such networks could become effective for synthesising a high density of data, their practical analysis/use in everyday decision-making remains a challenge. Consistent with the literature (Jones and Bowes Citation2017; Jun, Kim, and Lee Citation2011), participants of this study were confident in managing/explaining their maps. This triggered in-depth comprehension of complex and abstract situations, set a shared understanding and helped to coproduce new knowledge linked with evidence and experiences. However, participants declared that understanding other peoples' maps could be challenging. While the final individual outcome-based maps () share similarities with relational diagrams, the group results were synthesised as network visualisations ( and ), which may include attributes that participants per se may not recognise. Therefore, it may be advisable that outcome-based maps are always co-created with a diversity of relevant stakeholders and sustaining their participation during analysis and refinement. This co-generation will promote the construction of knowledge that reflect their reality without imposing structures of hierarchy or control (Buckley and Waring Citation2013). Additionally, visualisations (both the individual as the network visualisations) should be perceived as interactive/dynamic models subject to change that reflects their interests and concerns (Jones and Bowes Citation2017) and facilitate ongoing dialogue and negotiation (Freebairn et al. Citation2017).
Finally, it is worth mentioning how networks measures identified critical outcomes that otherwise would remain overlooked. Participants easily expressed the importance of wellbeing and quality of life (), which was confirmed by the network analysis. However, outcomes such as self-care and access to care were spotted in the providers’ network, but participants did not mention them. Similar examples occur with self-monitoring and anxiety on the patients’ side. This may suggest that the novel proposal of these outcome-based network maps reveals and communicates tacit knowledge about outcomes; this can help providers identify priorities they were not aware of. This could provide more comprehensive feedback mechanisms to inform the development and operational processes. First, by identifying/negotiating desirable and expected impacts and potentially providing dynamic and comprehensive outcome-related information. According to Holden et al. (Citation2013), this information can adjust and balance healthcare systems and compensate less desirable or difficult to change attributes. This application and benefit distinguish this method from other outcomes-related methods.
5.4. Gathering multiple outcomes: the use of a graphic facilitation technique
This practical approach provides a mechanism for different stakeholders to communicate their priorities, promoting a systems thinking approach. Similar to other benefits found in previous studies (Comi, Bischof, and Eppler Citation2014; Crilly, Blackwell, and Clarkson Citation2006), the graphic facilitation technique allowed the participants and researcher to establish a good rapport, build a common language, structure complex relationships of data and encourage contribution from interviewees in general. However, during the pilot sessions, challenges such as the low proactiveness and confidence of participants to draw and data analysis were consistent with Shannon-Baker and Edwards (Citation2018) results. Thus, researchers wishing to use this method are expected to assist participants with this visual task. Despite those challenges, it is believed that graphic facilitation techniques and open mapping methods offer the best mechanisms to construct and understand multiple outcomes.
Boundary objects were used to facilitate the process and focus the mapping on specific systems elements. The outcome tokens were an easy-to-understand and familiar element that participants felt confident to manipulate. Due to the lack of a specific definition of each, the outcome tokens took the role of a dialectical device (Eden Citation1994) to negotiate trade-offs and build common ground for power distribution.
This method has been applied in participatory settings (Landa-Avila et al. Citation2018, Citation2020) with overall positive results about the facilitation. Although participatory sessions can facilitate a higher sense of collaboration and understanding, healthcare collaboration is restricted due to tight schedules. Thus, this one-to-one method can be a good initial strategy to overcome the challenges in those limited-time situations. Overall, this method can be used in combination with others that already deal with outcomes, such as CWA, the Outcome Identification Loop (Akinluyi, Ison, and Clarkson Citation2019) and the System Scenarios Tool (Hughes et al. Citation2017); as the information that emerges from this method will offer a novel understanding of outcomes interrelations, far from the linear approach.
5.5. Limitations
A limitation of this study is the differences among participants. Patients living with different chronic conditions share more similar healthcare experiences, and therefore the mapping process was situated in more similar contexts. However, providers referred to more diverse projects during the interview. Whether possible, a mitigation strategy was conducted to try to homogenise the selected projects. The sample size somehow limits the possibility of sub-categorising the results according to specific providers' expertise/project; similarly, there was no clinician involvement in this study that could bring other perspectives. These limitations may affect the deepness of insights about the different outcomes. Nonetheless, the apparent dissonance of the group of stakeholders included is also a novelty and strength of this study, which served to explore apparently extreme values perspectives.
In addition, the list of outcomes may not have included much regarding care experience, which could have affected that the participants did not discuss this aspect in depth. However, participants were always promoted to include new outcomes if needed. This limitation needs to be further reflected, as the method needs to trade-off between the number of outcomes included without overwhelming the participants.
Another limitation is that the application of network analysis should still be considered exploratory. Although network analysis is a mature analysis technique in other contexts that usually employ other elements as nodes, the process to construct the networks used in this study still needs further verification and reliability with more data. For example, future work could include analysing variation between groups to quantify consensus and dissonance more robustly. Similarly, this study only presents the use of this approach without using it in conjunction with other approaches. This limits the conclusions we can make about the benefits of combining them. Future studies can compare this method with others and strengthen the evidence about why outcomes are explored in this method in a novel way.
6. Conclusion
This study developed and applied a practical approach to understanding multiple healthcare outcomes as part of a systems development process. The mapping processes proved to be beneficial for collecting and discussing outcomes as interrelated systems elements. The network analysis provided a powerful resource to aggregate and identify critical outcomes; hence, it was possible to determine how both providers and patients converge in identifying wellbeing as a critical and meaningful overarching goal. Although wellbeing was poorly described for participants, the network provides detailed information about related outcomes that increase its understanding. Nevertheless, outcomes such as integrated working and personal resilience need to be negotiated between stakeholders as these represented some of the main differences in outcomes prioritisation.
This approach will prove useful in expanding the understanding of how multiple healthcare outcomes can be integrated into a systems thinking development process. HFE and healthcare practitioners may benefit from implementing this approach to gather and synthesise different stakeholder perspectives and adapt interventions. This approach may also complement other systems frameworks such as CWA and SEIPS. These frameworks may find this approach useful to clarify element definitions such as purpose and values. Finally, this paper also contributes to the visual method literature by providing a structure and replicable process for both data collection and analysis. A natural progression of this research can explore how this approach facilitates outcome negotiation among different stakeholders. It could also expand and clarify the concept of some outcome-related concepts such as purpose, values and goals.
This outcome-based mapping approach aims to advance the framing of healthcare systems, bringing systems thinking and participation together. Outcomes have proved to be a pivotal element to co-create systems in an abstract level that removes problem-solving tendencies and focuses on accommodating multiple stakeholders' visions, understanding interrelations and definition of trade-offs without compromising human values. This approach looks for integration with other ergonomics and design methods to strengthen its application, which can lead to defining more robust systems requirements for the co-creation of holistic healthcare systems.
Acknowledgements
The authors thank all the participants for sharing their experiences. To mom(†) with love.
Disclosure statement
No potential conflict of interest was reported by the author(s).
Additional information
Funding
References
- Ackoff, R. L. 1994. “Systems Thinking and Thinking Systems.” System Dynamics Review 10 (2–-3): 175–188. doi:https://doi.org/10.1002/sdr.4260100206.
- Akinluyi, E. A., K. Ison, and P. J. Clarkson. 2019. “Mapping Outcomes in Quality Improvement and System Design Activities: The Outcome Identification Loop and System Impact Model.” BMJ Open Quality 8 (3): e000439. doi:https://doi.org/10.1136/bmjoq-2018-000439.
- Arksey, Hilary, and Lisa O’Malley. 2005. “Scoping Studies: Towards a Methodological Framework.” International Journal of Social Research Methodology 8 (1): 19–32. doi:https://doi.org/10.1080/1364557032000119616.
- Baldeh, Tejan, Zuleika Saz-Parkinson, Paola Muti, Nancy Santesso, Gian Paolo Morgano, Wojtek Wiercioch, Robby Nieuwlaat, Axel Gräwingholt, Mireille Broeders, Stephen Duffy, Solveig Hofvind, Lennarth Nystrom, Lydia Ioannidou-Mouzaka, Sue Warman, Helen McGarrigle, Susan Knox, Patricia Fitzpatrick, Paolo Giorgi Rossi, Cecily Quinn, Bettina Borisch, Annette Lebeau, Chris de Wolf, Miranda Langendam, Thomas Piggott, Livia Giordano, Cary van Landsveld-Verhoeven, Jacques Bernier, Peter Rabe, and Holger J. Schünemann. 2020. “Development and Use of Health Outcome Descriptors: A Guideline Development Case Study.” Health and Quality of Life Outcomes 18 (1): 167. doi:https://doi.org/10.1186/s12955-020-01338-8.
- Bastian, M., S. Heymann, and M. Jacomy. 2009. “Gephi: An Open Source Software for Exploring and Manipulating Networks.” Third International AAAI Conference on Weblogs and Social Media, San Jose, California (17-20 May). 361–362. doi:https://doi.org/10.1136/qshc.2004.010033.
- Benhiba, L., A. Loutfi, and M. A. J. Idrissi. 2017. “A Classification of Healthcare Social Network Analysis Applications.” HEALTHINF 2017 – 10th International Conference on Health Informatics, Proceedings; Part of 10th International Joint Conference on Biomedical Engineering Systems and Technologies, BIOSTEC, 5: 147–158. doi:https://doi.org/10.5220/0006168001470158.
- Black, N., L. Burke, C. B. Forrest, U. H. Ravens Sieberer, S. Ahmed, J. M. Valderas, S. J. Bartlett, and J. Alonso. 2016. “ Patient-Reported Outcomes: Pathways to Better Health, Better Services, and Better Societies.” Quality of life Research 25 (5): 1103–1112. doi:https://doi.org/10.1007/s11136-015-1168-3.
- Blessing, L. T. M., and A. Chakrabarti. 2009. “DRM, a Design Research Methodology”. Vol. 1. London: Springer. doi:https://doi.org/10.1007/978-1-84882-587-1.
- Bombard, Y., G. R. Baker, E. Orlando, C. Fancott, P. Bhatia, S. Casalino, K. Onate, J.-L. Denis, and M.-P. Pomey. 2018. “Engaging Patients to Improve Quality of Care: A Systematic Review.” Implementation Science 13 (1): 98. doi:https://doi.org/10.1186/s13012-018-0784-z.
- Braithwaite, J., K. Churruca, J. C. Long, L. A. Ellis, and J. Herkes. 2018. “When Complexity Science Meets Implementation Science: A Theoretical and Empirical Analysis of Systems Change.” BMC Medicine 16 (1): 63. doi:https://doi.org/10.1186/s12916-018-1057-z.
- Buckley, C. A., and M. J. Waring. 2013. “Using Diagrams to Support the Research Process: Examples from Grounded Theory.” Qualitative Research 13 (2): 148–172. doi:https://doi.org/10.1177/1468794112472280.
- Burns, C. M., A. M. Bisantz, and E. M. Roth. 2004. “Lessons from a Comparison of Work Domain Models: Representational Choices and Their Implications.” Human Factors 46 (4): 711–727. doi:https://doi.org/10.1518/hfes.46.4.711.56810.
- Carayon, P., A. Schoofs Hundt, B. T. Karsh, A. P. Gurses, C. J. Alvarado, M. Smith, and P. F. Brennan. 2006. “Work System Design for Patient Safety: The SEIPS Model.”. Quality and Safety in Health Care 15, (SUPPL. 1): 50–58. doi:https://doi.org/10.1136/qshc.2005.015842.
- Carayon, Pascale, A. Wooldridge, P. Hoonakker, A. S. Hundt, and M. M. Kelly. 2020. “SEIPS 3.0: Human-Centered Design of the Patient Journey for Patient Safety.” Applied Ergonomics 84: 103033. doi:https://doi.org/10.1016/j.apergo.2019.103033.
- Comi, A., N. Bischof, and M. J. Eppler. 2014. “Beyond Projection: Using Collaborative Visualization to Conduct Qualitative Interviews.” Qualitative Research in Organizations and Management 9 (2): 110–133. doi:https://doi.org/10.1108/QROM-05-2012-1074.
- Crilly, N., A. F. Blackwell, and P. J. Clarkson. 2006. “Graphic Elicitation: Using Research Diagrams as Interview Stimuli.” Qualitative Research 6 (3): 341–366. doi:https://doi.org/10.1177/1468794106065007.
- Davies, H. T. O., and I. K. Crombie. 1997. “Interpreting Health Outcomes.” Journal of Evaluation in Clinical Practice 3 (3): 187–199. doi:https://doi.org/10.1046/j.1365-2753.1997.00003.x.
- Dooris, M., A. Farrier, and L. Froggett. 2018. “Wellbeing: The Challenge of ‘Operationalising’ an Holistic Concept within a Reductionist Public Health Programme.” Perspectives in Public Health 138, (2): 93–99. doi:https://doi.org/10.1177/1757913917711204.
- Earl, S., F. Carden, and T. Smutylo. 2001. Outcome Mapping. IDRC. Ottawa.
- Eden, C. 1994. “Cognitive Mapping and Problem Structuring for System Dynamics Model Building.” System Dynamics Review 10 (2–3): 257–276. doi:https://doi.org/10.1002/sdr.4260100212.
- Elo, S., and H. Kyngäs. 2008. “The Qualitative Content Analysis Process.” Journal of Advanced Nursing 62 (1): 107–115. doi:https://doi.org/10.1111/j.1365-2648.2007.04569.x.
- Flemming, K., A. Booth, R. Garside, Ö. Tunçalp, and J. Noyes. 2019. “Qualitative Evidence Synthesis for Complex Interventions and Guideline Development: Clarification of the Purpose, Designs and Relevant Methods.” BMJ Global Health 4 (Suppl 1): e000882. doi:https://doi.org/10.1136/bmjgh-2018-000882.
- Freebairn, L., L. Rychetnik, J. A. Atkinson, P. Kelly, G. McDonnell, N. Roberts, C. Whittall, and S. Redman. 2017. “Knowledge Mobilisation for Policy Development: Implementing Systems Approaches through Participatory Dynamic Simulation Modelling.” Health Research Policy and Systems 15 (1): 83. doi:https://doi.org/10.1186/s12961-017-0245-1.
- Gear, C., E. Eppel, and J. Koziol-Mclain. 2018. “Utilizing Complexity Theory to Explore Sustainable Responses to Intimate Partner Violence in Health Care.” Public Management Review 20 (7): 1052–1067. doi:https://doi.org/10.1080/14719037.2017.1364407.
- Greenhalgh, J. 2009. “The Applications of PROs in Clinical Practice: What Are They, Do They Work, and Why??” Quality of life Research18 (1): 115–123. doi:https://doi.org/10.1007/s11136-008-9430-6.
- Guyatt, G. H., A. D. Oxman, R. Kunz, D. Atkins, J. Brozek, G. Vist, P. Alderson, P. Glasziou, Y. Falck-Ytter, and H. J. Schünemann. 2011. “GRADE Guidelines: 2. Framing the Question and Deciding on Important Outcomes.” Journal of Clinical Epidemiology 64 (4): 395–400. doi:https://doi.org/10.1016/j.jclinepi.2010.09.012.
- Haskins Lisle, A., C. Merenda, and J. Gabbard. 2020. “Using Affinity Diagramming to Generate a Codebook: A Case Study on Young Military Veterans and Community Reintegration.” Qualitative Research 20 (4): 396–413. doi:https://doi.org/10.1177/1468794119851324.
- Havlin, S., D. Y. Kenett, E. Ben-Jacob, A. Bunde, R. Cohen, H. Hermann, J. W. Kantelhardt, J. Kertész, S. Kirkpatrick, J. Kurths, J. Portugali, and S. Solomon. 2012. “Challenges in Network Science: Applications to Infrastructures, Climate, Social Systems and Economics.” European Physical Journal Special Topics 214 (1): 273–293. doi:https://doi.org/10.1140/epjst/e2012-01695-x.
- Heneghan, C., B. Goldacre, and K. R. Mahtani. 2017. “Why Clinical Trial Outcomes Fail to Translate into Benefits for Patients.”. Trials 18, (1): 122. doi:https://doi.org/10.1186/s13063-017-1870-2.
- Holden, R. J., P. Carayon, A. P. Gurses, P. Hoonakker, A. S. Hundt, A. A. Ozok, and A. J. Rivera-Rodriguez. 2013. “SEIPS 2.0: A Human Factors Framework for Studying and Improving the Work of Healthcare Professionals and Patients.” Ergonomics 56 (11): 1669–1686. doi:https://doi.org/10.1080/00140139.2013.838643.
- Hughes, H. P. N., C. W. Clegg, L. E. Bolton, and L. C. Machon. 2017. “Systems Scenarios: A Tool for Facilitating the Socio-Technical Design of Work Systems.” Ergonomics 60 (10): 1319–1335. doi:https://doi.org/10.1080/00140139.2017.1288272.
- Jacomy, M., T. Venturini, S. Heymann, and M. Bastian. 2014. “ForceAtlas2, a Continuous Graph Layout Algorithm for Handy Network Visualization Designed for the Gephi Software.” PLOS One 9 (6): e98679. doi:https://doi.org/10.1371/journal.pone.0098679.
- Jones P. H. 2014. “Systemic Design Principles for Complex Social Systems.” In Social Systems and Design. Translational Systems Sciences, edited by G. Metcalf, vol 1. Tokyo: Springer. doi:https://doi.org/10.1007/978-4-431-54478-4_4.
- Jones, P., and J. Bowes. 2017. “Rendering Systems Visible for Design: Synthesis Maps as Constructivist Design Narratives.” She Ji: The Journal of Design, Economics, and Innovation 3 (3): 229–248. doi:https://doi.org/10.1016/j.sheji.2017.12.001.
- Jun, S., M. Kim, and J. Lee. 2011. “The System Diagrams: Shifting Perspectives.” Design Issues 27 (2): 72–89. doi:https://doi.org/10.1162/DESI_a_00078-Jun.
- Khan, S., A. Vandermorris, J. Shepherd, J. W. Begun, H. J. Lanham, M. Uhl-Bien, and W. Berta. 2018. “Embracing Uncertainty, Managing Complexity: Applying Complexity Thinking Principles to Transformation Efforts in Healthcare Systems.”BMC Health Services Research 18, (1): 192. doi:https://doi.org/10.1186/s12913-018-2994-0.
- Kohler, K., and A. Ercole. 2020. “Can Network Science Reveal Structure in a Complex Healthcare System? A Network Analysis Using Data from Emergency Surgical Services.” BMJ Open 10 (2): e034265. doi:https://doi.org/10.1136/bmjopen-2019-034265.
- La Placa, V., A. McNaught, and A. Knight. 2013. “Discourse on Wellbeing in Research and Practice.” International Journal of Wellbeing 3 (1): 116–125. doi:https://doi.org/10.5502/ijw.v3i1.7.
- Landa-Avila, I. C., C. Escobar-Tello, G. T. Jun, and R. Cain. 2020. “A Holistic Outcome-Based Approach to Co-Create Healthcare Systems.” In DRS 2020 International Conference: Sinergy, edited by S. Boess, M. Cheung, & R. Cain, 1366–1391. Brisbane, Australia: Design Research Society. doi:https://doi.org/10.21606/drs.2020.127.
- Landa-Avila, I. C., G. T. Jun, R. Cain, and M. C. Escobar Tello. 2018. “Holistic Outcome-Based Visualisations for Defining the Purpose of Healthcare System.” In Relating System Thinking and Design (RSD7) 2018 Symposium, edited by S. Barbero, 300–314. Turin, Italy: Systemic Design Association.
- Lewis, G., and H. Killaspy. 2014. “Getting the Measure of Outcomes in Clinical Practice.” Advances in Psychiatric Treatment 20 (3): 165–171. doi:https://doi.org/10.1192/apt.bp.113.011809.
- Li, W., J. Y. Yang, and W. C. Hadden. 2009. “Analyzing Complex Networks from a Data Analysis Viewpoint.”. Europhysics Letters 88, (6): 68007. doi:https://doi.org/10.1209/0295-5075/88/68007.
- Lowe, T. 2013. “New Development: The Paradox of Outcomes—the More we Measure, the Less we Understand.” Public Money & Management 33 (3): 213–216. doi:https://doi.org/10.1080/09540962.2013.785707.
- McConachie, H., N. Livingstone, C. Morris, B. Beresford, A. Le Couteur, P. Gringras, D. Garland, G. Jones, G. Macdonald, K. Williams, and J. R. Parr. 2018. “Parents Suggest Which Indicators of Progress and Outcomes Should be Measured in Young Children with Autism Spectrum Disorder.” Journal of Autism and Developmental Disorders 48 (4): 1041–1051. doi:https://doi.org/10.1007/s10803-017-3282-2.
- Moggridge, B. 2007. Designing Interactions. Cambridge: MIT Press. https://ellieharmon.com/wp-content/uploads/01-21-Moggridge-People.pdf.pdf
- Naikar, N. 2017. “Cognitive Work Analysis: An Influential Legacy Extending beyond Human Factors and Engineering.” Applied Ergonomics 59 (Pt B): 528–540. doi:https://doi.org/10.1016/j.apergo.2016.06.001.
- Naikar, N., R. Hopcroft, and A. Moylan. 2005. Work Domain Analysis: Theoretical Concepts and Methodology. Defence Science and Technology Report, 104. https://apps.dtic.mil/dtic/tr/fulltext/u2/a449707.pdf
- Newman, M. E. J. 2003. “The Structure and Function of Complex Networks.” SIAM Review 45 (2): 167–256. doi:https://doi.org/10.1137/S003614450342480.
- Paina, L., and D. H. Peters. 2012. “Understanding Pathways for Scaling up Health Services through the Lens of Complex Adaptive Systems.” Health Policy and Planning 27 (5): 365–373. doi:https://doi.org/10.1093/heapol/czr054.
- Paterson, C., C. Baarts, L. Launsø, and M. J. Verhoef. 2009. “Evaluating Complex Health Interventions: A Critical Analysis of the “‘Ooutcomes’ Concept”.” BMC Complementary and Alternative Medicine 9 (1): 18. doi:https://doi.org/10.1186/1472-6882-9-18.
- Paz-Ybarnegaray, R., and B. Douthwaite. 2017. “Outcome Evidencing: A Method for Enabling and Evaluating Program Intervention in Complex Systems.” American Journal of Evaluation 38 (2): 275–293. doi:https://doi.org/10.1177/1098214016676573.
- Peters, D. H. 2014. “The Application of Systems Thinking in Health: Why Use Systems Thinking??” Health Research Policy and Systems 12 (1): 51. doi:https://doi.org/10.1186/1478-4505-12-51.
- Petticrew, M., C. Knai, J. Thomas, E. A. Rehfuess, J. Noyes, A. Gerhardus, J. M. Grimshaw, H. Rutter, and E. McGill. 2019. “Implications of a Complexity Perspective for Systematic Reviews and Guideline Development in Health Decision Making.” BMJ Global Health 4 (Suppl 1): e000899. doi:https://doi.org/10.1136/bmjgh-2018-000899.
- Prell, C. 2012. Social Network Analysis. London: SAGE Publications Ltd.
- Rasmussen, J., A. M. Pejtersen, and L. P. Goodstein. 1994. Cognitive Systems Engineering. New York, USA: John Wiley Sons Inc. https://dl.acm.org/citation.cfm?id=179248
- Read, G. J. M., P. M. Salmon, N. Goode, and M. G. Lenné. 2018. “A Sociotechnical Design Toolkit for Bridging the Gap between Systems-Based Analyses and System Design.” Human Factors and Ergonomics in Manufacturing & Service Industries 28 (6): 327–341. doi:https://doi.org/10.1002/hfm.20769.
- Read, G. J. M., P. M. Salmon, M. G. Lenné, and D. P. Jenkins. 2015. “Designing a Ticket to Ride with the Cognitive Work Analysis Design Toolkit.” Ergonomics 58 (8): 1266–1286. doi:https://doi.org/10.1080/00140139.2015.1013576.
- Read, G. J. M., P. M. Salmon, M. G. Lenné, and N. A. Stanton. 2015. “Designing Sociotechnical Systems with Cognitive Work Analysis: Putting Theory Back into Practice.” Ergonomics 58 (5): 822–851. doi:https://doi.org/10.1080/00140139.2014.980335.
- Reuben, D. B., and M. E. Tinetti. 2012. “Goal-Oriented Patient Care — An Alternative Health Outcomes Paradigm.” New England Journal of Medicine 366 (9): 777–779. doi:https://doi.org/10.1056/NEJMp1113631.
- Sajtos, L., M. Kleinaltenkamp, and J. Harrison. 2018. “Boundary Objects for Institutional Work across Service Ecosystems.” Journal of Service Management 29 (4): 615–640. doi:https://doi.org/10.1108/JOSM-01-2017-0011.
- Sevaldson, B. 2015. “Gigamaps: Their Role as Bridging Artefacts and a New Sense Sharing Model.” Proceedings of Relating Systems Thinking and Design (RSD4) 2015 Symposium, Banff, Canada, September 1–3, 2015, 1–11. https://app.box.com/s/tsj7ewtcy9dr63knf64tvo3yrepmzdov.
- Shannon-Baker, P., and C. Edwards. 2018. “The Affordances and Challenges to Incorporating Visual Methods in Mixed Methods Research.” American Behavioral Scientist 62 (7): 935–955. doi:https://doi.org/10.1177/0002764218772671.
- Star, S. L. 2010. “This is Not a Boundary Object: Reflections on the Origin of a Concept.” Science, Technology, & Human Values 35 (5): 601–617. doi:https://doi.org/10.1177/0162243910377624.
- Star, S. L., and J. R. Griesemer. 1989. “Institutional Ecology, ‘Translations’ and Boundary Objects: Amateurs and Professionals in Berkeley’s Museum of Vertebrate Zoology, 1907–39.” Social Studies of Science 19 (3): 387–420. doi:https://doi.org/10.1177/030631289019003001.
- St-Maurice, J. D., and C. M. Burns. 2018. “Using Cognitive Work Analysis to Compare Complex System Domains.” Theoretical Issues in Ergonomics Science 19 (5): 553–577. doi:https://doi.org/10.1080/1463922X.2017.1406556.
- Stork, D., and W. D. Richards. 1992. “Nonrespondents in Communication Network Studies.” Group & Organization Management 17 (2): 193–209. doi:https://doi.org/10.1177/1059601192172006.
- Taysom, E., and N. Crilly. 2017. “Resilience in Sociotechnical Systems: The Perspectives of Multiple Stakeholders.” She Ji: The Journal of Design, Economics, and Innovation 3 (3): 165–182. doi:https://doi.org/10.1016/j.sheji.2017.10.011.
- The Health Foundation. 2011. “Complex Adaptive Systems.” Procedia Computer Science 6: 1–32.
- Warwick-Giles, L., and K. Checkland. 2018. “Integrated Care: Using “Sensemaking” to Understand How Organisations Are Working Together to Transform Local Health and Social Care Services.” Journal of Health Organization and Management 32 (1): 85–100. doi:https://doi.org/10.1108/JHOM-03-2017-0057.
- Wilkin, D., L. Hallam, and M.-A. Doggett. 1993. Measures of Need and Outcome for Primary Health Care. Oxford: Oxford University Press.
- Wilson-Grau, R., and H. Britt. 2012. “Outcome Harvesting.” Ford Foundation, May 25. www.fordfoundation.org
- Woolf, S., H. J. Schünemann, M. P. Eccles, J. M. Grimshaw, and P. Shekelle. 2012. “Developing Clinical Practice Guidelines: Types of Evidence and Outcomes; Values and Economics, Synthesis, Grading, and Presentation and Deriving Recommendations.” Implementation Science 7 (1): 61. doi:https://doi.org/10.1186/1748-5908-7-61.