
 ?Mathematical formulae have been encoded as MathML and are displayed in this HTML version using MathJax in order to improve their display. Uncheck the box to turn MathJax off. This feature requires Javascript. Click on a formula to zoom.
Abstract
All-terrain vehicle (ATV) crashes are among the leading causes of injury and death among youth in the agriculture industry. It is hypothesised that youth are involved in ATV-related incidents because they cannot effectively activate the vehicle’s controls. This study evaluated potential discrepancies between the required activation forces of the controls of fifty-four utility ATVs and the strength of male-and-female youth of varying ages (6–20 years old) and strength percentiles (5th, 50th, and 95th). The activation forces of the ATVs’ controls were measured experimentally, while the youth’s corresponding strength was retrieved from the literature. The results of this study demonstrated a physical mismatch between the forces required to operate ATV controls and youth’s strength. Turning the handlebar, pressing the footbrake, and pushing the ATV off are the most difficult tasks for ATV operation. These discrepancies compromise the youth’s ability to ride ATVs, increasing their risk of crashes.
Practitioner summary: Previous studies indicate that some youth engage in ATV incidents because they cannot activate the vehicle’s controls. We measured the forces required to operate eight ATV controls and compared them with the youth’s corresponding strength. Our results demonstrated physical mismatches between the forces required to operate ATV controls and the youth’s strength.
1. Introduction
Agriculture is the most dangerous industry for youth in the United States (U.S.) (Wright, Marlenga, and Lee Citation2013). From 2003 to 2010, among workers younger than 16 years, the number of worker fatalities in agriculture was consistently higher than in all non-agricultural industries combined (Wright, Marlenga, and Lee Citation2013).
Youth perform various farm tasks, including herding livestock, harvesting produce, and operating farm machinery, such as tractors and ATVs. Due to the physical limitations (e.g. strength, anthropometry, and field of vision) of youth, some work tasks could be riskier for them than adults, thus increasing their likelihood of being injured or killed. Several studies have shown a strong relationship between the injuries of youth and their ages, anthropometry, and developmental abilities (Hard and Myers Citation2006; Brison et al. Citation2006; Hendricks et al. Citation2005). In addition, the results of several studies showed that youth younger than 16 are not capable of safely operating agricultural tractors (Fathallah et al. Citation2008; Fathallah et al. Citation2009; Chang et al. Citation2010).
Based on the literature, one of the most common causes of U.S. farm injuries among youth in agricultural settings is farm machinery (NIOSH Citation2016), with ATVs being either the most frequently cited cause (Weichelt and Gorucu Citation2019; Hendricks and Hard Citation2019) or the second after tractors (Wright, Marlenga, and Lee Citation2013; Hendricks and Goldcamp Citation2010; National Children’s Center for Rural and Agricultural Health and Safety Citation2016). Hendricks and Goldcamp (Citation2010) reported ATVs as the primary source of vehicle injury for youth on farms, causing 63% of the vehicle-related injuries. According to Weichelt and Gorucu (Citation2019), ATVs were the leading cause of injury in agriculture among youth (individuals under 17 years of age) (Weichelt and Gorucu Citation2019). The number of reported fatalities and non-fatal injuries in the U.S. among youth caused by ATV on ‘AgInjuryNews.org’ were 52 and 26, respectively (Weichelt and Gorucu Citation2019). Over the years, ATV injuries have increased among farm youth (Wright, Marlenga, and Lee Citation2013; Bowman and Aitken Citation2010). Youth younger than 18 accounted for 36.8% of all ATV-related injuries, according to the data from the 2019 National Electronic Injury Surveillance System. Moreover, 15.3% of all those injuries occurred on farms or ranches (Wiener et al. Citation2022).
ATVs have narrow wheelbase, and high centre of gravity (Ayers et al. Citation2018; House et al. Citation2016), which make them unstable when traversing rough and uneven terrains or negotiating hills, which are commonly observed scenarios on farms and ranches (Chou, Khorsandi, and Vougioukas Citation2020). Utility ATVs and sports models (which include youth ATV models) have significant design differences. Utility models have higher ground clearance, stronger torque for hauling and towing, rear and front racks for carrying loads or mounting equipment, a hitch to pull implements, and higher weights (Khorsandi et al. Citation2021). In addition, utility models usually have a 12-V power plug, which is uncommon for sports models. For those reasons, utility ATVs are more suitable and more commonly used for farm tasks. As such, in this manuscript, we define the term agricultural (or ‘ag.’) ATVs as utility ATVs that are used on farms. Although some sports models can also be used on farms, this study focuses on the common utility ATVs.
Despite the compelling evidence showing that utility ATVs are unfit for youth, the most commonly used guidelines for ATV-youth fit to disregard the rider’s physical capabilities. Instead, those recommendations are mainly based on the rider’s age (American Academy of Pediatrics Citation2018), vehicle maximum speed (ANSI/SVIA Citation2017), vehicle engine size (CPSC Citation2006), and farm machinery training certificate (Garvey et al. Citation2008). For instance, youth as young as 14 are allowed to operate utility ATVs while employed on non-family-owned farms if they receive training through an accredited farm machinery safety program (Garvey et al. Citation2008). The National Safe Tractor and Machinery Operation Program (NSTMOP) is a project of Hazardous Occupations Safety Training in Agriculture for youth ages 14 and 15. The NSTMOP training includes tractor and ATV education. Students are certified after successfully passing a fifty-question written knowledge exam, as well as an operating skills test and a pre-op/driving test (Murphy Citation2020). However, these programs lack adequate coverage of specific ATV-related topics, such as active riding and physical matches of ATVs and youth.
It has been hypothesised that many ATV-related injuries occur because youth ride utility ATVs that are not fit for them (American Academy of Pediatrics Citation2018; Murphy and Harshman Citation2014; Shults et al. Citation2005; Dolan, Knapp, and Andres Citation1989; Anson, Segedin, and Jones Citation2009; Mattei et al. Citation2011; Scott, Dansey, and Hamill Citation2011). However, there is a lack of systematic and quantitative data comparing utility ATVs’ operational requirements and youth’s physical capabilities.
Considering that 95% of all ATV-related fatalities involving youth between 1985 and 2009 included utility vehicles (Denning, Harland, and Jennissen Citation2014), the purpose of this study is to evaluate the mismatches between the operational requirements of agricultural ATVs and the physical capabilities of youth.
To the best of our knowledge, the present study is the first comprehensive study that quantitatively evaluated the mismatches between the forces required to operate the controls of utility ATVs and youth’s strength. This study will provide objective evidence to assist in developing evidence-based recommendations for youth regarding the safe operation of utility ATVs. In the absence of such evidence, prior recommendations for ATV operation have been made, largely, based on the rider’s minimum age (American Academy of Pediatrics Citation2018; ANSI/SVIA Citation2017; CPSC Citation2006; Garvey et al. Citation2008; NCCRAHS 2018).
2. Materials and methods
2.1. Study overview
Fifty-four utility ATVs were evaluated in the present study. Selected models consisted of vehicles of varying sizes and mileages (0–4000 mi) from the most common ATVs on U.S. farms (Honda, Yamaha, Polaris, and CF Moto). Moreover, general descriptive variables, such as manufacturer, model, series, engine capacity (cc), drive terrain (4W/2W), transmission, suspension type, and presence of a steering assist system (EPS) were also recorded for further analysis of results.
This study focussed on the activation forces of eight main ATV controls of utility ATVs: (1) Handbrake lever, (2) footbrake pedal, (3) steering handlebar, (4) throttle lever, (5) ignition switch, (6) headlight switch, (7) hand gearshift lever, and (8) foot gearshift lever. These controls were selected because they are the most important and frequently used controls in agricultural machines (Fathallah et al. Citation2008). In addition, the inability of an operator to effectively activate these selected controls would place them and any bystanders at risk of serious injury or fatality. The force required to push the ATV off the operator’s body (from an upside-down position) after rollover was also considered since a significant number of rollover accidents result in the rider being pinned underneath the vehicle and dying by asphyxia (Mcintosh et al. Citation2016).
Youth’s corresponding strength was compared to the forces required to activate the eight ATV controls and also to the ATV’s curb weight (rollover scenario). For each comparison, riders received a binary score (1 if rider’s corresponding strength was greater than the force required to activate the control or push off the ATV; or 0 otherwise). Riders with a combined score of 9 (sufficient strength to activate all eight controls and push off the ATV) were classified as ‘capable of riding the ATV’. On the other hand, riders with a total score below 9 (insufficient strength to activate at least one or more controls and/or push off the ATV) were classified as ‘not capable of riding the ATV’.
2.2. Data collection and experimental procedures
2.2.1. General descriptive variables
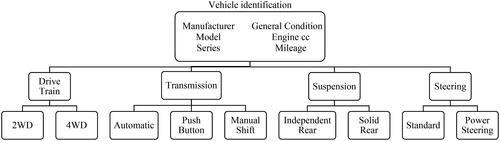
General descriptive variables for each vehicle were divided into five main groups: (1) vehicle identification, (2) drive train (2WD: two-wheel drive or 4WD: four-wheel drive), (3) transmission system, (4) suspension, and (5) steering system. A summary of all variables is presented in .
Figure 1. General descriptive variables.
2.2.2. Activation forces of ATV controls
Data collection procedures of the activation forces of vehicle controls were divided into three sections: (a) Braking system, (b) Handlebar steering, and (c) Auxiliary controls. In addition, the forces required to push the upside-down ATV off the operator’s body are described in section (d), which is titled ‘ATV Resistance Force’.
2.2.2.1. Braking system
According to ATV Safety Instructor Carina J. Ellis, ‘the footbrake pedal controls the rear wheels’ brake; it is generally activated individually (i.e. without the aid of the hand brakes) when riding downhill so that the rider can freely use their hands to control the vehicle’ (Ellis Citation2019). Also, by only using the rear brakes, the risk of the ATV tipping forward is reduced (by using the hand brakes, the rider can accidentally activate the front brakes as well). Therefore, the footbrake’s activation force was measured in a simulated downhill scenario, as shown in . The ATVs were placed facing the ground, and the footbrake pedal was completely depressed and then slowly released and pressed again when the ATV started to roll down the ramp (no forces were applied to the handbrakes of the ATVs during this particular field procedure). The lowest data point before the ATV started to roll was identified as the minimum force required for stopping the vehicle. For each ATV, the procedure was repeated three times.
Figure 2. Foot brake testing, with button (foot)-loadcell interface: (a) side view, and (b) front view.
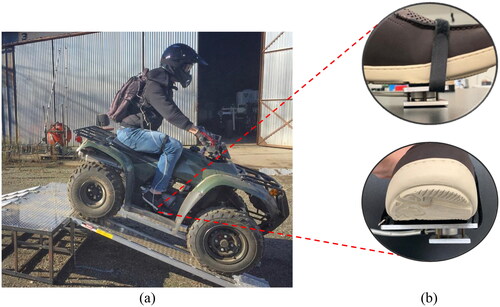
Activation forces on the footbrake were measured with a button load cell model 10MR02-500 (Mark 10, Copiague, NY, USA). The load cell was attached to a shoe and connected to a laptop through a USB serial connection during data collection.
The handbrakes are used for every scenario other than the downhill. Its performance is evaluated based on the vehicle deceleration rate, i.e. the relationship between the time it takes to stop the vehicle entirely and the distance travelled within this time (stopping distance) (Koetniyom et al. Citation2018). Hence, the forces required to activate the handbrake levers were recorded along with their respective stopping distances for further investigation of a potential relationship. This relationship is important because it allows for estimating the minimum force required to brake the vehicle in the shortest distance.
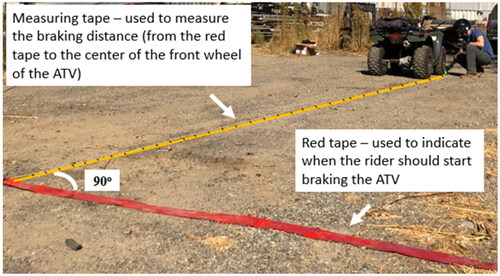
The vehicles were accelerated at a speed of 6.7 m s−1 [the most common speed at which ATV accidents occur—(Schalk and Fragar Citation1999; CPSC Citation2015)] on a flat gravel surface. A red tape was placed on the ground to indicate a set point at which the rider should activate the handbrakes, as shown in . Whenever possible, the rider was asked to use both hands to activate the handbrake levers (some ATVs only had a single handbrake lever). Moreover, no forces were applied to the footbrake pedals of the ATVs during this particular field procedure. The ATVs were initially placed at a distance of 20 ft from the red tape. The stopping distance was manually measured and recorded.
Figure 3. Hand brake testing, with red tape to indicate the braking point and measuring tape to measure the travel distance.
The tests to measure the forces required to activate the handbrake were divided into three main categories: (1) ‘test with no brake’ (no load is applied to the brake lever), (2) ‘tests with variable forces’ (the rider consciously applies partial depression of the lever), and (3) tests with full brake (brake lever fully depressed). Tests with extreme forces (no brake and full brake) were repeated three times, while the tests with ‘variable forces’ were performed five times because they included a wider range of forces. The forces were plotted against their respective stopping distance, and linear regression (braking distance = a + b activation force−1 + c activation force−2—where a, b, and c are constants) was performed to estimate the minimum force required to stop the ATV in the shortest distance. The braking distance would decrease as the force applied to the brake lever was increased. However, the braking distance would plateau once the brake lever was fully depressed, regardless of the force being applied to the brake lever. Therefore, we deemed that the selected relationship was the best model to fit the data (braking distance vs. force applied to the hand brake lever).
A grip pressure sensor glove (GPSG), BT5010 (SENSOR PRODUCTS Inc., Madison, NJ, USA), was used to measure the forces required to activate the vehicle’s handbrakes (). The pressure data was converted into force measurements by multiplying the pressure values by the total area of the sensors. Continuous measurements were obtained through a USB serial connection to a portable computer via custom-built software Tactilus 4.1.002rc6, provided with the GPSG system. The GPSG pressure range was 0–100 psi, in 0.1 psi increments. A preliminary test was performed to investigate if different riders would yield different mean force values for a given ATV, as suggested by Kung (Kung Citation2006). Data collected from three different subjects and analysed through an ANCOVA showed no significant difference between mean values (p = 0.08); thus, the use of the GPSG was deemed appropriate for data collection.
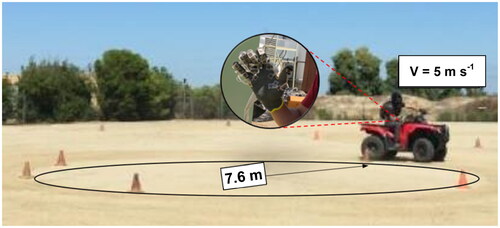
Figure 4. Handlebar steering test, with GPSP and cones to indicate the perimeter of the circular path.
2.2.2.2. Handlebar steering
The handlebar steering test was performed with the vehicle in motion because most ATV incidents occur in motion, and friction forces between soil and tire differ if the vehicle is static vs. in motion. Moreover, the resulting force required to turn the handlebar also depends on the soil moisture content, the type of soil (e.g. sand and clay), and the tire pressure. Since most of the ATVs evaluated in this study were obtained from local farmers and data was collected on their property, we were unable to control the soil type and moisture content during the field tests. However, we ensured that all vehicles had their tires calibrated according to the manufacturer’s catalog. Furthermore, the handlebar steering experiments were always performed on flat gravel surfaces.
Activation forces to steer the handlebar were measured with the GPSG glove system. The vehicle was ridden at a constant speed of 5 m s−1 in a circular path with a radius of 7.6 m, as shown in . The radius of 7.6 m was selected based on the recommendations of the U.S. ANSI/ROHVA 1-2011 Standard for Recreational Off-Highway Vehicle testing (ANSI/ROHVA Citation2011). On the other hand, the speed of 5 m s−1 was selected based on the ATVs’ dynamic handling test results of Grzebieta, Rechnitzer, and Simmons (Citation2015a). Briefly, this combination of speed and radius produces lateral accelerations (≈0.34 g) near the lowest vehicle rollover threshold reported by Grzebieta, Rechnitzer, and Simmons (Citation2015a), which was about 0.36 g for an ATV model Kymco MXU300. In other words, this is a conservative combination that focuses on the rider’s safety and would yield a low injury risk for the test rider in the case of an incident (Grzebieta, Rechnitzer, and Simmons Citation2015a). Since we only had one glove to collect the data, tests were conducted in both clockwise and counterclockwise directions, so we could measure the forces required to pull/push the handlebars. All tests were repeated three times in each direction (Grzebieta, Rechnitzer, and Simmons Citation2015a), and the forces required to steer the handlebars were identified as the maximum force measured during the tests.
2.2.2.3. Auxiliary controls
The activation forces of the auxiliary controls (ignition switch, headlight switch, throttle lever, hand gearshift, and foot gearshift) were measured with a handheld force gauge model 475055 (EXTECH Instruments, Waltham, MA, USA) as done for a previous study with agricultural tractors (Fathallah et al. Citation2008). Continuous and peak force measurements (three replicates for each control) were obtained through an RS-232-to-USB serial connection to a portable computer via custom-built software Extech Data Acquisition 407001 A. The force gauge was always placed perpendicular to all ATV controls.
Manufacturer-certified calibration was performed before data acquisition procedures for data collection devices used in this project (button-load cell, GPSG, and the handheld force gauge).
2.2.2.4. ATV resistance force
The force required to push the ATV off (from an upside-down position) was calculated as the vehicle’s net weight.
It is important to clarify that a rollover can occur under diverse conditions and, therefore, yield different post-rollover configurations (i.e. the final location of the operator and the ATV). Moreover, depending on the post-rollover configuration, the rider may be able to use different limbs/muscles to push off the ATV (e.g. arms, quadriceps, legs, feet, etc.). To simplify the matter and adopt a conservative approach, we consider three different post-rollover scenarios ():
Figure 5. Rollover scenarios. (a) Rollover scenario 1, (b) rollover scenario 2, and (c) rollover scenario 3.
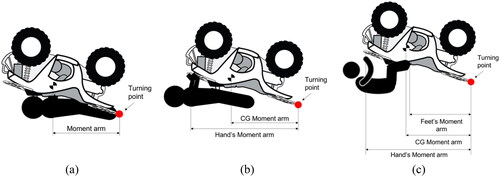
The ATV is upside-down, and its centre of gravity (CG) stands on top of the rider’s chest (rider’s moment arm equals the horizontal distance between the ATV’s CG and its rear rack). In addition, we consider that the rider has both hands free to push the ATV off but cannot use their legs. We deem that this configuration is the worst-case scenario, and if riders are strong enough to push the ATV off in this case, they are likely able to push the ATV off on all other rollover configurations.
The ATV is upside-down, and its front rack/chassis stands on top of the rider’s chest (largest moment arm). In this scenario, we also consider that the rider has both hands free to push the ATV off but cannot use their legs.
The ATV is upside-down, and its front rack/chassis stands on top of the rider’s chest, as in scenario 2. The difference is that now we consider that the rider can use both his hands and legs to push the ATV off. This configuration represents the best-case scenario and helped assess whether our consideration for the worst-case scenario was too restrictive.
For the first scenario, the rider’s minimum corresponding strength was assumed to be the same as the ATV’s curb weight. On the other hand, for the second and third scenarios, the minimum rider’s corresponding strength was calculated according to Equationequations (1)(1)
(1) and Equation(2)
(2)
(2) .
(1)
(1)
(2)
(2)
Where:
RMCS: Rider’s minimum corresponding strength
ATVCW: ATV’s curb weight
Hand’s moment arm: Distance between the point where the rider’s hands touch the ATV and the ATV’s rear rack
CGy: Horizontal distance between the CG location and the end of the ATV’s rear rack
RAS: Rider’s arm strength
RLS: Rider’s leg strength (maximum voluntary contraction force—MVC)
Feet’s moment arm: Distance between the point where the rider’s feet touch the ATV and the ATV’s rear rack
For simplification purposes, the hand’s moment arm was assumed to be the same as the ATV length, and the feet’s moment arm was considered the same as the CGy. The location of the ATV’s CG was estimated from various sources (Grzebieta, Rechnitzer, and Simmons Citation2015a, Citation2015b; Grzebieta, Rechnitzer, and McIntosh Citation2015; Heydinger et al. Citation2016) due to the lack of exact data.
2.2.3. Youth strength
Youth’s physical strength for different body parts (e.g. legs, hands, feet, and fingers) was used from multiple sources (Department of Trade and Industry Citation2000, Citation2002; Parker et al. Citation1990). The data from the Department of Trade and Industry included around 150 male-and-female subjects from the United Kingdom (U.K.) aged from 2 to 90 years. Subjects were asked to exert their maximum strength at all times, described as the highest force they could exert without causing injury. Detailed information, such as the number of subjects for each force measurement, selection criteria, type of equipment used for data collection, and data validity and reliability can be found elsewhere (Department of Trade and Industry Citation2000, Citation2002).
Data regarding youth’s maximum voluntary contraction force (MVC) of the quadriceps were retrieved from a previous research study (Parker et al. Citation1990), which includes measurements from 267 male and 284 female subjects. The subjects were of predominantly white ethnic origin aged from 5 to 17 years from London, UK.
Corresponding youth strength and ATV controls are presented in .
Table 1. Corresponding youth strength to ATV controls.
The mean MVC of each age group (6–10, 11–15, and 16–20) was calculated as the average MVC reported for all youth within that particular age group. For example, the mean MVC of the age group 16–20 was calculated as the average MVC reported for youth aged 16.5 and 17.5.
The corresponding strength for the youth of different percentiles (5th and 95th) was estimated based on the standard deviation and mean reported values.
2.3. Data analysis
The use of ATVs for work requires the ability to repeatedly engage the vehicle controls (ATV-Safety-Institute Citation2009), which may cause muscle fatigue and injure the operator (Pheasant and Harris Citation1982). To mitigate such outcomes, it is recommended that operators do not apply more than 30% of their maximum strength (recommended exertion) (Pheasant and Harris Citation1982). Thus, the ‘recommended exertion’ is reported in addition to the youth’s strength. For those cases, the forces needed to activate repeatedly engaged controls (i.e. brakes, handlebar, and throttle lever) were compared to 30% of the youth’s maximum corresponding strength.
General descriptive variables are presented throughout the text using descriptive statistics. The percent of observations for which mismatches were observed is presented in tabular form. Bar graphs based on age groups and force scenarios (normal vs. recommended exertion) were used to display the percentage of vehicles without any limitations to youth. For comparison, the percent of observations for which mismatches were observed for an average (50th percentile) adult were also displayed on the bar graphs.
The primary results consist of measures of the activation forces required to activate the main ATV controls and push the ATV off if the rider is pinned underneath it and the corresponding strength of the youth. This study evaluated youth in the age range of 6 to 20 years old from three strength percentiles (5th, 50th, and 95th). Force measurements of ATV controls were replicated three times for each vehicle. To standardise the data collection procedures, all tests conducted for measuring the activation forces of ATV controls were performed by a single researcher (gender: male; height: 1.83 m; weight: 90.5 kg). The average force for each ATV model was used in comparing the activation forces to the youth’s corresponding strength.
Furthermore, some utility ATVs are equipped with electric power steering (EPS), which supplements the torque the driver applies to steer the handlebar. For this reason, the mean force required to steer the handlebar of ATVs equipped with and without EPS units is displayed jointly and individually in tabular form.
3. Results
Fifty-four ATVs were evaluated from eight distinct manufacturers. Around 39% of the vehicles were brand new, while 73% (n = 24) of the remaining ATVs were classified as in either good or excellent condition. Engine capacity ranged from 199 to 686 cc, with most vehicles in the range of 400–686 cc. Moreover, 50% of the ATVs evaluated had electric power steering (EPS), 4WD (77%), solid suspension (61%), and manual transmission (72%).
A summary of descriptive statistics for the controls’ findings is presented in . The mean coefficients of variation among replicates of the same ATV (CVR) ranged between 3.8 and 11.1%, which is in accord with the results of a previous study (Fathallah et al. Citation2008). On the other hand, a wide range and high coefficient of variation (CV) were observed for the activation forces of almost all controls across the various ATVs evaluated. The mean activation force of the handlebar was substantially lower (34%) for ATVs equipped with an EPS unit.
Table 2. Descriptive statistics for control activation forces (N).
Findings for corresponding youth strength vs. activation forces of individual controls are presented in (males) and 4 (females). The auxiliary controls presented low difficulty for the youth of all age groups and genders. For instance, all simulated youth were able to activate the headlight switch of 89.4% of all ATVs evaluated, the throttle lever and the foot gearshift of all ATVs, and the hand gearshift of 69.4% of the ATVs. A common characteristic among all controls with a high success rate is that they consist of either switches or levers and are mainly operated with the fingers (e.g. index finger or thumb). Moreover, the handlebars also have very low difficulty for youth (males can operate 100% of the handlebars while females can operate at least 96.6% of the handlebars— and ).
Table 3. Percentage of observations (n = 54) for which controls did not limit ATV usage by male children of various ages and strength percentiles.
Table 4. Percentage of observations (n = 54) for which controls did not limit ATV usage by female children of various ages and strength percentiles.
On the other hand, the simulations revealed that vehicles’ footbrake presented severe difficulty to the youth. For instance, 6–10 years-old males of the 5th strength percentile were able to activate only 22.7% of all evaluated footbrakes. The inability to depress the foot or handbrakes affects the youth’s ability to reduce the speed or stop the ATV. In addition, failing to reduce the vehicle speed can prevent the operator from diverting from obstacles or potential bystanders. These are critical findings since several studies have shown that most ATV crashes include hitting a stationary object (Balthrop et al. Citation2007; Concannon et al. Citation2012; Helmkamp, Marsh, and Aitken Citation2011; Jennissen et al. Citation2018; Lower and Herde Citation2012).
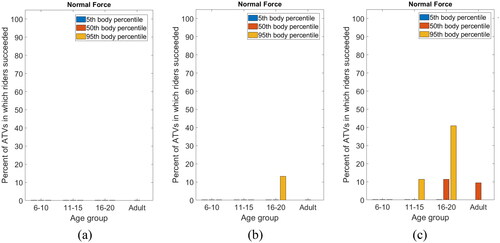
The simulations involving most youths of all age and gender groups indicated that they cannot push the ATV off for all considered rollover scenarios (i.e. corresponding strength is less than the vehicle’s weight). For example, a male youth aged 16–20 from the 95th percentile (strongest group of subjects) could only push off 40.7% of the ATVs for our best-case scenario. That number is significantly smaller (13 and 0%) for the second and first scenarios, respectively. The results are even more striking for female subjects since females could only push off 11.1% of the evaluated ATVs for our best-case scenario and 0% of the ATVs evaluated for the worst-case scenario. A similar trend is observed for the activation forces of the footbrakes as well.
The results indicated that a 6–10-year-old male youth from the 5th strength percentile can activate the hand gearshifts (97.2%) of a larger percentage of the evaluated ATVs compared to an 11–15-year-old male youth of the same strength percentile (77.8%). A similar trend is observed when comparing the percentage of footbrakes that 11–15 and 16–20-year-old female subjects of the 5th strength percentile can activate. Although unexpected, the results are in accord with the original youth strength data (Department of Trade and Industry Citation2000, Citation2002; Parker et al. Citation1990) used in the present study.
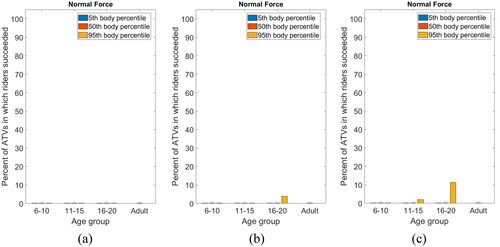
The percentage of ATVs in which riders passed all criteria is presented in and (males), 8 and 9 (females). The results indicate that most youths from the 50th and 95th percentiles are strong enough to operate the controls of a large number of the evaluated ATVs. For instance, the average (50th percentile) female operator aged 6–10 is capable of operating the controls of 70.4% of all evaluated ATVs. That number increases sharply for older youth or youth of the same age but higher strength percentile. A similar trend was also observed for male operators. On the other hand, the plots of totals highlight that most operators cannot push the ATV off if pinned underneath it ( and ).
Figure 6. Percent of observations (n = 54) for which male youth passed all criteria (controls only). (a) Normal force and (b) recommended exertion.
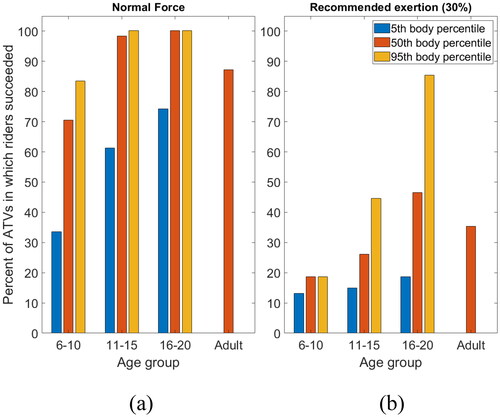
Figure 7. Percent of observations (n = 54) for which male youth passed all criteria (a) controls and rollover scenario 1, (b) controls and rollover scenario 2, and (c) controls and rollover scenario 3.
A clear trend in the results indicates that older youth were capable of riding a larger percentage of ATVs. This trend indicates that they are less likely to get involved in ATV accidents compared to their younger counterparts. Similar findings were also observed in other studies that evaluated the fit of youth for agricultural vehicles (Fathallah et al. Citation2008; Fathallah et al. Citation2009; Bernard et al. Citation2010).
An interesting observation is related to the ‘recommended exertion’ scenario ( and ); all operators, including adults, are at risk when comparing ‘recommended exertion’ with normal forces. The number of ATVs without limitations in footbrake, handbrake, handlebar, or throttle-lever decreases sharply for the youth of all ages and strength percentiles. For instance, the handlebar, which did not present any significant difficulties for youth under normal conditions, becomes a factor of concern as males aged 16–20 in the 5th percentile can only activate the handlebars of 48% of all evaluated ATVs. Furthermore, the percentage of ATVs without limitations on the footbrake for females aged 16–20-years of the 95th percentile decreased from 100% (under normal conditions) to 40.9% under ‘recommended exertion’.
Figure 8. Percent of observations (n = 54) for which female youth passed all criteria (controls only). (a) Normal force and (b) recommended exertion.
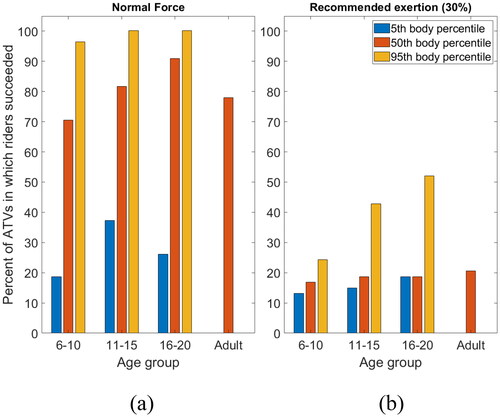
Figure 9. Percent of observations (n = 54) for which female youth passed all criteria (a) controls and rollover scenario 1, (b) controls and rollover scenario 2, and (c) controls and rollover scenario 3.
The ‘recommended exertion’ scenario also affects the percentage of ATVs without limitations in any controls for youth (‘Totals’). The average male operator aged 16–20 presented a drop of 53.7% in the total percentage of ATVs without limitations. The results were even more striking for the females, as the average female operator aged 16–20-year presented a drop of 72.2% of the evaluated ATVs. These results provide quantitative evidence that youth cannot continuously activate some ATV controls, i.e. youth (and adults) should not be riding utility ATVs for extended periods.
4. Discussion
The present results indicated mismatches between the youth’s strength and utility ATVs’ operational requirements, especially for the footbrake, and the forces required to push off an ATV if pinned underneath it. Common causes of fatal and traumatic injury involving ATVs include rollovers and collisions (Balthrop et al. Citation2007; Helmkamp, Marsh, and Aitken Citation2011; Cavallo, Gorucu, and Murphy Citation2015; Denning et al. Citation2013). These causes imply a functional loss of control of the vehicle or a failure to avoid unexpected hazards (Fathallah et al. Citation2008). The inability of youth to properly activate the vehicles’ controls with 100% certainty likely increases their exposure to incidents and, consequently, injuries or fatalities.
The simulations related to rollover incidents indicated that most youth cannot push the ATV off if pinned underneath it. This raises serious concerns about riders’ safety. Previous studies reported that 68% of farmworkers get pinned under the ATV after a rollover accident, and 42% of those operators die due to mechanical asphyxia (Mcintosh et al. Citation2016). Injuries and fatalities due to mechanical asphyxia can be reduced by the proper design and installation of a Crush Protection Device (CPD) (Khorsandi, Ayers, and Fong Citation2019). CPDs provide a crush protection clearance for the rider in an overturned ATV (Myers Citation2016). Making CPDs mandatory for ATVs ridden by youth would likely improve riders’ safety.
Our data indicate that most youth aged 16–20 of the 50th and 95th strength percentiles would be able to activate the controls of a larger percentage of the evaluated ATVs compared to a 50th strength percentile adult. That unexpected result is likely due to the high variability in the strength of adults. Previous studies have shown a common trend where muscle mass and strength decrease with age for adults over 30 years old (Holloszy Citation2000; Volpi, Nazemi, and Fujita Citation2004).
Current ATV-youth fit guidelines are mainly based on the rider’s age and vehicle engine size. However, these recommendations are not supported by the present findings, which clearly showed that there was the youth who could effectively activate all, some, or none of the ATVs’ controls evaluated, regardless of the vehicle’s engine size. As such, engine size and rider’s age alone are poor indicators of youth-ATV fit.
Despite the data showing a clear trend in which older youth can safely ride a higher percentage of ATVs, this can create a false sense of preparedness. Other factors may also affect the rider’s safety, such as their psychological and cognitive development, personal traits (e.g. thrill-seeking), and their riding experience (NCCRAHS Citation2018; FReSH Citation2012; Jinnah and Stoneman Citation2016). In this regard, parents’ assessment is critical to determine whether and to what extent youth should be involved in ATV operations.
4.1. Study limitations
There are several limitations of this study that need to be considered when interpreting the results. Youth strength tests were not designed to evaluate their capability to activate ATV controls. Instead, the data is a subset of a larger dataset to provide designers with ergonomics data for use in the design of safer products (Department of Trade and Industry Citation2002). Unfortunately, no analogous data were available to describe the specific forces required for youth to operate ATVs. The present study is the first to provide such information.
In addition, the corresponding strength for the youth of different percentiles was estimated based on reported mean and standard deviation values, using the standard normal table (Z table). To make these estimates possible, we had to assume that the original data was normally distributed, which may not be the case. This issue could be addressed if the dataset containing individual observations was available.
Another limitation concerns the ATV models evaluated in this study. Although we used a systematic approach to identify common ATVs used in the U.S., the sample is subject to sampling error and is not necessarily representative of the models ridden specifically by youth. Moreover, the safe and effective riding of utility ATVs involves consideration of issues other than the forces required to operate its controls. ATVs are rider-active; that is, the rider must be able to shift their body weight to safely perform manoeuvres, such as turning, negotiating hills, and crossing obstacles (National 4-H Council Citation2005).
Several limitations are related to the general condition of the evaluated ATVs. Even though an ATV may appear to be in a good general condition, that does not necessarily imply that all specific systems (e.g. brake and steering systems) are working properly, which could modify the activation forces of their respective controls. This issue may limit the generalisability of the results. It could be addressed by inquiring from ATV owners about their last inspection/maintenance.
Lastly, the measurements of activation forces for the handbrake, footbrake, and handlebar were not obtained using standard methods (e.g. as described by the Society of Automotive Engineers—SAE or ISO standards). Since the forces of those controls are affected by many factors, such as ground conditions and tire abrasion, which are difficult to control, the study’s approach adopted conservative (minimal force) alternative methods.
5. Conclusions
This study evaluated the potential mismatches between youth’s strength and the forces required to safely operate eight different controls of fifty-four utility ATVs. The main findings were that: (1) the activation forces required to operate utility ATVs typically exceed the strength of most youth aged 6–20 years old, especially females; (2) youth should not operate ATVs continuously for extended periods (e.g. work)—for instance, the typical 16–20-year-old male of the 50th strength percentile is not strong enough to operate at least 50% of all evaluated ATVs; (3) the ability to activate ATVs’ footbrake along with the ability to push off the ATV if pinned underneath are the most critical factors to determine whether youth are capable of riding based on their strength; (4) only engine size and rider’s age are poor indicators of youth-ATV fit.
These findings raise serious concerns about the ability of youth to safely operate utility ATVs in common use on U.S. farms. As such, the readiness of youth to ride ATVs, especially for occupational purposes, should be carefully evaluated by their parents/guardians.
Furthermore, the present data brings to question the validity of current youth-ATV fit guidelines as ATV engine size, and rider’s age seems to be inadequate for determining whether or not a youth is strong enough to operate the controls of a utility ATV. Therefore, there is a need to review and update current youth-ATV fit guidelines. Those guidelines should include recommendations based on quantitative and systematic data comparing the physical ability of youth and the operational requirements of ATVs.
Overall, a mixed approach combining engineering redesign, legislation, parent involvement, and safety education is needed to prevent ATV injuries in the youth of all ages (Jinnah and Stoneman Citation2016).
Disclosure statement
No potential conflict of interest was reported by the author(s).
Additional information
Funding
References
- American Academy of Pediatrics. 2018. ATVs Are Dangerous to Children: New Data Demonstrates Continued Risk of Injury and Death. American Academy of Pediatrics.
- ANSI/ROHVA. 2011. “Standard for Recreational Off-Highway Vehicle Testing.” In Dynamic Stability. ANSI/ROHVA.
- ANSI/SVIA. 2017. American National Standard for Four Wheel All-Terrain Vehicles: Specialty Vehicle Institute of America/American National Standards Institute, ANSI/SVIA 1-2017. Specialty Vehicle Institute of America.
- Anson, K., E. Segedin, and P. Jones. 2009. ATV (Quad Bike) Injuries in New Zealand Children: Their Extent and Severity. Clinical Correspondence.
- ATV-Safety-Institute. 2009. ATV E-Course. https://atvsafety.org/atv-ecourse/
- Ayers, Paul, John Conger, Rob Comer, and Pau Troutt. 2018. “Stability Analysis of Agricultural Off-Road Vehicles.” Journal of Agricultural Safety and Health 24 (3): 167–182. doi:10.13031/jash.12889
- Balthrop, Paul M., John A. Nyland, Craig S. Roberts, Janet Wallace, Riaan Van Zyl, and Gerard Barber. 2007. “Orthopedic Trauma from Recreational All-Terrain Vehicle Use in Central Kentucky: A 6-Year Review.” The Journal of Trauma 62 (5): 1163–1170.
- Bernard, Andrew C., David R. Mullineaux, James T. Auxier, Jennifer L. Forman, Robert Shapiro, and David Pienkowski. 2010. “Pediatric Anthropometrics Are Inconsistent with Current Guidelines for Assessing Rider Fit on All-Terrain Vehicles.” Accident; Analysis and Prevention 42 (4): 1220–1225. doi:10.1016/j.aap.2010.01.015
- Bowman, S.M., and M.E. Aitken. 2010. “Still Unsafe, Still in Use: Ongoing Epidemic of All-Terrain Vehicle Injury Hospitalizations among Children.” The Journal of Trauma 69 (6): 1344–1349. doi:10.1097/TA.0b013e3181ea283d
- Brison, Robert J., William Pickett, Richard L. Berg, James Linneman, Jamie Zentner, and Barbara Marlenga. 2006. “Fatal Agricultural Injuries in Preschool Children: risks, Injury Patterns and Strategies for Prevention.” Canadian Medical Association Journal 174 (12): 1723–1726. doi:10.1503/cmaj.050857
- Cavallo, E., S. Gorucu, and D. Murphy. 2015. “Perception of Side Rollover Hazards in a Pennsylvania Rural Population While Operating an All-Terrain Vehicle (ATV).” Work 51 (2): 281–288. doi:10.3233/WOR-141864
- Chang, J.H., F.A. Fathallah, W. Pickett, B.J. Miller, and B. Marlenga. 2010. “Limitations in Fields of Vision for Simulated Young Farm Tractor Operators.” Ergonomics 53 (6): 758–766. doi:10.1080/00140131003671983
- Chou, H.-Y., F. Khorsandi, and S.G. Vougioukas. 2020. “Developing and Testing a GPS-Based Steering Control System for an Autonomous All-Terrain Vehicle.” 2020 ASABE Annual International Virtual Meeting, July 13–15. doi:10.13031/aim.202000866
- Concannon, Elizabeth, Aisling Hogan, Aoife Lowery, Ronan S. Ryan, Waqar Khan, and Kevin Barry. 2012. “Spectrum of All-Terrain Vehicle Injuries in Adults: A Case Series and Review of the Literature.” International Journal of Surgery Case Reports 3 (6): 222–226. doi:10.1016/j.ijscr.2012.01.012
- CPSC. 2006. Standards for All Terrain Vehicles and Ban of Three-Wheeled All-Terrain Vehicles; Notice of Proposed Rulemaking, 45904–45962. US Consumer Product Safety Commission, Federal Register 71(154).
- CPSC. 2015. 2015 Annual Report of ATV-Related Deaths and Injuries, edited by J. Toppings. Bethesda, MD: Consumer Product Safety Commission.
- Denning, G.M., K.K. Harland, and C.A. Jennissen. 2014. “Age-Based Risk Factors for Pediatric ATV-Related Fatalities.” Pediatrics 134 (6): 1094–1102. doi:10.1542/peds.2014-1993
- Denning, Gerene M., Karisa K. Harland, David G. Ellis, and Charles A. Jennissen. 2013. “More Fatal All-Terrain Vehicle Crashes Occur on the Roadway than Off: Increased Risk-Taking Characterises Roadway Fatalities.” Injury Prevention 19 (4): 250–256. doi:10.1136/injuryprev-2012-040548
- Department of Trade and Industry. 2000. Strength Data for Design Safety – Phase 1. London: Department of Trade and Industry.
- Department of Trade and Industry. 2002. Strength Data for Design Safety – Phase 2. London: Department of Trade and Industry.
- Dolan, M.A., J.F. Knapp, and J. Andres. 1989. “Three-Wheel and Four-Wheel All-Terrain Vehicle Injuries in Children.” Pediatrics 84 (4): 694–698. doi:10.1542/peds.84.4.694
- Ellis, C.J. 2019. Personal Communication between the Instructor and the Author during the ATV Rider Course. Rancho Cordova, CA.
- Fathallah, F.A., J.H. Chang, R.L. Berg, W. Pickett, and B. Marlenga. 2008. “Forces Required to Operate Controls on Farm Tractors: Implications for Young Operators.” Ergonomics 51 (7): 1096–1108. doi:10.1080/00140130801961901
- Fathallah, F.A., J.H. Chang, W. Pickett, and B. Marlenga. 2009. “Ability of Youth Operators to Reach Farm Tractor Controls.” Ergonomics 52 (6): 685–694. doi:10.1080/00140130802524641
- FReSH. 2012. Youth ATV Safety.
- Garvey, P.M., D.J. Murphy, A.M. Yoder, and J.W. Hilton. 2008. “National Safe Tractor and Machinery Operation Program: Development and Content Evaluation.” Journal of Agricultural Safety and Health 14 (3): 333–349.
- Grzebieta, R., G. Rechnitzer, and A.S. McIntosh. 2015. “Quad Bike Performance Project (QBPP) Part 3: Rollover Crashworthiness Test Results.” In The Quad Bike Performance Project, 179. Sydney: University of New South Wales.
- Grzebieta, R., G. Rechnitzer, and K. Simmons. 2015a. “Quad Bike Performance Project (QBPP) Part 2 – Dynamic Handling Test Results.” In The Quad Bike Performance Project, 225. Sydney: University of New South Wales.
- Grzebieta, R., G. Rechnitzer, and K. Simmons. 2015b. Part 1: Static Stability Test Results, 1–154. Sydney: University of New South Wales.
- Hard, D.L., and J.R. Myers. 2006. “Fatal Work-Related Injuries in the Agriculture Production Sector among Youth in the United States, 1992–2002.” Journal of Agromedicine 11 (2): 57–65. doi:10.1300/J096v11n02_09
- Helmkamp, J.C., S.M. Marsh, and M.E. Aitken. 2011. “Occupational All-Terrain Vehicle Deaths among Workers 18 Years and Older in the United States, 1992–2007.” Journal of Agricultural Safety and Health 17 (2): 147–155.
- Hendricks, K., and E. Goldcamp. 2010. “Injury Surveillance for Youth on Farms in the US, 2006.” Journal of Agricultural Safety and Health 16 (4): 279–291.
- Hendricks, K.J., and D.J. Hard. 2019. “Working Youth on Farms 2014.” Unpublished presentation at the National Youth Farm and Ranch Symposium, Louisville, KY, October 27–28.
- Hendricks, Kitty J., John R. Myers, Larry A. Layne, and E Michael Goldcamp. 2005. “Household Youth on Minority Operated Farms in the United States, 2000: Exposures to and Injuries from Work, Horses, ATVs and Tractors.” Journal of Safety Research 36 (2): 149–157. doi:10.1016/j.jsr.2005.01.002
- Heydinger, G., R. Bixel, J. Yapp, S. Zagorski, A. Sidhu, J. Nowjack, J. Coyle, and H. Jebode. 2016. Vehicle Characteristics Measurements of All-Terrain Vehicles. Columbus, OH: SEA Vehcile Dynamics Division.
- Holloszy, J.O. 2000. “The Biology of Aging.” Mayo Clinic Proceedings 75 (1): S3–S9. doi:10.1016/S0025-6196(19)30634-2
- House, Taylor, David C. Schwebel, Samantha H. Mullins, Andrea J. Sutton, Christopher J. Swearingen, Shasha Bai, and Mary E. Aitken. 2016. “Video Intervention Changes Parent Perception of All-Terrain Vehicle (ATV) Safety for Children.” Injury Prevention 22 (5): 328–333. doi:10.1136/injuryprev-2015-041880
- Jennissen, C.A., K. Wetjen, P. Hoogerwerf, L. O'Donnell, and G. Denning. 2018. “The All-Terrain Vehicle Exposure and Crash Experiences of Iowa FFA Members.” National Occupational Injury Research Symposium, Morgantown, WV.
- Jinnah, H.A., and Z. Stoneman. 2016. “Youth Personality Factors as Predictors of Risky All-Terrain Vehicle (ATV) Driving Behaviors.” Journal of Agricultural Safety and Health 22 (2): 134–147.
- Khorsandi, F., P.D. Ayers, and E.J. Fong. 2019. “Evaluation of Crush Protection Devices for Agricultural All-Terrain Vehicles.” Biosystems Engineering 185: 161–173. doi:10.1016/j.biosystemseng.2019.04.025
- Khorsandi, Farzaneh, Paul Ayers, Gerene Denning, Charles Jennissen, Dee Jepsen, Melvin Myers, Stephen Oesch, Michael Pate, and David J. White. 2021. “Agricultural All-Terrain Vehicle Safety: Hazard Control Methods Using the Haddon Matrix.” Journal of Agromedicine 26 (4): 420–435. doi:10.1080/1059924X.2020.1837705
- Koetniyom, Saiprasit, Manus Dangchat, Songwut Mongkonlerdmanee, Julaluk Carmai, and Sunarin Chanta. 2018. “Identification of Handbrake Patterns of Young Motorcycle Riders in Thailand Using a Newly Invented Force Measuring Device.” Engineering Journal 22 (5): 185–197. doi:10.4186/ej.2018.22.5.185
- Kung, J.C. 2006. Evaluation of the Effects of Back and Upper Extremity Postures on Grip Force Production in Pruning, 169. Davis, CA: Department of Biological and Agricultural Engineering, University of California, Davis.
- Lower, T., and E. Herde. 2012. “Non-Intentional Farm Injury Fatalities in Australia, 2003–2006.” New South Wales Public Health Bulletin 23 (1–2): 21–26. doi:10.1071/NB11002
- Mattei, Tobias A., Brandon J. Bond, John W. Hafner, Martin J. Morris, Jennifer Travis, Greg Hannah, Jim Webster, and Julian J. Lin. 2011. “Definition and Measurement of Rider-Intrinsic Physical Attributes Influencing All-Terrain Vehicle Safety.” Neurosurgical Focus 31 (5): E6. doi:10.3171/2011.9.FOCUS11176
- Mcintosh, A.S., D.A. Patton, G. Rechnitzer, and R. Grzebieta. 2016. “Injury Mechanisms in Fatal Australian Quad Bike Incidents.” Traffic Injury Prevention 17 (4): 386–390. doi:10.1080/15389588.2015.1091073
- Murphy, D. 2020. National Safe Tractor and Machinery Operation Program. PennState Extension.
- Murphy, D., and W. Harshman. 2014. ATVs and Youth: Matching Children and Vehicles.
- Myers, M. 2016. “All-Terrain Vehicle Safety―Potential Effectiveness of the Quadbar as a Crush Prevention Device.” Safety 2 (1): 3. doi:10.3390/safety2010003
- National 4-H Council. 2005. 4-H ATV Safety. Accessed August 4, 2020. http://www.atv-youth.org/
- National Children’s Center for Rural and Agricultural Health and Safety. 2016. 2016 Fact Sheet: Childhood Agricultural Injuries in the U.S. Marshfield, WI: Marshfield Clinic.
- NCCRAHS. 2018. Operating an All-Terrain Vehicle, Can Youth Do This Job Safely?
- NIOSH. 2016. Analyses of the 2014 Childhood Agricultural Injury Survey (CAIS). Morgantown, WV: U.S. Department of Health and Human Services, Public Health Service, Centers for Disease Control and Prevention, National Institute for Occupational Safety and Health, Division of Safety Research.
- Parker, D.F., J.M. Round, P. Sacco, and D.A. Jones. 1990. “A Cross-Sectional Survey of Upper and Lower Limb Strength in Boys and Girls during Childhood and Adolescence.” Annals of Human Biology 17 (3): 199–211. doi:10.1080/03014469000000962
- Pheasant, S.T., and C.M. Harris. 1982. “Human Strength in the Operation of Tractor Pedals.” Ergonomics 25 (1): 53–63. doi:10.1080/00140138208924926
- Schalk, T., and L.J. Fragar. 1999. Reducing Risk of Injury Associated with Farm Motorcycles on Farms in Australia. Moree: Australian Agricultural Health Unit.
- Scott, A., R. Dansey, and J. Hamill. 2011. “Dangerous Toys.” ANZ Journal of Surgery 81 (3): 172–175. doi:10.1111/j.1445-2197.2010.05484.x
- Shults, Ruth A., Stacey D. Wiles, Madhavi Vajani, and James C. Helmkamp. 2005. “All-Terrain Vehicle–Related Nonfatal Injuries among Young Riders: United States, 2001–2003.” Pediatrics 116 (5): e608–e612. doi:10.1542/peds.2005-0937
- Volpi, E., R. Nazemi, and S. Fujita. 2004. “Muscle Tissue Changes with Aging.” Current Opinion in Clinical Nutrition and Metabolic Care 7 (4): 405–410.
- Weichelt, B., and S. Gorucu. 2019. “Supplemental Surveillance: A Review of 2015 and 2016 Agricultural Injury Data from News Reports on AgInjuryNews.org.” Injury Prevention 25 (3): 228–235. doi:10.1136/injuryprev-2017-042671
- Wiener, R.C., C. Waters, M. Harper, A.K.T. Shockey, and R. Bhandari. 2022. “All-Terrain Vehicle-Related Emergency Department Visits: Interaction of Sex and Age, NEISS, 2019.” The Journal of Emergency Medicine 62 (6): 810–819.
- Wright, S., B. Marlenga, and B.C. Lee. 2013. “Childhood Agricultural Injuries: An Update for Clinicians.” Current Problems in Pediatric and Adolescent Health Care 43 (2): 20–44. doi:10.1016/j.cppeds.2012.08.002