
Abstract
The shared responsibility between conditional AVs drivers demands shared understanding. Thus, a shared intended pathway (SIP)—a graphical display of the AV’s planned manoeuvres in a head-up display to help drivers anticipate silent failures is proposed. An online, randomised photo experiment was conducted with 394 drivers in Australia. The photos presented traffic scenarios where the SIP forecast either safe or unsafe manoeuvres (silent failures). Participants were required to respond by selecting whether driver intervention was necessary or not. Additionally, the effects of presented object recognition bounding boxes which indicated whether a road user was recognised or not were also tested in the experiment. The SIP led to correct intervention choices 87% of the time, and to calibrating self-reported trust, perceived ease of use and usefulness. The bounding boxes found no significant effects. Results suggest SIPs can assist in monitoring conditional automation. Future research in simulator studies is recommended.
Practitioner summary: Conditional AV drivers are expected to take-over control during failures. However, drivers are not informed about the AV’s planned manoeuvres. A visual display that presents the shared intended pathway is proposed to help drivers mitigate silent failures. This online photo experiment found the display helped anticipate failures with 87% accuracy.
1. Introduction
The number of annual road traffic deaths reached ∼1.35 million worldwide in 2016, which was an increase from 1.15 million in 2000 (WHO Citation2018). Increasing automation is anticipated to contribute to reducing crashes associated with human error (Boggs, Wali, and Khattak Citation2020). While a fully automated vehicle will take some years to become commercially available, vehicles are already becoming increasingly automated. The Society of Automotive Engineers (SAE) provide a schema for varying levels of Automation (SAE, Citation2018) ranging from Level 0 (no driving automation) to Level 5 (full automation wherein the passenger is not required to drive at all). The focus of this study is on conditional (Level 3) automated vehicles (AVs). Conditional AVs require active supervision from the driver while the vehicle is engaged in automated driving, such that the driver is ready to intervene when they encounter system limitations.
Being aware of system limitations in a conditional AV that may rarely make errors requires sustained attention and could lead to boredom and hypovigilance (Greenlee, DeLucia, and Newton Citation2018; Körber et al. Citation2015; Larue, Rakotonirainy, and Pettitt Citation2011). Greenlee, DeLucia, and Newton (Citation2018) conducted a study where 22 participants were asked to monitor automated driving in a driving simulator, and to watch for cars that had stopped dangerously at intersections. Greenlee, DeLucia, and Newton (Citation2018) found that during the 40 min of the simulated automated driving, participants’ hazard detection rate decreased by more than 30%, and that drivers’ reaction times also increased for detecting the hazards. In another study, Strand et al. (Citation2014) compared supervision performance in conditional automated driving vs. highly (SAE Level 4) automated driving and found that as automation increased, the supervisor performance decreased. This degradation of supervisor performance as automated increases in automobiles must be dealt with to help negate the potential increased risk of crashes. One aspect of managing driver vigilance, and therefore trust, could be by using cues in visual displays (Yeh and Wickens Citation2001). By using visual cues, attention can be directed, and trust can be influenced to high or low levels, depending on how safe or unsafe the scenario ahead is, allowing for trust calibration.
1.1. Trust calibration
Trust plays a crucial role in our everyday lives, at a societal level, at an interpersonal level, and also when interacting with technology. Rousseau et al. (Citation1998) provide a multidisciplinary definition of trust as, ‘a psychological state comprising the intention to accept vulnerability based upon positive expectations of the intentions or behaviour of another’ (395). Lee and See (Citation2004) defined trust as ‘the attitude that an agent will help achieve an individual’s goals in a situation characterized by uncertainty and vulnerability’ (54). Similarly, Hoff and Bashir (Citation2015) explain that trust is, ‘needed when something is exchanged in a cooperative relationship characterised by uncertainty’ (409), which is something that applies to both interpersonal relationships as well as human-machine interaction.
Trust is often cited as a necessary precursor to eliciting acceptance of AVs, which is defined as the intention or willingness to perform a specific behaviour (Gold et al. Citation2015). However, Mirnig et al. (Citation2016) highlight the importance of invoking not only trust but also distrust, when a system is not behaving as intended or safely. In other words, given that AVs have system limitations, it is important that users do not over-trust the functions of the AV, as this could lead to injurious and fatal crashes (Poland et al. Citation2018). However, low trust when the AV is in fact capable may lead to disuse of the vehicle functions. Therefore, an AV must be able to calibrate trust appropriately when establishing trust between humans and machines (Muir Citation1987). To offer a means of calibrating trust, this paper proposes a shared intended pathway (SIP) delivered through an augmented reality head-up display (AR-HUD) that informs AV drivers of the manoeuvre the AV is going to make in terms of direction and speed.
1.2. Silent failures
When the AV is self-aware of a system limitation, it can issue a take-over request (TOR) to the driver. However, if an error occurs, such as a failure to detect another road user, the AV will not be able to issue a TOR. The conceptual scenario where the vehicle fails to detect the danger ahead and is therefore unable to warn the driver that a take-over is necessary is often referred to as a silent failure (Bianchi Piccinini et al. Citation2020; Mole et al. Citation2020). As conditional AVs are unable to process and interpret every situation on the road, the human driver may be requested to resume control of the vehicle. TORs have been researched heavily in the literature (Bazilinskyy et al. Citation2015; Yun and Yang Citation2020; Zhang et al. Citation2019). For example, Yun and Yang (Citation2020) conducted a set of five TOR experiments of conditional automated driving with 41 participants to see how TOR performance is affected by the presence of visual, auditory, and haptic warnings. The results from Yun and Yang (Citation2020) showed that participants performed significantly better (i.e. faster reaction times to take back control of the vehicle) when exposed to the visual-auditory-haptic modality combination than with any unimodal condition. Participants were slower to take-back control of the vehicle when only exposed to the visual TOR. These results suggest that multi-modal warnings may be the most effective. Zhang et al. (Citation2019) conducted a meta-analysis of 129 studies exploring the determinants of take-over time in take-over requests (TORs) and reported that the mean take-over time was faster when the take-over situation was more urgent than non-urgent. This suggests that drivers may not seek to respond to a TOR as fast as possible if they perceive the take-over time budget to be greater (Alambeigi and McDonald Citation2021). While these previous studies focussed on participants’ responses to TORs, it is important to highlight that an AV may not always detect that a failure is occurring. For example, when a recent crash occurred between a Tesla and an articulated lorry, it was reported that the Tesla Autopilot system failed to detect the articulated lorry turning in the Tesla’s pathway, leading to the fatality of the Tesla driverFootnote1 (Poland et al. Citation2018). This is an example of a silent failure because the AV failed to detect the hazard or failure, and failed to alert the human driver, which then led to a crash (Mole et al. Citation2020).
Silent failures have been less explored in the literature than TORs (Guo et al. Citation2019). The limited research which has examined silent failures has found that silent failures can increase take-over times, the intensity of post-takeover maximum accelerations and decrease the post-takeover minimum time-to-collision, and that silent failures play a significant role in unsafe manoeuvres (Alambeigi and McDonald Citation2021; Zhang et al. Citation2019). In another silent failure study, Mole et al. (Citation2020) recruited 20 participants and examined silent failures of automated lane-keeping and steering responses by the human driver while they were under increased cognitive load in a driving simulator. The increased cognitive load was induced through an Auditory Continuous Memory Task (ACMT) wherein participants were required to press a button whenever they heard target letters whilst a stream of distractor items was also presented. In their study, the AV rarely left the road due to the high-performance levels of the participants, but the inclusion of the ACMT resulted in slower take-over times. Their study highlights how silent failures can require the quick response of human drivers, and how auditory tasks can affect performance. To aid take-overs during silent failures, a display that shares the future manoeuvres of the AV may be of benefit to the driver as they would be able to understand the intentions of the AV. Visual intention sharing is therefore examined in the current study.
1.3. Shared intended pathway as a solution
Ososky et al. (Citation2014) argued that a system that is adequately transparent, and appropriately calibrates trust, should be able to create a good ‘mental model’ in the user, which Rouse and Morris (Citation1986) define as ‘the mechanisms whereby humans are able to generate descriptions of system purpose and form, explanations of system functioning and observed system states, and predictions of future system states’ (351). To convey these predictions of future system states, a Head-up display (HUD) (Doshi, Cheng, and Trivedi Citation2008; Thomas and David Citation1992) that can communicate the upcoming planned manoeuvres of the AV could help to anticipate silent failures earlier, allowing more time for the AV driver to react. The concept of a pathway display, wherein the future trajectory is predicted and previewed, has been reviewed as early as the 1970s in the aviation setting (Wilckens Citation1973). More recently, Wiest et al. (Citation2012) showed that a trajectory prediction can be achieved using probabilistic modelling. Probabilistic modelling is where a statistical model incorporates random variables and their probability distributions to provide a single probability distribution for a certain event to happen. Further, HUDs have also been examined in a road safety context (e.g. Kim and Dey Citation2009). For example, Kim and Dey (Citation2009) investigated pathways in an HUD for the use of navigation in conventional cars among elderly and younger drivers. In their simulator study with 12 elderly drivers (aged 66–85 years) and 12 younger drivers (aged 19–41 years), they found a reduction in navigation errors and a reduction in distraction measures in the pathway HUD condition, in comparison with the conventional navigation display. While Kim and Dey (Citation2009) found promising results for the use of pathways in an HUD in conventional vehicles, the use of a shared intended pathway (SIP) in the context of automated vehicles has yet to be researched. This is despite Endsley (Citation2017) recommending that visual displays in conditionally automated vehicles include ‘improvements in supporting the understandability of system and actions and predictability of braking and speed changes’ (235). Thus, the current study makes a novel contribution to the literature by testing a pathway display in the context of sharing AV intentions.
1.4. Object recognition
While a pathway is designed to share the intended manoeuvre of the AV, a pathway does not directly inform the driver as to what the AV can see. Object recognition feedback, which enables the driver to understand what the vehicle can see, may also be required. Previous research has examined the effects of object recognition feedback on users’ trust in AVs (e.g. Ekman, Johansson, and Sochor Citation2016). Ekman, Johansson, and Sochor (Citation2016) found that self-reported trust increased in object recognition feedback conditions compared to baseline (no object recognition). In another study, Schall et al. (Citation2013) investigated object recognition in augmented reality to assess how it affected elderly drivers’ hazard perception skills. They found that the object recognition increased the likelihood of drivers detecting hazards without interfering with other driving tasks. These findings may suggest that using object recognition could be a promising design feature of an HMI in an AV.
One way of conveying object recognition is by using bounding boxes. Object recognition bounding boxes (ORBB) are graphical square frames that surround a target object in a display, typically to attract visual attention towards the target object. ORBB can direct the AV driver’s visual attention towards certain objects on the road (Guo et al. Citation2019), and therefore, may assist in providing information to the driver about potential on-road hazards. Bounding boxes have often been used by engineers in many contexts, such as when developing detection systems for AVs (Königshof, Salscheider, and Stiller Citation2019). Königshof, Salscheider, and Stiller (Citation2019). However, bounding boxes have rarely been explored as a means of enhancing human-machine interaction.
Due to the novel nature of this area of research, there is a great scarcity of research exploring the potential benefits of displaying the bounding boxes to human drivers of AVs, as an aide to monitor the AV. This is despite NVIDIA (a computer systems and design services company) and Waymo using bounding boxes in their HMIs (Morra et al. Citation2019). Wintersberger et al. (Citation2020) explored the use of hazard contrast information in HMI in relation to object recognition. This is where areas of higher risk are shaded differently in the HMI, which Wintersberger et al. (Citation2020) proposed could be useful for the AV driver to understand which road user in the road environment poses the highest level of risk. For example, a parked car may be shaded green as it is low risk, compared to a pedestrian about to step onto the road which may be coloured dark orange for higher risk. However, this judgement is according to the AV’s calculations which is prone to error. Furthermore, if the AV driver is to truly monitor the AV, then the driver must be vigilant in detecting silent failures, whereby the AV has completely missed a road user. In this situation, object recognition bounding boxes may make it easier for the driver to discern which road user(s) the AV has detected and which the AV has failed to detect, without the distraction of colour contrast.
1.5. Technology acceptance model
The benefits of AV technology cannot be harnessed if people do not accept these vehicles. One model which has been used to assess user acceptance is the Technology Acceptance Model (TAM) (Davis Citation1985, Citation1989). The TAM proposes that perceived usefulness (PU) and perceived ease of use (PEOU) predict user intentions, which in turn predict behaviour. PU can be defined as the extent to which an individual believes that the technology will help them improve their performance on a relevant task (Davis Citation1989). PEOU is defined as, ‘the degree to which a person believes that using a particular system would be free of effort’ (Davis Citation1989, 320). Davis (Citation1989) stated that the goals of this model were to understand how inherent characteristics of the technology are related to motivational characteristics for using the technology, and to be able to predict whether a new technology will be accepted.
The TAM has been previously applied to understand users’ acceptance of AVs (Buckley, Kaye, and Pradhan Citation2018; Choi and Ji Citation2015; Yuen et al. Citation2021). For example, Buckley, Kaye, and Pradhan (Citation2018) found that together, the two TAM predictors significantly accounted for 41% of the variance in intentions to use a conditional AV, after participants had participated in a driving simulator task. However, PU was the only significant predictor of intentions. Further, Yuen et al. (Citation2021) conducted a survey with 274 respondents that investigated both the innovation diffusion theory and TAM on user acceptance of AVs. PU and PEOU were found to significantly explain 75% of the variance in behavioural intentions, with standardised coefficients of 0.59 and 0.37, respectively. Given that the proposed HUD in this study is intended to enhance the usability of AVs, this study also examined how PU and PEOU were influenced by ORBB and whether the HUD displayed a safe or unsafe manoeuvre.
2. Current study
The aim of the current study was to examine participants’ decision-making ability on whether to intervene in a traffic scenario depending on whether the HMI was forecasting that the AV will perform a safe or unsafe manoeuvre ahead using a photo experiment. Photo experiments in the context of automated vehicles have been used before, for example by Hagenzieker et al. (Citation2020). Photo experiments, require less apparatus to conduct compared to simulator studies, and are easier to use on larger sample sizes, particularly if conducted online.
The research also aimed to assess whether the HMI designs would be useful in enhancing safety, trust calibration, and usability of AVs. A series of photos were used to present traffic scenarios to participants. This study also examined participants’ ability to recognise whether a take-over request was required, based on whether the intended pathway was showing an unsafe or safe manoeuvre. The study also assessed whether the presence of ORBB would improve reaction time and intervention decision accuracy. Based on the aforementioned research, it was predicted that:
H1: Participants would have significantly quicker reaction times in deciding whether human intervention was required when exposed to the pathway + object recognition condition (HMI 2) than in the pathway-only condition (HMI 1).
H2: Participants would make more correct decisions on whether human intervention was required when exposed to the pathway + object recognition condition (HMI 2) than in the pathway-only condition (HMI 1).
H3: Participants would report significantly higher ratings of trust when the HUD was displaying a safe manoeuvre than when the HUD was displaying an unsafe manoeuvre.
H4: Participants would report significantly higher ratings of trust when exposed to the pathway + object recognition condition (HMI 2) than the pathway-only condition (HMI 1).
It was not expected that unsafe manoeuvres would be perceived differently in terms of ease of use or usefulness, in comparison to safe manoeuvres, the fifth hypothesis was:
H5: Participants would have similar ratings of PU and PEOU of the HMI, regardless of whether the HUD was displaying a safe manoeuvre or an unsafe manoeuvre.
H6: Participants would report significantly higher ratings of PU and PEOU when exposed to the pathway + object recognition condition (HMI 2) than to the pathway-only condition (HMI 1).
3. Methods
3.1. Participants
Participants were recruited via word of mouth, social media posts (paid and unpaid), email lists, and the QUT SONAFootnote2 system. Participants were offered the chance to enter a prize draw to win one of three x $100 shopping vouchers. First year QUT psychology undergraduate students recruited via the SONA system had the option of receiving 0.5 partial course credit points or entry into the prize draw. Participants were required to live in Australia and hold a valid driving licence (Australian or overseas driving licence). The study received 586 responses of which 495 participants completed the online experiment. Forty-nine participants were excluded because they did not hold a valid licence and 47 participants were excluded as they reported that they held a learner’s permit. A total of 52 participants were removed as they had incorrectly or did not answer the verification questions. After exclusions, there were 394 participants. All participants reported being residents of Australia and their ages ranged from 17 to 85 years (M = 28.24 years, SD = 14.79). Two hundred and fifty-three participants were female, 136 male, and five other/non-binary. Most participants held an open/unrestricted Australian driver’s licence (n = 207), 57 held a provisionalFootnote3 1 driver’s licence, 123 held a provisional 2 driver’s licence, and six participants reported holding an international driver’s licence. Most participants (n = 355) reported residing in Queensland, Australia. In terms of device used to complete the experiment, 89.3% of participants completed the online experiment via a personal computer (either Chrome, Windows, or Macintosh Operating Systems), 7.1% of participants completed the online experiment using a phone, and 3.6% of participants completed the experiment using an iPad.
3.2. Design
A 2 × 2 study design was employed whereby the first independent variable was the type of HMI [two levels: Pathway-only (HMI 1) vs. Pathway + Object Recognition (HMI 2)]. The second independent variable was critical event type (two levels: unsafe vs. safe manoeuvre). Each photograph had a graphic of an HMI overlayed. This HMI that was presented depended on which one of the four conditions the photo was in, as shown in . Where the condition was unsafe the HMI showed the vehicle about to make an unsafe manoeuvre or a silent failure. Where the condition was safe, the HMI showed the vehicle to make the correct/safe manoeuvre.
Table 1. Photo experiment 2 × 2 design conditions.
3.3. Measures
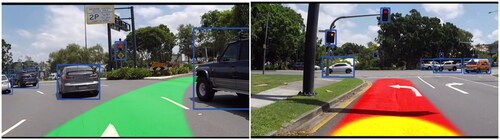
3.3.1. Safety performance
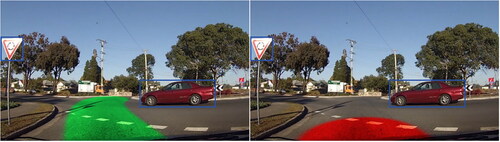
After each photo, participants were asked to answer the question, ‘Is human intervention required in the scenario above?’ by responding Yes or No. If the HUD in the photo showed an unsafe manoeuvre, the correct answer was Yes. If the HUD showed that an unsafe manoeuvre was unlikely, the correct answer was No. These two conditions are shown in . These questions were also timed in milliseconds so that performance could be measured in terms of whether participants responded correctly and how quickly they responded.
Figure 1. Photos from the experiment showing the two HMI 2 (Full HUD) conditions.
3.3.2. Trust
After each photo, three items measured trust towards the AV. The items were custom-built to relate to the content presented in the photos and were, ‘I trust the vehicle to avoid an unsafe manoeuvre ahead’, ‘I trust that the vehicle understands the traffic scenario ahead’, and ‘I can rely on the vehicle to handle the traffic scenario ahead safely’. Each item was responded to using a 7-point Likert Scale from 1 (strongly disagree) to 7 (strongly agree), with higher scores relating to greater trust.
3.3.3. Perceived ease of use
After each photo, three items measured PEOU. The items were custom-built to relate to the task in the current study and were, ‘It was easy to understand what the vehicle would do next’, ‘It is easy to understand what the vehicle can see ahead’, and ‘It was difficult to understand what the visual information meant’. Each item was responded to using a 7-point Likert Scale from 1 (strongly disagree) to 7 (strongly agree), with higher scores indicating higher levels of PEOU, except for the reverse coded item (the last item).
3.3.4. Perceived usefulness
After each photo, three items measured the PU of the HMI. The items were custom-built to relate to the task in the current study and were, ‘The visual information was useful in understanding what the vehicle would do next’, ‘I would find it useful to have this type of visual information in a semi-automated vehicle’, and ‘The visual information did not help me to understand the vehicle’s intentions’. Each item was responded to using a 7-point Likert Scale from 1 (strongly disagree) to 7 (strongly agree), with higher scores indicating higher levels of PU, except for the last item which was reverse coded.
3.4. Procedure
Ethics approval was provided by the Queensland University of Technology (QUT) Human Research Ethics Committee (approval number: 2000000324). This experiment was part of a larger online study. Qualtrics was used to host the online experiment. After providing consent, participants answered questions relating to their demographics (e.g. age and gender) and driving status (e.g. ‘What kind of driving licence do you hold?’). Participants were then provided with some background information on what are semi-AVs, namely, ‘Since fully automated vehicles are hard to engineer, in the meantime, we will transition towards semi-automated vehicles. This is where human supervision of the car is necessary: the human driver must pay attention and be ready to take-over control when requested by the vehicle’.
3.4.1. Verification questions
Following this AV description, participants were asked a verification question, ‘What is a semi-automated vehicle?’ Participants were provided with four response options, of which one was correct. Those who answered this question incorrectly were excluded from the analyses.
3.4.2. Experiment
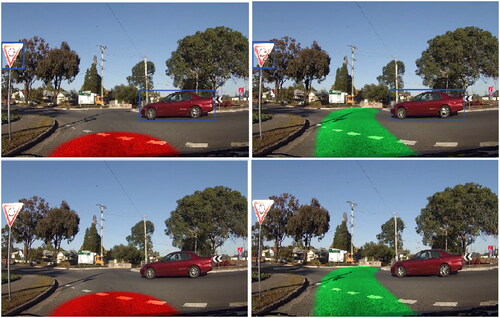
Participants were then provided with the following instructions, ‘The next part of the experiment will involve viewing still photographs of traffic scenarios encountered while driving a semi-automated vehicle. These photographs will also be showing a visual display that tells the human driver what the car intends to do next and what the car can perceive’. Following these instructions, participants were shown four pictures that explained the HMI that they were about to view and examples of traffic scenarios ( and ). shows the pathway and provides a description of the different colours.
Figure 2. In the top left photo showing the pathway as green, participants were explained: ‘If the car intends to ACCELERATE (maintain speed or go faster), a GREEN pathway will be shown’. In the bottom left photo showing the pathway as yellow, participants were explained: ‘If the car intends to CRUISE (neither accelerate nor brake), a YELLOW pathway will be shown’. In the right-hand photo where the pathway is shown as red. Participants were explained: ‘If the car intends to brake (slow down and/or stop), a red pathway will be shown’.
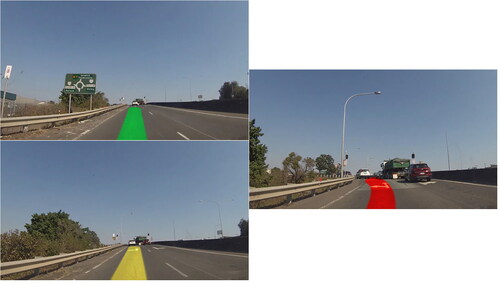
Figure 3. Photo showing the object recognition bounding boxes. Participants were explained: ‘If the car has seen another road user, say a pedestrian or another vehicle; or a traffic sign or traffic lights, it will show a BLUE BOX around it, as shown in the picture above’.
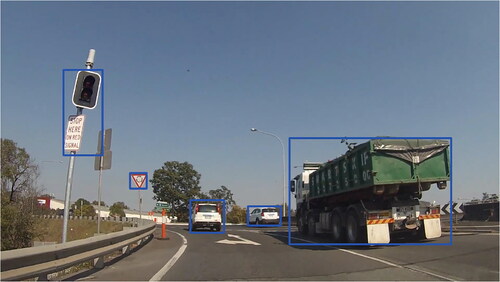
shows the photo that participants saw that explained what the object recognition bounding boxes are and what they signify. These four example photos explained the HMI.
Following this, participants were informed that they were going to view six photos that depict road traffic scenarios. If the SIP forecast an unsafe manoeuvre in the traffic scenario ahead, participants should respond ‘yes’ to the question on whether human intervention is necessary. On the contrary, if the SIP showed a safe manoeuvre in the traffic scenario ahead, participants should respond ‘no’ to the question on whether human intervention is necessary. Before commencing the experiment, participants were shown an example of an unsafe manoeuvre scenario where human intervention is required and an example of a safe scenario where human intervention is not required (see ). Participants were then asked to complete two practice trials to decide whether an intervention would be necessary or not necessary (as in ).
Figure 4. The photos used to explain an unsafe manoeuvre (left) and a safe manoeuvre (right).
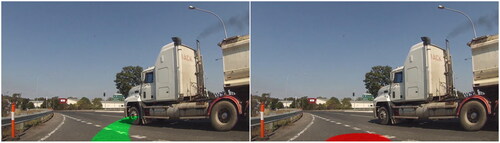
Figure 5. The photos used for the trials used in the experiment.
The participants saw that their response was timed. If they selected the incorrect response, they would be informed that it was the incorrect response and that they should try again. If they selected the correct response, they would be informed that they selected the correct answer and that they could proceed to the next trial. Participants could only proceed to the next stage if they selected the correct response. Prior to the presentation of each photo, a fixation cross was presented for 1 s followed by the photo. The photo remained on the screen until participants responded. shows an example of one of the photos used in the experiment, and how they appear different in each of the four conditions. Participants were exposed to a total of six photos. The order of presentation of the photos was randomised to appear in one of the four conditions.
Figure 6. The same traffic scenario shown in the four different conditions. Photos in the left column are ‘safe’ manoeuvres while those in the right column are ‘unsafe’ manoeuvres. The top row includes object recognition bounding boxes whereas the bottom row does not.
The first item asked whether human intervention was necessary or not. This was a timed question, so the participant’s reaction time was measured. This item asked the participants to decide on whether: a) Intervention is not required as the AV is coping with the critical event or b) Intervention is required as the AV has not detected the critical event ahead. Next, participants responded to the trust, PU, and PEOU items. On average, participants completed the online study in ∼15 min.
4. Results
4.1. Data analysis
As participants viewed each photo in a different condition, a generalised estimating equation model (GEE) was used. Linear mixed model (LMM) analyses were run to test how the two independent variables affected reaction time, intervention required, trust, PEOU, and PU. A binary logistic form of LMM was used for the intervention-required dependent variable as it was dichotomous. The descriptive statistics of the participants are presented below after which the results of each analysis by dependent variable are presented.
4.2. Results of H1: safety performance: reaction time
The mean reaction time estimated marginal means under the unsafe manoeuvre condition was 4753.23 ms (SE = 240.97 ms) which was 1210.7 ms quicker than the mean reaction time for the safe manoeuvre condition of 5963.96 ms (SE = 239.18 ms). The LMM on reaction time (DV) found that the IV of Critical Event Type (unsafe or safe) had a significant effect, F(1, 3117.45) = 13.88, p < .001. However, the IV of HMI type was not significant, F(1, 3106.00) = 0.00, p = .986. Thus, H1, that participants would have quicker reaction times under the pathway + object recognition condition (HMI 2) than the pathway-only condition (HMI 1), was not supported by the results.
4.3. Results of H2: safety performance: intervention required
A total of 3151 responses were recorded for the question asking whether human intervention was required in the photograph displayed. Eighty-seven percent (n = 2740) of responses were correct, whereas the remaining 13% (n = 411) of responses were incorrect. A binary logistic regression form of LMM was conducted to assess whether participants correctly chose to intervene or not to intervene. The responses of Yes and No to, ‘Is Human Intervention Required?’ were recoded as correct or incorrect. The binary logistics LMM found a non-significant test result for the HMI type (HMI 1 vs. HMI 2) on whether the intervention decision was correct, X2 (1, 495) = 0.33, p = .566. Therefore, H2 which predicted that participants would make more correct decisions on whether human intervention was required when exposed to the Pathway + Object Recognition (HMI 2) condition than in the Pathway-only (HMI 1) condition, was not supported by the results.
4.4. Results of H3 and H4: trust
The estimated marginal means for critical event type on trust found higher levels of self-reported trust for the safe condition (M = 5.46, SE = 0.04) compared to the unsafe condition (M = 2.24, SE = 0.05). The LMM found a significant effect for the IV of Critical Event Type (unsafe vs. safe) on the DV of trust F(1, 2934.38) = 6105.88, p < .001. This finding suggests that H3, that participants would report significantly higher ratings of trust when the HUD was displaying a safe manoeuvre than when the HUD was displaying an unsafe manoeuvre, was supported.
The estimated marginal means for the presence of Bounding Box on trust found similar levels of self-reported trust for the ORBB present condition (M = 3.87, SE = 0.04) compared to the ORBB not present condition (M = 3.84, SE = 0.04). The LMM found no significant effect of HMI Type (HMI 1 vs. HMI 2) on self-reported trust ratings, F(1, 2912.54) = 0.60, p = .438. H4, that participants report higher ratings of trust when exposed to the Pathway + Object Recognition (HMI 2) condition than in the Pathway-only (HMI 1) condition, was not supported.
4.5. Results of H5 and H6: perceived ease of use
The estimated marginal means for critical event type on PEOU ratings for the safe condition was 4.75 (SE = 0.03) and for the unsafe condition was 4.53 (SE = 0.03). The LMM found a significant effect for Critical Event Type (unsafe vs. safe) on PEOU, F(1, 2953.86) = 74.79, p < .001. These results do not support H5, that participants would have similar ratings on the PEOU scale, regardless of whether the HUD is displaying a safe manoeuvre or an unsafe manoeuvre. However, while the finding was significant, it is important to acknowledge that both mean scores were ‘4’ on a 7-point Likert scale (1 = strongly disagree, 7 = strongly agree).
The estimated marginal means for the presence of ORBB on PEOU found similar levels of PEOU for the ORBB present condition (M = 4.66, SE = 0.03) compared to the ORBB not present condition (M = 4.61, SE = 0.03). The LMM found no significant effect of HMI Type (HMI 1 vs. HMI 2) on PEOU, F(1, 2930.31) = 3.55, p = .060. Thus, H6, that participants report higher ratings of PEOU when exposed to the Pathway + Object Recognition (HMI 2) condition than in the Pathway-only (HMI 1) condition, was not supported.
4.6. Results of H5 and H6: perceived usefulness of the HMI
The estimated marginal means for critical event type on PU found higher self-report PU ratings for the safe condition (M = 4.82, SE = 0.03) compared to the unsafe condition (M = 4.76, SE = 0.03). The LMM found a significant effect for Critical Event Type (unsafe vs. safe) on PU, F(1, 2894.70) = 9.86, p = .002. The significant result for the predictor of Critical Event Type contradicts H5, which predicted that participants would have the same ratings on the PU scale, regardless of whether the HUD is displaying a safe manoeuvre or an unsafe manoeuvre. However, in practical terms, the difference is negligible, as PU was (M = 4.82, SE = 0.03) under the Safe condition, which is only 0.07 higher than under the Unsafe condition (M = 4.76, SE = 0.03), based on a 7-Point Likert Scale (1 = strongly disagree, 7 = strongly agree), which represents a very small Cohen’s effect size of d = 0.037.
The estimated marginal means for the presence of ORBB on PU found similar ratings of PU for the ORBB present condition (M = 4.79, SE = 0.03) compared to the ORBB not present condition (M = 4.79, SE = 4.79). The LMM found no significant effect for HMI Type on PU ratings, F(1, 2876.77) = 0.01, p = .914. This finding does not support H6 which predicted that participants would report higher ratings of PU when exposed to the Pathway + Object Recognition (HMI 2) condition than in the Pathway-only (HMI 1) condition.
5. Discussion
The current study aimed to examine participants’ decision-making ability on whether to intervene in a traffic scenario depending on whether the HMI was forecasting that the AV will perform a safe or unsafe manoeuvre ahead. The research also aimed to assess whether the HMI designs would be useful in enhancing the safety, trust calibration, and usability of AVs. A series of photos were used to present traffic scenarios to participants. This study also examined participants’ ability to recognise whether a take-over request was required, based on whether the intended pathway was showing an unsafe or safe manoeuvre. The study also assessed whether the presence of ORBB would improve reaction time and intervention decision accuracy. The results only found support for H3, showing that self-report trust ratings were significantly higher when the HUD was showing a safe manoeuvre compared to an unsafe manoeuvre. The results did not find support for the remaining five hypotheses. The findings are discussed in more detail below.
5.1. Trust
Self-reported ratings of trust were significantly higher when the HMI was showing a safe manoeuvre compared to an unsafe manoeuvre. Specifically, and relating back to the items used to measure this construct, it was found that participants were able to make sound judgements as to whether the AV would avoid an unsafe manoeuvre, understand the traffic scenario, and that the AV would handle the traffic scenario ahead safely, based on the pathway. As Kraus et al. (Citation2020) discuss, much of the literature has explored how trust in automation can be built, but few studies have researched how trust dynamically changes during use (i.e. exposure to different road environments and scenarios). Specifically, trust is built based on experienced dependability and predictability (Madhavan and Wiegmann Citation2007). However, while people are often optimistically trusting of new automated systems (Dzindolet et al. Citation2003), trust can also quickly dissipate after the system does not perform as intended (Madhavan and Wiegmann Citation2007). Although intention sharing in the context of AVs has been studied before (Wilbrink, Schieben, and Oehl Citation2020), the results from the current study are novel, as it is the first time, as per the authors’ knowledge, that SIP has been shown to calibrate self-reported trust ratings, particularly in the AV context. This study adds to other emerging research exploring how sharing AV intentions can calibrate trust (Faas et al. Citation2021).
5.2. Object recognition bounding boxes
The current results suggest that the ORBBs did not make any significant difference in terms of ratings of safety performance, trust, PEOU, or PU. These findings suggest that the pathway alone may be effective in providing a safety benefit, in the critical scenarios presented in this experiment. This finding seemingly contrasts that of Phan, Thouvenin, and Frémont (Citation2016) who found that augmented reality cues, including ORBBs, could increase driver awareness in terms of perception, vigilance, and anticipation. The reason why the current study did not find any evidence of these benefits of ORBBs may be due to the particularities of the study design, as the pathway changed between conditions of crash and safe manoeuvre, whereas the ORBBs remained consistent in the two conditions. This is because the road users in the scene did not change, but the intended pathway changed, to represent an imminent crash or safe manoeuvre. Furthermore, Phan, Thouvenin, and Frémont (Citation2016) conducted their study in a simulator, whereas the current study was a photo experiment, and so the dynamic nature of the stimulus may be a contributor to the different results. Nonetheless, given that self-report ratings of trust, PEOU, and PU were similar for both pathway and object recognition (HMI 2) and pathway (HMI 1), there is no evidence that the bounding boxes hindered ratings of trust or usability. Therefore, more research is required to examine the effectiveness of ORBBs in such hazardous scenarios.
5.3. Safety performance of shared intended pathway
The accuracy rate of 87% for deciding whether to intervene or not suggests that the pathway was able to successfully convey whether the AV was about to crash (silent failure) or not. Thus, there is some evidence of the HMI assisting AV drivers anticipate silent failures, building on prior research relating to silent failure detection by providing an HMI solution (Louw et al. Citation2019). On the other hand, significant effects were found for both reaction time and accuracy of decision-making based on whether a safe or crash manoeuvre was displayed by the HMI, such that participant responses were significantly faster under the crash condition. However, participants were also more likely to report an incorrect response under the crash condition than compared to the safe manoeuvre condition. This finding may suggest that participants showed greater urgency in deciding whether to intervene when an unsafe manoeuvre was forecast but also, more errors were made when an unsafe manoeuvre was forecast by the pathway. This finding is in line with a simulator study by Gold et al. (Citation2013) who conducted a highly automated driving scenario experiment where 32 participants had to react to take-over requests of the vehicle. When there was less time provided to complete the take-over request, participants reacted more quickly, but the take-over quality was generally worse. It is plausible that in this current study, the imminent crash made participants want to rush to a decision, which consequently led to a reduction in accuracy. A further consideration is that the reaction time under the crash scenario was 4.8 s, which also included the time for the participant to move their cursor to the appropriate button and click. The current study aimed to test whether the SIP could be correctly interpreted, rather than simulate a realistic take-over. Nonetheless, it is recommended that future studies research a wider variety of traffic scenarios and use other methodologies, such as simulator studies and on-road studies to assess take-over reaction time.
5.4. Technology acceptance model (TAM)
Participants rated the HMI significantly higher in PEOU and PU when the HMI was forecasting a safe manoeuvre than an unsafe manoeuvre, contradicting H5 which predicted that PEOU and PU would be the same regardless of whether the shown manoeuvre was safe or unsafe. However, the mean scores were very similar between the two conditions. Further, participant ratings of PEOU and PU were similar for pathway (HMI 1) and pathway and object recognition (HMI 2). These findings do not support H6 which predicted that PEOU and PU would be higher when object recognition was also presented. These findings contradict those of Wintersberger et al. (Citation2017) who found that AR ORBBs increased self-report ratings of PEOU and PU under automated driving compared to a control condition without any HMI. Differences in the findings between the current study and that of Wintersberger et al. (Citation2017) may be because the current study compared the benefit of ORBBs as an additional feature to SIP, whereas Wintersberger et al. (Citation2017) compared ORBB with a condition that had no HMI at all. However, ORBB also did not reduce the PEOU and PU and so both ORBB and SIP are worthy of further research.
5.5. Strengths, limitations, and future directions
The study included the following strengths. Firstly, since this study was designed as an online experiment, it is possible to derive causal mechanisms between the independent and dependent variables. Secondly, a large sample size was recruited from all over Australia, which strengthens the generalisability of this study. Thirdly, this study is also, as far as the authors are aware, the only published study to have tested the additive effect of ORBBs, as a lone attribute of a visual HMI. Therefore, this study adds to the literature by uniquely exploring SIP and ORBB specifically in experimental scenarios wherein the AV is potentially about to undergo a silent failure.
Despite these strengths, the study also comprised the following limitations. By nature of the study design, the ORBBs did not provide any critical information on whether an unsafe manoeuvre was imminent or not. This information could only be derived from the intended pathway. This meant that this study did not explore all the scenarios under which ORBBs may or may not be useful as an element in a visual HMI. Further, since still photographs were used instead of a simulator or real AV experience, the ecological validity of this study is limited. Further, the use of still photos means that the generalisability is undetermined. It is recommended that future studies expose participants to dynamic footage of AV driving to further investigate the utility of SIP and ORBBs.
The current study provides some evidence to suggest that SIP in AVs could help the driver anticipate crashes in AVs and intervene earlier. Without such an HMI, the driver is left to either guess when an unsafe manoeuvre may happen or wait until the very late stages to intervene, where it may be too late to react. Given that self-report ratings of trust reduced when an unsafe manoeuvre was forecast (compared to a safe manoeuvre), there is evidence to suggest that the HMI could be useful in calibrating trust, providing peace of mind when the AV is functioning well, but also informing the driver when there is an unsafe manoeuvre forecast. It is therefore suggested that SIP is tested further, with the scope of it eventually being trialled in on-road AVs. The current study did not include a control condition and therefore it cannot be determined if participants would be able to detect the silent failures without the SIP. On the other hand, since the experimental manipulation of one of the independent variables was achieved by changing the SIP itself, the presence of the SIP was required under all conditions. However, it is recommended that future research include conditions with and without the SIP to examine if there are any differences in performance.
Future research could also undertake the same experimental design but through the crash vs. safe planned manoeuvre communicated through the ORBBs only. It may be where the ORBBs are always displayed, but in potential crash scenarios, the HMI fails to place ORBBs around a select few, key road users, whilst correctly identifying others. This could help in understanding how ORBBs may help drivers understand what has been recognised and what has been missed by the AV. Further, future studies could involve videos of driving, to allow the participant to get familiarised with the road context leading up to a critical incident and testing to see whether the HMI designs are useful in helping the driver to anticipate an unsafe manoeuvre sooner and intervene sooner.
Furthermore, the current study took a performance approach to test SIP and ORBBs. Future studies could investigate the cognitive processes involved in decision-making related to automated driving. For example, Cognitive Load Theory (Sweller and Chandler Citation1991) could help explain how many stimuli novice and advanced AV drivers can handle, which could help in designing HMIs with SIP and ORBBs. In addition, Gidlöf et al. (Citation2013) conducted an eye-tracking study to infer the cognitive processes involved in decision-making while shopping in a supermarket. Similarly, future studies could use HMI designs for AV driving in eye-tracking studies to understand how drivers process traffic scenarios when a potential silent failure is imminent.
5.6. Conclusion
The current study provided some useful insights into how the AV drivers react to the HMI when it predicts a safe or unsafe manoeuvre, and whether ORBB would provide any additional benefit to AV drivers. It was found that although the SIP was effective in helping participants make the right decision both with and without the ORBBs, demonstrating the critical ability of the SIP to help drivers anticipate unsafe manoeuvres and potential silent failures. The ORBBs were not found to have any influence on trust, safety performance, PEOU, or PU, indicating that the ORBBs did not influence participants’ decisions to intervene or not. This may have been due to attributes of the study design, which emphasised the forecast that the SIP was able to provide, compared to the less relevant information about object recognition that the ORBBs provided. Future studies could focus on ORBBs in isolation from SIP to assess the potential benefits. In contrast, the SIP was found to dynamically calibrate trust to low levels when an unsafe manoeuvre was imminent, and to high levels when the manoeuvre was safe, so it can be said that trust may have been enhanced by the HMI. The current study provides encouraging results for the utility of SIP and future research could explore SIP and ORBB further in a driving simulator or a real AV.
Acknowledgements
The views expressed herein are those of the authors and are not necessarily those of the funders. We would like to thank Mohammad Faramarzian, Catherine Kennon, and Lee Jones for their assistance with producing the graphics for the experiments, setting up the Qualtrics experiment’s advanced features, and advanced statistical advice.
Disclosure statement
No potential conflict of interest was reported by the author(s).
Additional information
Funding
Notes
1 At the time of the crash, the Tesla driver was not paying attention to the road environment.
2 Sona Systems® software is a cloud-based research and participant management solution for universities.
3 The provisional licenses are a part of a graduated driving license scheme in Queensland. In Queensland, Australia, there are two types of provisional licences—P1 and P2. The provisional licenses allow holders to drive unsupervised under some restrictions. The P1 licence is your first provisional licence, before you move onto P2. After the P2, a holder may become eligible to hold an open/unrestricted license where the restrictions of the provisional licenses are not applied.
References
- Alambeigi, H., and A.D. McDonald. 2021. “A Bayesian Regression Analysis of the Effects of Alert Presence and Scenario Criticality on Automated Vehicle Takeover Performance.” Human Factors. doi:10.1177/00187208211010004.
- Bazilinskyy, P., S. Petermeijer, V. Petrovych, D. Dodou, and J. De Winter. 2015. Take-Over Requests in Highly Automated Driving: A Crowdsourcing Survey on Auditory, Vibrotactile, and Visual Displays. Unpublished.
- Bianchi Piccinini, G., E. Lehtonen, F. Forcolin, J. Engström, D. Albers, G. Markkula, J. Lodin, and J. Sandin. 2020. “How Do Drivers Respond to Silent Automation Failures? Driving Simulator Study and Comparison of Computational Driver Braking Models.” Human Factors 62 (7): 1212–1229. doi:10.1177/0018720819875347.
- Boggs, A.M., B. Wali, and A. Khattak. 2020. “Exploratory Analysis of Automated Vehicle Crashes in California: A Text Analytics & Hierarchical Bayesian Heterogeneity-Based Approach.” Accident; Analysis and Prevention 135: 105354. doi:10.1016/j.aap.2019.105354.
- Buckley, L., S.-A. Kaye, and A.K. Pradhan. 2018. “Psychosocial Factors Associated with Intended Use of Automated Vehicles: A Simulated Driving Study.” Accident; Analysis and Prevention 115: 202–208. doi:10.1016/j.aap.2018.03.021.
- Choi, J.K., and Y.G. Ji. 2015. “Investigating the Importance of Trust on Adopting an Autonomous Vehicle.” International Journal of Human-Computer Interaction 31 (10): 692–702.
- Davis, F.D. 1985. A Technology Acceptance Model for Empirically Testing New End-User Information Systems: Theory and Results. Massachusetts Institute of Technology.
- Davis, F.D. 1989. “Perceived Usefulness, Perceived Ease of Use, and User Acceptance of Information Technology.” MIS Quarterly 12 (3): 319–340.
- Doshi, A., S.Y. Cheng, and M.M. Trivedi. 2008. “A Novel Active Heads-up Display for Driver Assistance.” IEEE Transactions on Systems, Man, and Cybernetics, Part B (Cybernetics) 39 (1): 85–93.
- Dzindolet, M.T., S.A. Peterson, R.A. Pomranky, L.G. Pierce, and H.P. Beck. 2003. “The Role of Trust in Automation Reliance.” International Journal of Human-Computer Studies 58 (6): 697–718.
- Ekman, F., M. Johansson, and J. Sochor. 2016. “To See or Not to See: The Effect of Object Recognition on Users’ Trust in “Automated Vehicles”.” Proceedings of the 9th Nordic Conference on Human-Computer Interaction.
- Endsley, M.R. 2017. “Autonomous Driving Systems: A Preliminary Naturalistic Study of the Tesla Model S.” Journal of Cognitive Engineering and Decision Making 11 (3): 225–238.
- Faas, S.M., J. Kraus, A. Schoenhals, and M. Baumann. 2021. “Calibrating Pedestrians’ Trust in Automated Vehicles: Does an Intent Display in an External HMI Support Trust Calibration and Safe Crossing Behavior?” Proceedings of the 2021 CHI Conference on Human Factors in Computing Systems.
- Gidlöf, K., A. Wallin, R. Dewhurst, and K. Holmqvist. 2013. “Using Eye Tracking to Trace a Cognitive Process: Gaze Behaviour during Decision Making in a Natural Environment.” Journal of Eye Movement Research 6 (1): 1–14.
- Gold, C., D. Damböck, L. Lorenz, and K. Bengler. 2013. “‘Take over!’ How Long Does It Take to Get the Driver Back into the Loop?” Proceedings of the Human Factors and Ergonomics Society Annual Meeting.
- Gold, C., M. Körber, C. Hohenberger, D. Lechner, and K. Bengler. 2015. “Trust in Automation–Before and After the Experience of Take-Over Scenarios in a Highly Automated Vehicle.” Procedia Manufacturing 3: 3025–3032.
- Greenlee, E.T., P.R. DeLucia, and D.C. Newton. 2018. “Driver Vigilance in Automated Vehicles: Hazard Detection Failures Are a Matter of Time.” Human Factors 60 (4): 465–476. doi:10.1177/0018720818761711.
- Guo, C., C. Sentouh, J.-C. Popieul, J.-B. Haué, S. Langlois, J.-J. Loeillet, B. Soualmi, and T.N. That. 2019. “Cooperation between Driver and Automated Driving System: Implementation and Evaluation.” Transportation Research Part F: traffic Psychology and Behaviour 61: 314–325.
- Hagenzieker, M.P., S. Van Der Kint, L. Vissers, I.N.G. van Schagen, J. De Bruin, P. Van Gent, and J.J. Commandeur. 2020. “Interactions between Cyclists and Automated Vehicles: Results of a Photo Experiment.” Journal of Transportation Safety & Security 12 (1): 94–115.
- Hoff, K.A., and M. Bashir. 2015. “Trust in Automation: Integrating Empirical Evidence on Factors That Influence Trust.” Human Factors 57 (3): 407–434. doi:10.1177/0018720814547570.
- Kim, S., and A.K. Dey. 2009. “Simulated Augmented Reality Windshield Display as a Cognitive Mapping Aid for Elder Driver Navigation.” Proceedings of the SIGCHI Conference on Human Factors in Computing Systems.
- Königshof, H., N.O. Salscheider, and C. Stiller. 2019. “Realtime 3D Object Detection for Automated Driving Using Stereo Vision and Semantic Information.” 2019 IEEE Intelligent Transportation Systems Conference (ITSC).
- Körber, M., A. Cingel, M. Zimmermann, and K. Bengler. 2015. “Vigilance Decrement and Passive Fatigue Caused by Monotony in Automated Driving.” Procedia Manufacturing 3: 2403–2409.
- Kraus, J., D. Scholz, D. Stiegemeier, and M. Baumann. 2020. “The More You Know: Trust Dynamics and Calibration in Highly Automated Driving and the Effects of Take-Overs, System Malfunction, and System Transparency.” Human Factors 62 (5): 718–736. doi:10.1177/0018720819853686.
- Larue, G.S., A. Rakotonirainy, and A.N. Pettitt. 2011. “Driving Performance Impairments Due to Hypovigilance on Monotonous Roads.” Accident; Analysis and Prevention 43 (6): 2037–2046. doi:10.1016/j.aap.2011.05.023.
- Lee, J.D., and K.A. See. 2004. “Trust in Automation: Designing for Appropriate Reliance.” Human Factors 46 (1): 50–80. doi:10.1518/hfes.46.1.50_30392.
- Louw, T., J. Kuo, R. Romano, V. Radhakrishnan, M.G. Lenné, and N. Merat. 2019. “Engaging in NDRTs Affects Drivers’ Responses and Glance Patterns after Silent Automation Failures.” Transportation Research Part F: Traffic Psychology and Behaviour 62: 870–882.
- Madhavan, P., and D.A. Wiegmann. 2007. “Similarities and Differences between Human–Human and Human–Automation Trust: An Integrative Review.” Theoretical Issues in Ergonomics Science 8 (4): 277–301.
- Mirnig, A.G., P. Wintersberger, C. Sutter, and J. Ziegler. 2016. “A Framework for Analyzing and Calibrating Trust in Automated Vehicles.” Adjunct Proceedings of the 8th International Conference on Automotive User Interfaces and Interactive Vehicular Applications.
- Mole, C., J. Pekkanen, W. Sheppard, T. Louw, R. Romano, N. Merat, G. Markkula, and R. Wilkie. 2020. “Predicting Takeover Response to Silent Automated Vehicle Failures.” PLOS One 15 (11): e0242825.
- Morra, L., F. Lamberti, F.G. Pratticó, S. La Rosa, and P. Montuschi. 2019. “Building Trust in Autonomous Vehicles: Role of Virtual Reality Driving Simulators in HMI Design.” IEEE Transactions on Vehicular Technology 68 (10): 9438–9450.
- Muir, B.M. 1987. “Trust between Humans and Machines, and the Design of Decision Aids.” International Journal of Man-Machine Studies, 27 (5): 527–539. doi:10.1016/S0020-7373(87)80013-5.
- Ososky, S., T. Sanders, F. Jentsch, P. Hancock, and J.Y. Chen. 2014. Determinants of System Transparency and Its Influence on Trust in and Reliance on Unmanned Robotic Systems. Unmanned Systems Technology XVI.
- Phan, M.T., I. Thouvenin, and V. Frémont. 2016. “Enhancing the Driver Awareness of Pedestrian Using Augmented Reality Cues.” 2016 IEEE 19th International Conference on Intelligent Transportation Systems (ITSC).
- Poland, K., M.P. McKay, D. Bruce, and E. Becic. 2018. “Fatal Crash between a Car Operating with Automated Control Systems and a Tractor-Semitrailer Truck.” Traffic Injury Prevention 19 (sup2): S153–S156.
- Rouse, W.B., and N.M. Morris. 1986. “On Looking into the Black Box: Prospects and Limits in the Search for Mental Models.” Psychological Bulletin 100 (3): 349.
- Rousseau, D.M., S.B. Sitkin, R.S. Burt, and C. Camerer. 1998. “Not so Different after All: A Cross-Discipline View of Trust.” Academy of Management Review 23 (3): 393–404.
- SAE. 2018. Sae international releases updated visual chart for its “levels of driving automation” standard forself-driving vehicles. https://www.sae.org/news/press-room/2018/12/sae-international-releases-updated-visual-chart-for-its-%E2%80%9Clevels-of-driving-automation%E2%80%9D-standard-for-self-driving-vehicles
- Schall, M.C. Jr., M.L. Rusch, J.D. Lee, J.D. Dawson, G. Thomas, N. Aksan, and M. Rizzo. 2013. “Augmented Reality Cues and Elderly Driver Hazard Perception.” Human Factors 55 (3): 643–658.
- Strand, N., J. Nilsson, I.M. Karlsson, and L. Nilsson. 2014. “Semi-Automated versus Highly Automated Driving in Critical Situations Caused by Automation Failures.” Transportation Research Part F: Traffic Psychology and Behaviour 27: 218–228.
- Sweller, J., and P. Chandler. 1991. “Evidence for Cognitive Load Theory.” Cognition and Instruction 8 (4): 351–362.
- Thomas, P., and W. David. 1992. “Augmented Reality: An Application of Heads-up Display Technology to Manual Manufacturing Processes.” Hawaii International Conference on System Sciences.
- Wiest, J., M. Höffken, U. Kreßel, and K. Dietmayer. 2012. “Probabilistic Trajectory Prediction with Gaussian Mixture Models.” 2012 IEEE Intelligent Vehicles Symposium.
- Wilbrink, M., A. Schieben, and M. Oehl. 2020. “Reflecting the Automated Vehicle’s Perception and Intention: Light-Based Interaction Approaches for on-Board HMI in Highly Automated Vehicles.” Proceedings of the 25th International Conference on Intelligent User Interfaces Companion.
- Wilckens, V. 1973. “Improvements in Pilot/Aircraft-Integration by Advanced Contact Analog Displays.” MIT Proceedings of the 9th Annual Conference on Manual Control.
- Wintersberger, P., T. von Sawitzky, A.-K. Frison, and A. Riener. 2017. “Traffic Augmentation as a Means to Increase Trust in Automated Driving Systems.” Proceedings of the 12th Biannual Conference on Italian Sigchi Chapter.
- Wintersberger, P., H. Nicklas, T. Martlbauer, S. Hammer, and A. Riener. 2020. “Explainable Automation: Personalized and Adaptive UIs to Foster Trust and Understanding of Driving Automation Systems.” 12th International Conference on Automotive User Interfaces and Interactive Vehicular Applications.
- WHO (World Health Organization). 2018. Global Status Report on Road Safety 2018: Summary.
- Yeh, M., and C.D.J.H.F. Wickens. 2001. “Display Signaling in Augmented Reality: Effects of Cue Reliability and Image Realism on Attention Allocation and Trust Calibration.” Human Factors 43 (3): 355–365.
- Yuen, K.F., L. Cai, G. Qi, and X. Wang. 2021. “Factors Influencing Autonomous Vehicle Adoption: An Application of the Technology Acceptance Model and Innovation Diffusion Theory.” Technology Analysis & Strategic Management 33 (5): 505–519.
- Yun, H., and J.H. Yang. 2020. “Multimodal Warning Design for Take-over Request in Conditionally Automated Driving.” European Transport Research Review 12: 1–11.
- Zhang, B., J. de Winter, S. Varotto, R. Happee, and M. Martens. 2019. “Determinants of Take-Over Time from Automated Driving: A Meta-Analysis of 129 Studies.” Transportation Research Part F: traffic Psychology and Behaviour 64: 285–307.