
 ?Mathematical formulae have been encoded as MathML and are displayed in this HTML version using MathJax in order to improve their display. Uncheck the box to turn MathJax off. This feature requires Javascript. Click on a formula to zoom.
Abstract
Accident analysis methods are used to model the multifactorial cause of adverse incidents. Methods such as AcciMap, STAMP-CAST and recently AcciNet, are systemic approaches that support the identification of safety interventions across sociotechnical system levels. Despite their growing popularity, little is known about how reliable systems-based methods are when used to describe, model and classify contributory factors and relationships. Here, we conducted an intra-rater and inter-rater reliability assessment of AcciMap, STAMP-CAST and AcciNet using the Signal Detection Theory (SDT) paradigm. A total of 180 hours’ worth of analyses across 360 comparisons were performed by 30 expert analysts. Findings revealed that all three methods produced a weak to moderate positive correlation coefficient, however the inter-rater reliability of STAMP-CAST was significantly higher compared to AcciMap and AcciNet. No statistically significant or practically meaningful differences were found between methods in the overall intra-rater reliability analyses. Implications and future research directions are discussed.
Practitioner summary
Practitioners who undertake accident analysis within their organisations should consider the use of STAMP-CAST due to the significantly higher inter-rater reliability findings obtained in this study compared to AcciMap and AcciNet, particularly if they tend to work alone and/or part of relatively small teams
1. Introduction
New accident analysis models and methods have been introduced gradually over the course of the last century (Grant et al. Citation2018; Stanton et al. Citation2019). Notable contributions include the Domino theory of causation (Heinrich Citation1931), Normal Accident Theory (Perrow Citation1984), the Swiss Cheese Model (Reason Citation1990), taxonomy and classification methods (e.g. HFACS) (Shappell and Wiegmann Citation2001), fault and event tree analyses (de Ruijter and Guldenmund Citation2016), and methods based on systems theory and resilience engineering principles (Leveson Citation2004; Hollnagel, Woods, and Leveson Citation2006; Leveson Citation2011a). The diversity in approaches to accident analysis is a product of rapid technological innovation and the growing complexity of modern work systems (Leveson et al. Citation2009; Leveson Citation2011b; Underwood and Waterson Citation2013; Salmon et al. Citation2017b). Indeed, the focus of accident analysis has changed over time, from identifying engineering and hardware failures and subsequently human error and faulty components, to psychological and decision-making factors, to the now prevailing ‘systems-based’ perspective (Hollnagel Citation2004; Leveson Citation2011b; Salmon et al. Citation2011; Khanzode, Maiti, and Ray Citation2012; Underwood and Waterson Citation2013; Waterson et al. Citation2017; Grant et al. Citation2018; Stanton et al. Citation2019). Systems-based analyses consider accidents to be emergent phenomena arising from the complexity of systems whose behaviour cannot be predicted from an analysis of their constituent parts in isolation (Lindberg, Hansson, and Rollenhagen Citation2010). The goal of systems-based accident analysis methods is to model the complex network of contributory factors associated with adverse incidents as a means to identify effective safety interventions and inform organisational learning (Hollnagel Citation2004; Leveson Citation2011a; Salmon et al. Citation2011).
The Human Factors and Ergonomics (HFE) and safety science literature supports the use of a number of systems-based accident analysis methods (Hulme et al. Citation2019). The most widely applied include the Accident Mapping (AcciMap) method (Rasmussen Citation1997; Rasmussen and Svedung Citation2000; Svedung and Rasmussen Citation2002), the Systems-Theoretic Accident Model and Processes and associated Causal Analysis based on Systems Theory method (STAMP-CAST) (Leveson Citation2004; Leveson Citation2011b), the Functional Resonance and Analysis Model (FRAM) (Hollnagel Citation2012), and more recently, the Accident Network (AcciNet) method (Salmon et al. Citation2020b); the latter of which is still very much in its formative stages of application with its wider potential yet to be realised. These methods sit at the cutting-edge of safety management efforts, and in the case of AcciMap and STAMP-CAST, have been applied in various domains and systems over the last two decades (Waterson et al. Citation2017; Hulme et al. Citation2019; Stanton et al. Citation2019; Salmon et al. Citation2020b). Despite their widespread use, there have been few formal studies undertaken to test and compare methods. Previous studies have based their comparisons on several criteria including application time, the use of a taxonomy, the complexity of modelled outputs, prerequisite expertise, data requirements to develop models and networks, coverage of systems theory and principles, and the proposed safety recommendations following analyses (Johnson and de Almeida Citation2008; Katsakiori, Sakellaropoulos, and Manatakis Citation2009; Salmon, Cornelissen, and Trotter Citation2012; Underwood and Waterson Citation2014; Stanton et al. Citation2019). Accordingly, most comparison studies have prioritised an assessment of method usability (i.e. how easy a method is to use) and utility (i.e. how useful are the results/outputs) (Waterson et al. Citation2017; Sauer, Sonderegger, and Schmutz Citation2020). Whilst usability and utility testing is necessary to support method selection and adoption in practice (Stanton and Young Citation2003), there has also been a steady interest in testing the reliability and validity of HFE and safety science methods more broadly (Stanton and Young Citation1999; Kanis Citation2000; Annett Citation2002; Stanton and Young Citation2003; Olsen Citation2013; Kanis Citation2014; Stanton Citation2014; Waterson et al. Citation2015; Shorrock and Williams Citation2016; Stanton Citation2016; Goode et al. Citation2017; Salmon et al. Citation2020c; Thoroman, Salmon, and Goode Citation2020; Hulme et al. Citation2021b; Hulme et al. Citation2021a). A formal assessment of reliability and validity is however, seldom explored in systems-based accident analysis research.
In the context of accident analysis research, reliability testing measures the stability of a method over time, either within (intra-rater reliability) or between (inter-rater reliability) different analysts (Stanton and Young Citation1999; Olsen Citation2013; Stanton Citation2016). On the other hand, criterion-referenced validity measures the extent to which the results produced by a method agree with (i.e. concurrent validity) or predict (i.e. predictive validity) an external criterion, such as an expert or gold standard reference (Stanton Citation2016; Goode et al. Citation2017; Thoroman, Salmon, and Goode Citation2020; Hulme et al. Citation2021a). There are other types of validity as well, including construct and content validity, which assess the theoretical basis and completeness of a method, scale or test, respectively (Stanton Citation2016). From a systems-based accident analysis standpoint, intra-rater and inter-rater reliability, and criterion-referenced validity, indicates the extent to which contributory factors, relationships and modelled outputs are consistently and accurately identified (Hulme et al. Citation2021a).
Whilst reliability and validity are important concepts in and of themselves, there is a special case to be made for examining reliability when modelling the cause of accidents. Ideally, a given method should produce the same results if used on different occasions by the same analyst or between different analysts, provided that the system and/or incident have not changed (Stanton Citation2016). In safety-critical organisations, HFE and safety practitioners may be expected to undertake accident investigation and analysis activities as part of their professional responsibilities. At the least, any discrepancies within or between analyst results could preclude the identification of effective safety-enhancing interventions, and at the most, may result in potentially misleading analyses and dangerous interventions (Salmon Citation2016). Reliability signifies the internal validity of a method and is an essential and necessary precursor of criterion-referenced validity. Further, whilst synthesising multiple accident analyses may increase the identification of true positives, or hits, doing so in the absence of reliability will equally increase the number of type one errors, or false alarms. In other words, aggregating noise produces more of it, when it is the signal, such as a repeat problematic patterns of contributory factors and relationships, that should be the primary target of new safety interventions. A given accident analysis method must therefore be both reliable and valid in order to identify optimal safety interventions from a cost-benefit decision-making perspective (Stanton and Young Citation1999).
Despite the recognised importance of reliability and validity testing in HFE and safety science generally (e.g. Shorrock and Williams Citation2016; Stanton Citation2016; Salmon et al. Citation2020c), as well as accident analysis research specifically (e.g. Goode et al. Citation2017; Waterson et al. Citation2017; Ahmadi et al. Citation2019; Thoroman, Salmon, and Goode Citation2020), only three studies have assessed the stability and accuracy of systems-based accident analysis methods (Goncalves Filho, Jun, and Waterson Citation2019; Hulme et al. Citation2021a; Igene, Johnson, and Long Citation2022). Goncalves Filho et al. (Citation2019) evaluated the inter-rater reliability and empirical validity of AcciMap and STAMP-CAST based on four independent analyses of the South Korea Sewol Ferry incident (Lee et al. Citation2017). Reliability and validity scores were calculated based on percent overlap of the identified casual factors between analysts (reliability) and methods (validity). The results of the causal factor comparison indicated that the reliability of STAMP-CAST (65%) was higher than AcciMap (38%), whereas validity was as low as 8% (Goncalves Filho, Jun, and Waterson Citation2019).
Hulme et al. (Citation2021a) compared the criterion-referenced concurrent validity of AcciMap, STAMP-CAST and AcciNet. The study compared participant analyses against expert analyses to assess whether HFE and safety practitioners could achieve accurate results following a period of method training. The Signal Detection Theory (SDT) paradigm, which accounts for false alarms and correct rejections in addition to hits and misses, was used to assess the validity of the three methods. The results revealed that AcciMap, STAMP-CAST and AcciNet achieved a weak to moderate positive correlation in reference to the expert incident analyses (Hulme et al. Citation2021a). This means there were a higher number of hits and correct rejections relative to false alarms and misses, however the methods still fell short of a more acceptable ≥ +8.0 correlation threshold. It was concluded that the three systems-based accident analysis methods did not produce satisfactory validity results and that further research was required to explore how to enhance their efficacy in practice. Also proposed was a requirement to subject the same three accident analysis methods to a comprehensive intra-rater and inter-rater reliability analysis in follow-up work (Hulme et al. Citation2021a).
Lastly, Igene, Johnson, and Long (Citation2022) recently evaluated AcciMap in the context of healthcare and aimed to determine whether similar factors and causal relationships across a modified framework (i.e. four sociotechnical system levels) could be identified by three independent teams of analysts. Whilst a rigorous quantitative reliability analysis was not the main focus of the authors’ study, a qualitative examination found that contributory factors at the physical actor and processes level were identified more consistently for all analyst teams relative to those factors at the organisational (upper) level. Likewise, the frequency of causal relationships between the groups varied; Team A identified 15 links, Team B identified 31 links, and Team C described 21 links in their AcciMap analysis.
Given the limited number of reliability and validity studies conducted to date, as well as the fact that further research is needed in the systems-based safety methods context, the purpose of this study is to test the intra-rater and inter-rater reliability of AcciMap, STAMP-CAST and AcciNet. Specifically, evaluating the reliability of AcciNet, given its relative infancy, may also provide insights into its practical potential for analysing adverse incidents. Doing so may contribute to its further development and provide an evidence-base for its broader application.
2. Methods
This study is part of comprehensive accident analysis reliability and validity research program that draws on the expertise and participation of HFE and safety practitioners. The reported methods and procedures are the same as those described in a recently published criterion-referenced concurrent validity study comparing AcciMap, STAMP-CAST and AcciNet (Hulme et al. Citation2021a). The reader is encouraged to refer to Hulme et al. (Citation2021a) for a comprehensive overview of the three methods, including their theoretical basis, frameworks, models and networks. Information and guidance around each method can also be found in the source material (AcciMap (Rasmussen Citation1997; Rasmussen and Svedung Citation2000; Svedung and Rasmussen Citation2002); STAMP-CAST (Leveson Citation2004; Leveson et al. Citation2009; Leveson Citation2011a; Leveson Citation2011b); AcciNet (Salmon et al. Citation2020b), including the development of task networks which are integral to AcciNet (Stanton, Salmon, and Walker Citation2018)).
The methods evaluated in this study are primarily analytical, intended to model the interactions between various system components. In contrast, evaluative methods tend to focus more specifically on measuring individual elements, such as a particular variable or construct. The questions of reliability and validity in this latter context align more closely, from an epistemological perspective, with the positivistic scientific paradigm. Given that systems HFE is an interdisciplinary subfield, it inherently accommodates a variety of epistemological perspectives. Therefore, readers should consider this diversity of viewpoints when interpreting and reflecting on the findings presented herein.
2.1. Study design
A test-retest workshop study design with HFE and safety practitioners was used to evaluate the reliability of AcciMap, STAMP-CAST and AcciNet. Participants received training in all three methods and used them to perform an analysis of a fatal road collision (section 2.4.2) on two separate occasions separated by four weeks (Time one (T1) and Time two (T2)). Intra-rater reliability was assessed by comparing a given participant’s T1 results (n1) against their own T2 results (n1) one month later in a within-subject analysis. Inter-rater reliability was assessed by comparing a given participant’s results (n1) against every other participant (n2…n) in a fully crossed between-subject analysis at T2.
Data collection was undertaken in two separate locations: on the campus of the University of the Sunshine Coast (USC) and in a workshop site located in Brisbane’s CBD, Queensland, Australia. Two members of the research team (AH, PS) conducted a total of four, one-day workshops over the course of October and November 2020 at the above locations. There were two workshops at T1, one held at USC and one in Brisbane during October 2020. The same workshop format was repeated one month later at T2 during November 2020. Ethical approval was granted by the USC Human Ethics Research Committee (A201374).
2.2. Participant identification and recruitment
Eligible participants worked in a HFE or safety-related occupation. This included safety auditing, risk assessment, incident investigation and analysis, workplace health and safety, and systems engineering. Full time academics, researchers, government employees, private HFE and safety consultants, and industry professionals were invited to participate. Researchers and practitioners from various safety-critical domains were encouraged to register their interest. Prerequisite experience in applying AcciMap, STAMP-CAST and AcciNet was not required as training in all three methods was provided as part of the study design (section 2.4.1). Potential participants were identified through the research team’s existing networks, as well as through advertisements placed on social media platforms.
Potential participants were e-mailed a pre-screening questionnaire during the months of September and October 2020 to solicit information about their eligibility and workshop availability. There was no online component to the study and so participants had to physically attend the T1 and T2 workshop to be included in the analyses. Out of a total of 71 potential participants who were initially contacted, 48 (67.6%) returned the pre-screening questionnaire. Further information about the study, including dates, locations and the materials required on the day of the first workshop were sent to each registered participant via e-mail. Of the 48 participants who registered for the study, 43 (89.5%) attended the T1 workshop. Seven participants withdrew in the four-week period between T1 and T2. Missing and incomplete data were discovered in six cases following data cleaning. A total of 30 participants were included in the T1 and T2 intra-rater reliability analyses (section 2.5.1), and a subsample of 10 participants were included in the fully-crossed inter-rater reliability analyses (section 2.5.2).
2.3. Participant demographics
The demographics of the 30 participants are presented in .
Table 1. Age and gender of the 30 participants who completed both T1 and T2 of the study.
The primary occupation/profession, qualification, work sector and context, and length of time employed in the current role of the 30 participants can be viewed in .
Table 2. Primary occupation, qualification, work sector, context and length of time employed for the 30 participants who completed both T1 and T2 of the study.
2.4. Materials
2.4.1. Method workshops
Individual information packs containing electronic spreadsheets, analysis templates and guidance documents to support the application of all three accident analysis methods were provided to participants on the morning of the T1 and T2 workshops (Electronic Supplementary Materials; ESM 1-3). Analyses were performed using a personal computer with Microsoft Excel or a similar program with spreadsheet processing capabilities. The workshop format at T1 and T2 was identical to ensure internal experimental validity, particularly for the intra-rater reliability component of the analysis.
At the start of the T1 workshop, two members of the research team (AH, PS) delivered a presentation covering an introduction to complexity theory and systems thinking applied to incident investigation and analysis. Participants then received training in the use of AcciMap, STAMP-CAST and AcciNet and were allocated 30 minutes per method to undertake a practice analysis. The practice analyses involved 10 groups of three to four participants applying each method to analyse the cause of a notable maritime disaster, in this case the capsizing of MS Herald of Free Enterprise (MAIB Citation2015). Participants were free to ask questions about the methods and also received feedback on their performance by cross-examining their practice analysis with the official investigation and analysis of the maritime incident (MAIB Citation2015). The workshop could only progress to the reliability exercise proper when all participants indicated that they understood and felt confident that they could independently use the method in question.
The three one-hour reliability analyses immediately followed each practice session and were performed under exam conditions (e.g. AcciMap training, then the AcciMap practice analysis, followed by the AcciMap reliability analysis). The same format was repeated for STAMP-CAST and AcciNet. Participants were not permitted to work together during the reliability analyses and questions were limited to aspects of the method only. Upon completion of all data collection activities, a total of 180 hours’ worth of analyses had been performed across the 30 participants.
2.4.2. Case study example
The Uber-Volvo incident which occurred on 18th March 2018 in Arizona, USA, was selected as the case study example (NTSB Citation2018). The incident involved a collision between an Uber-Volvo automated vehicle and a pedestrian, resulting in a single fatality. This incident was chosen as, first, there is comprehensive information available online and in the official investigation report (NTSB 2018); and second, the accident is compatible with the three systems-based accident analysis methods under examination as it contained multiple systemic failures (Stanton et al. Citation2019; Salmon et al. Citation2020b). The two members of the research team who facilitated the workshops (AH, PS) delivered a presentation on the Uber-Volvo collision incident, which included a detailed overview of the critical events and factors that contributed to the fatality. Supplementing this presentation was a written description of the incident which was included within each participant information pack. A period of questioning to clarify any details around the Uber-Volvo incident took place prior to the application of the first reliability exercise. Participants were not expected to identify the contributory factors from the incident report to support their analyses. The contributory factors were provided to each participant to isolate the effect of the methods themselves.
2.4.3. AcciMap materials and procedure
Materials to support the AcciMap reliability analysis included an ActorMap representing the various human and non-human factors that had agency within the Uber-Volvo system; a document containing a list of 37 contributory factors; an eight level RMF handout containing the Uber-Volvo system levels; and an electronic spreadsheet template. Participants used the electronic spreadsheet template to record each contributory factor (from the list provided) under what they considered to be the correct level of the Uber-Volvo system. Following this, participants placed all factors onto the RMF handout as a basis to physically draw relationships between them. The 60 AcciMap outputs obtained following T1 and T2 were individually coded and reproduced electronically to support the intra-rater and inter-rater reliability comparisons. The AcciMap reliability exercise therefore contained two phases: (i) the contributory factor assignment phase; and, (ii) the relationship description phase. ESM1 includes the AcciMap materials and participant templates.
2.4.4. STAMP-CAST materials and procedure
Materials to support the STAMP-CAST reliability analysis included a control structure model depicting 14 control and feedback mechanisms across multiple levels of the Uber-Volvo system; a document containing a list of 17 contributory factors; the CAST classification scheme of control and feedback failures; and an electronic spreadsheet template. The first three columns of the electronic spreadsheet template were prefilled with the agents and the control/feedback mechanisms from the control structure model. Participants were required to assign a contributory factor (from the list provided) to what they considered to be the correct control/feedback mechanism and then classify it into a control or feedback failure using the CAST classification scheme. The STAMP-CAST reliability exercise therefore contained two phases: (i) the contributory factor assignment phase; and, (ii) the contributory factor classification phase. ESM2 includes the STAMP-CAST materials and participant templates.
2.4.5. AcciNet materials and procedure
Materials to support the AcciNet reliability analysis included a task network containing a total of 19 key tasks within the Uber-Volvo system; the AcciNet classification scheme; a document containing a list of 35 contributory factors (refined from AcciMap); and an electronic spreadsheet template. The first two columns of the electronic spreadsheet template were prefilled with the tasks and agents from the task network. Participants were required to assign a contributory factor (from the list provided) to what they considered to be the correct task and then classify it using the AcciNet classification scheme. The AcciNet reliability exercise therefore contained two phases: (i) the contributory factor assignment phase; and, (ii) the contributory factor classification phase. ESM3 includes the AcciNet materials and participant templates.
2.5. Signal Detection theory (SDT)
An intra-rater and inter-rater reliability assessment of AcciMap, STAMP-CAST and AcciNet was performed using SDT (Green and Swets Citation1966). SDT uses a cross-tabulation matrix to organise the collection of predicted and observed data for two identical sets of classes ().
Figure 1. The SDT taxonomy. Both intra-rater and inter-rater comparison approaches are indicated.
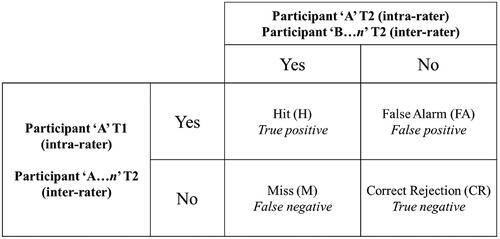
SDT is a framework that supports statistical binary classification of the sort used in computer science and machine learning, medicine and bioinformatics (Marcum Citation1948; Tanner and Swets Citation1954). This framework has been proposed by Stanton and Young (Citation1999) as a way of testing the reliability and validity of HFE and safety methods.
2.5.1. SDT and intra-rater reliability
For the intra-rater reliability analyses, each participant’s T1 contributory factor assignment results and relationship descriptions (in the case of AcciMap); and, their contributory factor assignment results and factor classifications (in the case of STAMP-CAST and AcciNet), were transposed adjacent to the corresponding T2 analysis using electronic spreadsheet software. The SDT followed the approach of ‘does the participant analysis at T1 predict their own analysis at T2?’. Thus, if results were identical, a hit was recorded using the SDT paradigm (i.e. a true positive). If results were different, both a false alarm (predicted by the participant at T1 but not at T2) and miss (predicted by the participant at T2 but not at T1) were recorded, referred to as a false positive and false negative, respectively. The exact number of correct rejections differed between each method. For example, in the case of AcciMap, there were eight system levels across the Uber-Volvo RMF. If a participant assigned a contributory factor to the same system level at T1 and T2, then they had correctly rejected the remaining seven levels. Likewise, there were 37 contributory factors to choose from when describing relationships between factors across levels of the Uber-Volvo system. Thus, if a participant described the same relationship at T1 and T2 between a given pair of factors, then they had correctly rejected a maximum of 35 relationships. However, if the participant had also identified, e.g. two false alarms in addition to the initial hit, then the number of correct rejections would fall to 33. Correct rejections are analogous to true negatives. A total of 90 intra-rater reliability comparisons were made across AcciMap, STAMP-CAST and AcciNet.
2.5.2. SDT and inter-rater reliability
For the inter-rater reliability analyses, each participant’s T2 contributory factor assignment and relationship description or factor classification results were transposed adjacent to every other participant analysis at T2 in a fully crossed design. The SDT followed the approach of ‘does participant A’s analysis at T2 predict participant B’s analysis at T2?’. The application of hits, misses, false alarms and correct rejections remained the same for inter-rater reliability as it did for intra-rater reliability. Additionally, T2 was selected over T1 for the inter-rater reliability analysis as participants had received a second-round of training and further exposure to the methods, serving to consolidate their leaning. In fully crossed inter-rater reliability studies where performing multiple between-subject comparisons is costly and/or time intensive, existing research advises the selection of a subset of participants for analysis (Hallgren Citation2012). Accordingly, 10 (33%) participants representing various domains with at least five-10 years of applied HFE and/or safety practitioner experience were included in the inter-rater reliability analysis. The notation within indicates the primary occupation/profession, qualification, work sector and context, and length of time employed for the 10 analysts. contains their demographics. There were 10 blocks of nine comparisons per method, resulting in 270 inter-rater reliability comparisons across AcciMap, STAMP-CAST and AcciNet. Overall, this study involved a total of 360 individual comparisons when all analyses were considered together.
Table 3. Age and gender of the 10 participants who provided data for the inter-rater reliability component at T2.
2.5.3. SDT metrics
Based on the SDT confusion matrix, the hit rate (HR), or the sensitivity of a given accident analysis method (Equation 1), and the false alarm rate (FAR), or the false positive rate (Equation 2), were computed.
(1)
(1)
(2)
(2)
HR and FAR follow a standardised scale ranging from 0.0 to 1.0. A higher and lower HR and FAR, respectively, indicates a greater level of agreement between either the same participant’s analyses (intra-rater reliability) or between different participant analyses (inter-rater reliability). Reliability and validity studies and reviews have applied thresholds of 70–80% to indicate an acceptable level of agreement between predicted and observed data (Olsen Citation2013; Goode et al. Citation2017; Thoroman, Salmon, and Goode Citation2020; Hulme et al. Citation2021a). Accordingly, the following thresholds were used, with >80% and <20% indicating the acceptable levels of agreement between analyses for HR and FAR, respectively:
<0.2 is a low HR/FAR.
0.2–0.4 is a low to moderate HR/FAR.
0.4–0.6 is a moderate HR/FAR.
0.6–0.8 is a moderate to high HR/FAR.
>0.8 is a high HR/FAR.
Whilst HR and FAR are useful for evaluating the accuracy of a single prediction, such rates remain limited as they only account for two of four categories in SDT (Chicco Citation2017; Chicco and Jurman Citation2020). As a means of considering all four values in the confusion matrix, Matthews Correlation Coefficient (MCC) (Matthews Citation1975), a special case of the ϕ (phi) coefficient, was applied to analyse the complete SDT data (Equation 3).
(3)
(3)
MCC measures the strength of a correlation between the predicted positive and negative values, in this case the participant analyses at T1 and T2, and the observed positive and negative values, in this case the participant analyses at T2. MCC is a reliable statistical approach that produces a relatively high score if the prediction obtains respectable scores in all four matrix categories (Chicco Citation2017; Chicco and Jurman Citation2020). MCC is a more informative statistic relative other commonly applied statistics, such as the harmonic mean of precision and sensitivity, or F1 score ((2H)/(2H + FA + M)), and accuracy ((H + CR)/(H + CR + FA + M)) (Chicco Citation2017). Furthermore, the approach has been used to test the reliability and validity of HFE methods in wide variety of domains, from error prediction methods on flight-decks in aviation (Stanton et al. Citation2009), to Operator Event Sequence Diagrams in road vehicle automation (Stanton et al. Citation2022).
Like other correlation coefficients, including Pearson product-moment correlation coefficient, intraclass or rank, MCC is normalised on a scale from −1.0 to +1.0 (Taylor Citation1990), where:
+1.0/-1.0 is a perfect positive/ideal negative correlation.
+0.8/-0.8 is a strong positive/negative correlation.
+0.5/-0.5 is a moderate positive/negative correlation.
+0.2/-0.2 is a weak positive/negative correlation.
0.0 means no relationship between a set of variables or responses.
A perfect positive correlation is achieved when FA = M = 0 and every data point is correctly classified. An ideal negative correlation is obtained when H = CR = 0 and every data point is misclassified. Thus, the intra-rater and inter-rater reliability of AcciMap, STAMP-CAST and AcciNet is higher as the MCC score approaches positive 1.0.
2.7. Study hypotheses
The intra-rater and inter-rater reliability of AcciMap, STAMP-CAST and AcciNet was not known a priori. The null hypotheses (H0) is that there will be no difference in the SDT metrics (i.e. HR, FAR) or MCC between the three methods or their individual phases – each would perform equally when participant analyses were compared. The alternate hypothesis (H1) was that a difference would be found between the three methods or phases.
2.8. Data presentation
Box and whisker plots were used to display the variability in HR, FAR and MCC for the intra-rater and inter-rater reliability analyses. As described in the study materials and procedures (section 2.4.3, 2.4.4 and 2.4.5), each method contained two phases: (i) the contributory factor assignment phase (all methods); and, (ii) the relationship description (AcciMap) or factor classification (STAMP-CAST, AcciNet) phase. Accordingly, separate box and whisker plots were used to compare differences in the intra-rater and inter-rater reliability HR and FAR between phases within each method; and, were also used to compare differences between the three methods when these two phases were combined. The box and whisker plots were presented in multiple panel and two-way panel figures to convey as much detail as possible with respect to the high number of comparisons performed. The MCC box and whisker plots were created when all four classes in SDT were considered together (i.e. hits, false alarms, misses, correct rejections). Thus, the MCC results indicated the overall intra-rater and inter-rater reliability of AcciMap, STAMP-CAST and AcciNet when all method phases and SDT classes were accounted for.
2.9. Data analysis and interpretation
Statistical analyses were performed using the IBM SPSS package for Windows (version 26, 2019). Data were checked for normality using a combined approach, including a review of skewness and kurtosis z-values, histograms and Q-Q plots. The significance of the Shapiro-Wilk test was inspected to inform the selection of parametric or non-parametric statistical tests. Paired samples t-tests were used to determine differences in the HR and FAR between the contributory factor assignment and relationship description or factor classification phases within each method. Wilcoxon signed rank tests were used in the case of skewed data. One-way repeated measures analysis of variance (ANOVA) tests were used to determine differences in: (i) HR and FAR between AcciMap, STAMP-CAST and AcciNet when the contributory factor assignment and relationship description or factor classification phases were combined; and, (ii) MCC between the three methods when HR and FAR were combined using all classification options in SDT. HR, FAR and MCC represented the continuous dependent variable and the accident analysis method as the categorical independent variable across three levels. The significance of Mauchly’s test of sphericity was evaluated during each ANOVA run. Friedman’s repeated measures comparison test was applied in case of unequal data distribution or should outliers be detected as a result of natural response variability. The Bonferroni correction was applied to all post-hoc tests should the repeated measures reveal a significant difference between methods. The mean (M) and standard deviation (SD) were presented for normally distributed data, whereas the median (Mdn) and interquartile range (IQR) were reported for data that were non-normally distributed. A value of p = <.05 was considered significant for all tests.
The HR, FAR and correlation coefficient thresholds (section 2.5.3) are integral to the interpretation of any observed differences between phases and methods. That is, unlike statistical significance testing which only eliminates the possibility of a chance finding, the thresholds indicate the magnitude of a difference and whether it is practically meaningful. HR, FAR and MCC are expressed along a standardised scale, ranging from either 0.0 to 1.0, or −1.0 to +1.0, and so interpretations of differences in effect size were based on the original units of measurement. Consistent with Hulme et al. (Citation2021a), the unstandardised (raw) effect size categories for differences in HR, FAR and MCC were defined as negligible (<.05), small (.05 − .10), moderate (.10 − .15) and large (≥.15).
3. Results
3.1. Participant expertise ratings
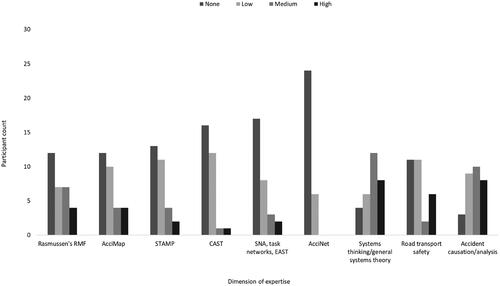
shows the self-reported level of expertise within the participant group across nine dimensions prior to receiving methods training. A majority of participants self-reported a lack of expertise or a low level of expertise in terms of each accident analysis method and their underpinning theories, models and networks (i.e. the RMF, the STAMP control structure, task networks). For example, only eight and two participants reported a medium or high level of expertise in AcciMap and STAMP-CAST, respectively, and all 30 analysts indicated none or a low level of expertise in AcciNet. Two-thirds (20; 66%) of participants in the study sample, however, reported a medium or high level of expertise in systems thinking/general systems theory. Twenty-two (73%) participants reported none or a low level of expertise in road transport safety, whereas 18 (60%) indicated a medium or high level of expertise in accident causation and analysis.
Figure 2. Self-reported level of expertise across nine dimensions for the 30 participants who completed both T1 and T2 of the study. RMF: Risk Management Framework; AcciMap: Accident Mapping; STAMP: Systems-Theoretic Accident Model and Processes; CAST: Causal Analysis based on Systems Theory; SNA: Social Network Analysis; EAST: Event Analysis of Systemic Teamwork; AcciNet: Accident Network.
3.2. Individual phase within method comparison
3.2.1. AcciMap
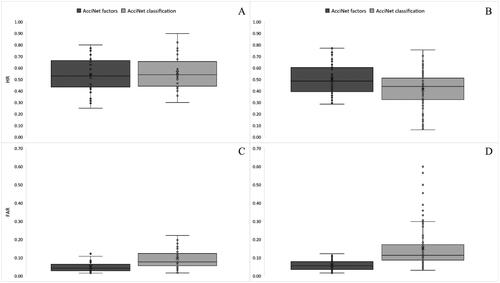
shows HR and FAR for the individual phases of AcciMap. A paired samples t-test produced a significant difference (t(29) = 14.812; p = <.001) in the intra-rater reliability HR between the contributory factor assignment (M [SD] = .76 [.13]) and relationship description (M [SD] = .36 [.19]) phase (). HR was moderate to high for the contributory factor assignment phase, and low to moderate for the relationship description phase. The mean difference was large. A Wilcoxon signed rank test produced a significant difference (Z = 8.194; p = <.001) in the inter-rater reliability HR between the contributory factor assignment (Mdn [IQR] = .57 [.13]) and relationship description (Mdn [IQR] = .27 [.13]) phase (). HR was moderate for the contributory factor assignment phase, and low to moderate for the relationship description phase. The median difference was large.
Figure 3. A comparison of the AcciMap intra-rater reliability HR (panel A) and inter-rater reliability HR (panel B) between the contributory factor assignment and relationship description phases. Beneath is a comparison of the intra-rater FAR (panel C) and inter-rater FAR (panel D) between both phases of AcciMap. Dots denote inner and outlier data points. The mean and median HR and FAR is indicated by a cross and horizontal line, respectively. HR: Hit Rate; FAR: False Alarm Rate.
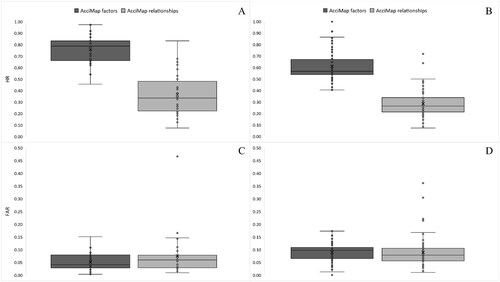
A Wilcoxon signed rank test did not find a significant difference (Z = 1.819; p = .069) in the intra-rater reliability FAR between the contributory factor assignment (Mdn [IQR] = .04 [.05]) and relationship description (Mdn [IQR] = .06 [.05]) phase (). FAR was low for both phases and the median difference was negligible. There was no significant difference (Z = 1.192; p = .233) in the inter-rater reliability FAR between the contributory factor assignment (Mdn [IQR] = .10 [.04]) and relationship description (Mdn [IQR] = .08 [.05]) phase (). FAR was low for both phases and the median difference was negligible. Overall, these results show that reliability was higher for the contributory factor assignment phase compared to the description of relationships between factors.
3.2.2. STAMP-CAST
shows HR and FAR for the individual phases of STAMP-CAST. A paired samples t-test produced a significant difference (t(29) = 4.448; p = <.001) in the intra-rater reliability HR between the contributory factor assignment (M [SD] = .66 [.23]) and factor classification (M [SD] = .43 [.16]) phase (). HR was moderate to high for the contributory factor assignment phase, and moderate for the factor classification phase. The mean difference was large. A Wilcoxon signed rank test produced a significant difference (Z = 3.645; p = <.001) in the inter-rater reliability HR between the contributory factor assignment (Mdn [IQR] = .61 [.20]) and factor classification (Mdn [IQR] = .56 [.27]) phase (). HR was moderate for both phases and the median difference was negligible.
Figure 4. A comparison of the STAMP-CAST intra-rater reliability HR (panel A) and inter-rater reliability HR (panel B) between the contributory factor assignment and factor classification phases. Beneath is a comparison of the intra-rater FAR (panel C) and inter-rater FAR (panel D) between both phases of STAMP-CAST. Dots denote inner and outlier data points. The mean and median HR and FAR is indicated by a cross and horizontal line, respectively. HR: Hit Rate; FAR: False Alarm Rate.
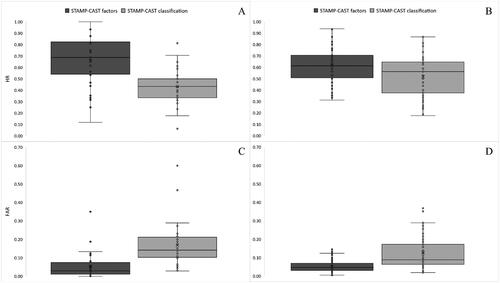
A Wilcoxon signed rank test produced a significant difference (Z = 3.948; p = <.001) in the intra-rater reliability FAR between the contributory factor assignment (Mdn [IQR] = .03 [.06]) and factor classification (Mdn [IQR] = .14 [.11]) phase (). FAR was low for both phases and the median difference was moderate. A significant difference (Z = 6.676; p = <.001) was also found in the inter-rater reliability FAR between the contributory factor assignment (Mdn [IQR] = .05 [.04]) and factor classification (Mdn [IQR] = .09 [.11]) phase (). FAR was low for both phases and the median difference was negligible. Taken together, these findings indicate that reliability was higher for the factor assignment phase compared to the classification of factors using the CAST classification scheme.
3.2.3. AcciNet
shows HR and FAR for the individual phases of AcciNet. A paired samples t-test did not find a significant difference (t(29) = .794; p = .434) in the intra-rater reliability HR between the contributory factor assignment (M [SD] = .54 [.15]) and factor classification (M [SD] = .56 [.15]) phase (). HR was moderate for both phases and the mean difference was negligible. A Wilcoxon signed rank test produced a significant difference (Z = 4.831; p = <.001) in the inter-rater reliability HR between the contributory factor assignment (Mdn [IQR] = .49 [.21]) and factor classification (Mdn [IQR] = .44 [.19]) phase (). HR was moderate for both phases and the median difference was negligible.
Figure 5. A comparison of the AcciNet intra-rater reliability HR (panel A) and inter-rater reliability HR (panel B) between the contributory factor assignment and factor classification phases. Beneath is a comparison of the intra-rater FAR (panel C) and inter-rater FAR (panel D) between both phases of AcciNet. Dots denote inner and outlier data points. The mean and median HR and FAR is indicated by a cross and horizontal line, respectively. HR: Hit Rate; FAR: False Alarm Rate.
A Wilcoxon signed rank test produced a significant difference (Z = 4.289; p = <.001) in the intra-rater reliability FAR between the contributory factor assignment (Mdn [IQR] = .04 [.04]) and factor classification (Mdn [IQR] = .08 [.07]) phase (). FAR was low for both phases and the median difference was negligible. A significant difference (Z = 8.010; p = <.001) was also found in the inter-rater reliability FAR between the contributory factor assignment (Mdn [IQR] = .06 [.04]) and factor classification (Mdn [IQR] = .11 [.08]) phase (). FAR was low for both phases and the median difference was negligible. According to these results, inter-rater reliability was higher for the factor assignment phase compared to the classification of factors when using AcciNet. There was no difference in intra-rater reliability.
3.3. Combined phase between method comparison
shows HR and FAR between the three methods when the contributory factor assignment and relationship description or factor classification phases were combined. A one-way repeated measures ANOVA did not find a significant difference (F(2, 58) = .144; p = .866; ηp2 = .005) in the intra-rater reliability HR between AcciMap (M [SD] = .56 [.14]), STAMP-CAST (M [SD] = .54 [.14]) and AcciNet (M [SD] = .55 [.13]) (). HR was moderate for all methods and mean differences were negligible. A comparison of the repeated measures using Friedman’s test produced a significant difference (χ2(2) = 43.017; p = <.001) in the inter-rater reliability HR between AcciMap (Mdn [IQR] = .42 [.15]), STAMP-CAST (Mdn [IQR] = .57 [.15]) and AcciNet (Mdn [IQR] = .42 [.18]) (). Post-hoc testing with the Bonferroni correction revealed that HR was significantly different between AcciMap and STAMP-CAST (p = <.001), and STAMP-CAST and AcciNet (p = <.001). No significant difference was found between AcciMap and AcciNet (p = .576). HR was moderate for all methods. The median difference between AcciMap and STAMP-CAST was large whereas the median difference between AcciMap and AcciNet was negligible. The median difference between STAMP-CAST and AcciNet was large.
Figure 6. A comparison of the intra-rater reliability HR (panel A) and inter-rater reliability HR (panel B) between AcciMap, STAMP-CAST and AcciNet when both the contributory factor assignment and relationship description/classification phases were combined. Beneath is a comparison of the intra-rater FAR (panel C) and inter-rater FAR (panel D) between the three methods. Dots denote inner and outlier data points. The mean and median HR and FAR is indicated by a cross and horizontal line, respectively. HR: Hit Rate; FAR: False Alarm Rate.
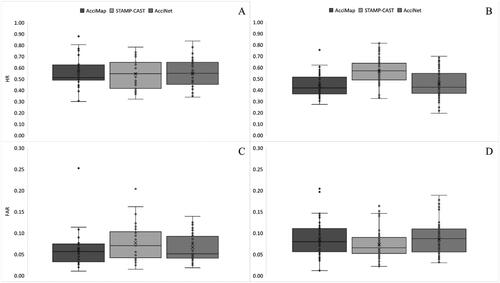
A comparison of the repeated measures using Friedman’s test did not find a significant difference (χ2(2) = 5.839; p = .054) in the intra-rater reliability FAR between AcciMap (Mdn [IQR] = .06 [.04]), STAMP-CAST (Mdn [IQR] = .07 [.06]) and AcciNet (Mdn [IQR] = .05 [.05]) (). FAR was low for all methods and median differences were negligible. A repeated measures comparison using Friedman’s test produced a significant difference (χ2(2) = 11.598; p = .003) in the inter-rater reliability FAR between AcciMap (Mdn [IQR] = .08 [.05]), STAMP-CAST (Mdn [IQR] = .07 [.04]) and AcciNet (Mdn [IQR] = .09 [.05]) (). Post-hoc testing with the Bonferroni correction revealed that FAR was significantly different between AcciMap and STAMP-CAST (p = .007), and STAMP-CAST and AcciNet (p = .046). No significant difference was found between AcciMap and AcciNet (p = 1.00). FAR was low for all methods and median differences were negligible. It is concluded that when both method phases were combined, inter-rater reliability was highest for STAMP-CAST compared to AcciMap and AcciNet. No difference in intra-rater reliability was found.
3.4. MCC Between method comparison
shows MCC between the three methods when the contributory factor and relationship description or factor classification phases, and HR and FAR, were combined. These results indicate the overall intra-rater and inter-rater reliability of AcciMap, STAMP-CAST and AcciNet. A one-way repeated measures ANOVA did not produce a significant difference (F(2, 58) = .253; p = .777; ηp2 = .009) in the intra-rater reliability MCC between AcciMap (M [SD] = .49 [.17]), STAMP-CAST (M [SD] = .47 [.19]) and AcciNet (M [SD] = .48 [.17]) (). A weak to moderate positive correlation coefficient was found for all methods and mean differences were negligible.
Figure 7. A comparison of the intra-rater reliability MCC (panel A) and inter-rater reliability MCC (panel B) between AcciMap, STAMP-CAST and AcciNet when HR and FAR were combined using the SDT paradigm. Dots denote inner and outlier data points. The mean and median MCC is indicated by a cross and horizontal line, respectively. MCC: Matthew’s Correlation Coefficient.
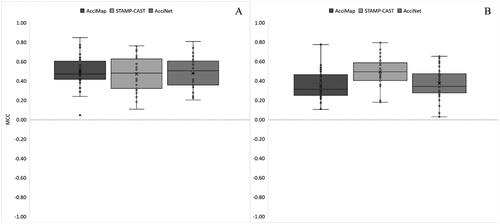
A comparison of the repeated measures using Friedman’s test found a significant difference (χ2(2) = 38.958; p = <.001) in the inter-rater reliability MCC between AcciMap (Mdn [IQR] = .31 [.21]), STAMP-CAST (Mdn [IQR] = .49 [.18]) and AcciNet (Mdn [IQR] = .34 [.20]) (). Post-hoc testing with the Bonferroni correction revealed that MCC was significantly different between AcciMap and STAMP-CAST (p = <.001), and STAMP-CAST and AcciNet (p = <.001). No significant difference was found between AcciMap and AcciNet (p = 1.00). All methods achieved a weak to moderate positive correlation coefficient; however, STAMP-CAST was marginally close to a moderate positive correlation. The median difference between AcciMap and STAMP-CAST was large whereas the median difference between AcciMap and AcciNet was negligible. The median difference between STAMP-CAST and AcciNet was large. This result demonstrates that in the overall comparison, there was no difference in intra-rater reliability between the three methods; however, STAMP-CAST achieved the highest inter-rater reliability compared to AcciMap and AcciNet.
4. Discussion
The purpose of this study was to test the intra-rater and inter-rater reliability of AcciMap, STAMP-CAST and AcciNet. There is a recognised need to test and ensure the reliability and validity of HFE and safety management methods with poor levels impacting the use and utility of the methods in practice (Stanton and Young Citation1999; Kanis Citation2000; Annett Citation2002; Stanton and Young Citation2003; Olsen Citation2013; Kanis Citation2014; Stanton Citation2014; Waterson et al. Citation2015; Shorrock and Williams Citation2016; Stanton Citation2016; Goode et al. Citation2017; Salmon et al. Citation2020c; Thoroman, Salmon, and Goode Citation2020; Hulme et al. Citation2021b; Hulme et al. Citation2021a). Despite this, a paucity of research has examined the stability and accuracy of systems-based accident analysis methods specifically (e.g. Goncalves Filho, Jun, and Waterson Citation2019; Hulme et al. Citation2021a; Igene, Johnson, and Long Citation2022), and so further applications are required. In particular, testing the reliability of AcciNet may also shed light on its potential reliability, elucidating its comparative strengths against established methods as a basis to identify areas for improvement. The following discussion covers the individual phase within method comparisons, the combined phase between method comparisons, and the MCC between method comparisons when all method phases and SDT classes were accounted for.
4.1. Individual phase within method comparison
The findings for each method individually point to considerable differences between method phases. For AcciMap, the findings show that the identification of relationships between contributory factors was not reliable within and across analysts. The intra-rater reliability assessment for AcciMap indicated a significant difference in HR between the contributory factor assignment and relationship description phase (). The mean difference of .40 was large in effect, demonstrating that intra-analyst stability was considerably higher when placing factors across levels of the Uber-Volvo system relative to the identification of relationships between contributory factors. Of further note is the difference in HR variability between phases. The range in HR for the contributory factor assignment and relationship description phase was .51 and .75, respectively. This suggests that participants were also relatively consistent in terms of their test-retest performance when placing factors across system levels. Whilst four (13%) analysts achieved a moderate to high level of agreement between time points when describing relationships, the remaining majority (n = 26; 87%) described different relationships when faced with the same system and accident at T2. This findings highlights the difficulties around reproducing accident analyses when using AcciMap. It also suggests that basing new safety interventions on a single analysis may inhibit the ability to appropriately learn from adverse incidents in the absence of further data and verification.
The AcciMap inter-rater reliability results reflected a similar trend regarding HR differences between the contributory factor assignment and relationship description phase (). Not only was a significant difference found between phases, but the median difference of .30 was large in magnitude. The IQR between phases was, however, identical. This finding demonstrates a low to moderate level of agreement between different analysts when describing relationships between contributory factors across the Uber-Volvo system. Multiple independent analyses of the same system and accident did not therefore reach an acceptable level of agreement in this study. No statistically significant or practical difference was found in the intra-rater and inter-rater reliability FAR between AcciMap phases. This is a product of a high correct rejection frequency, especially for the second phase of the method, which is an artefact of the study design and SDT. However, as can viewed in , a small number of participants produced a low to moderate intra-rater and inter-rater FAR for the relationship description phase.
With STAMP-CAST, classification of the contributory factors into control and feedback failures was problematic in terms of reliability. A moderate to high intra-rater reliability HR was associated with the assignment of contributory factors to the control and feedback mechanisms across the Uber-Volvo control structure. Conversely, a moderate intra-rater reliability HR was found for the STAMP-CAST factor classification phase (). The mean difference of .23 was both significant and large in effect. This finding points to potential issues around the STAMP-CAST classification scheme. Each participant when asked to undertake the same accident analysis four weeks later did not, on average, use the STAMP-CAST classification scheme in the same way. The variability in HR was, however, larger for the contributory factor assignment phase demonstrated by a range of .88 and IQR of .28. This can be compared to a range of .75 and IQR of .17 for the second phase of STAMP-CAST. These findings show that whilst the analyst group achieved higher overall levels of test-retest reliability when assigning contributory factors to the control and feedback mechanisms described, they also varied widely in terms of their individual capability to reproduce results. This could be due to the influence of a greater learning effect that occurred only for the first phase of STAMP-CAST.
A statistically significant difference in the inter-rater reliability HR between the phases of STAMP-CAST was identified, however the size of the difference was negligible. Both phases of STAMP-CAST were associated with a moderate inter-rater reliability HR (). As each datapoint in the inter-rater reliability analyses represented one of 90 individual comparisons, the findings reveal that 14 (16%) and three (3%) analyst pairs produced a high (>.80) level of agreement in terms of HR for the contributory factor assignment and factor classification phase, respectively. The inter-rater reliability findings for STAMP-CAST were therefore better than the scores obtained following the intra-rater reliability analysis, albeit they were still far from acceptable.
There were further apparent differences in the intra-rater and inter-rater reliability FAR between the contributory factor assignment and factor classification phases of STAMP-CAST. The intra-rater reliability FAR was low for both phases; however, the median difference was moderate (). Clearly there were a higher number of false alarms relative to correct rejections for the factor classification phase, which is consistent with the results obtained in the HR analyses. Whilst a significant difference was also found in the inter-rater reliability FAR between phases, the unstandardised median effect size was negligible ().
Differences in the intra-rater and inter-rater reliability HR and FAR between phases for AcciNet were not as pronounced relative to AcciMap and STAMP-CAST. For example, the intra-rater reliability HR was moderate for both the contributory factor assignment and factor classification phase, and the mean difference was negligible (). Data spread and IQR were similar. This finding indicates that intra-analyst stability was similar and consistent for both phases of AcciNet, whether this be assigning factors to the corresponding task within the Uber-Volvo system task network or classifying them with the AcciNet classification scheme. A statistically significant difference in the inter-rater reliability HR was, however, found between phases (). Although the HR was moderate for both the contributory factor assignment and factor classification phase, the practical median difference was negligible. A more interesting finding regarding the inter-rater reliability assessment pertains to the observed variability in analyst scores. Whilst the maximum inter-rater reliability HR was comparable between AcciNet phases, 17 (19%) analyst pairs produced a HR for the factor classification phase that was lower than the minimum value (.29) identified for the contributory factor assignment phase. Specifically, the range in HR for the contributory factor assignment and factor classification phase was .48 and .70, respectively. This finding demonstrates a lower level of agreement between different analysts when classifying factors using the AcciNet classification scheme. Clear definitions and descriptions around each AcciNet classification mode is required to support consistent inter-analyst coding performance.
Whilst a statistically significant difference was found in the intra-rater and inter-rater FAR between AcciNet phases, the size of the difference was negligible in practical terms (). The high frequency of correct rejections recorded for each true positive using SDT, particularly for AcciMap and AcciNet which supported a relatively large number of contributory factors and relationships or classification options, ensured that the average FAR remained low. Lastly, the inter-rater reliability comparison for AcciNet indicated that there were only seven instances by which the FAR for the contributory factor assignment phase was lower than, or equal to, the paired FAR for the factor classification phase (negative ranks and ties). In other words, the FAR was higher in 83 (92%) analyst pairs for the second phase of AcciNet (). This shows that whilst the FAR was still acceptably low, the false alarm frequency associated with the classification of factors relative to correct rejections was, on average, higher than those identified when assigning factors to the Uber-Volvo system task network.
4.2. Combined phase between method comparison
This study also examined between method differences when the contributory factor assignment and relationship description or factor classification phases were combined (i.e. representative of a complete incident analysis). Accordingly, there was no statistical or practical difference in the intra-rater reliability HR between methods in the combined phase analysis (). Specifically, the intra-rater reliability HR was comparable and moderate between AcciMap, STAMP-CAST and AcciNet. Conversely, the inter-rater reliability HR results show that STAMP-CAST was associated with a significantly higher HR relative to AcciMap and AcciNet (). This finding indicates that STAMP-CAST produced the highest inter-rater reliability HR when used to analyse the Uber-Volvo collision.
The intra-rater and inter-rater reliability FAR results for the between methods comparison analysis were congruent with the above HR results. No statistically significant or meaningful effect size differences were found between the three methods for the intra-rater reliability analysis (). The repeated measures comparison did show that STAMP-CAST had a significantly lower FAR relative to AcciMap and AcciNet in the inter-rater reliability analysis (; Panel D). The magnitude of the difference was negligible, and all three methods produced a low FAR.
4.3. MCC Between method comparison
The final set of results show the overall reliability of AcciMap, STAMP-CAST and AcciNet when both method phases were combined and all four SDT classes were analysed together. First, there was no significant difference in the intra-rater reliability MCC between the three methods, all of which produced a weak to moderate positive correlation coefficient (). The inter-rater reliability assessment on the other hand, revealed a noticeable difference between the methods. The degree of agreement between different analysts when analysing the Uber-Volvo collision was significantly higher for STAMP-CAST relative to AcciMap and AcciNet. Further, the median difference in MCC between STAMP-CAST and the other two methods was high. The systems-based accident analysis method that achieved the highest inter-rater reliability score was STAMP-CAST. This suggests that, for the present analysis at least, STAMP-CAST was the most reliable both within and across analysts.
4.4. Summary of findings and recommendations
and include a summary of the main findings. The first major finding points to the difficulty around reproducing AcciMap analyses, particularly regarding the description of relationships between contributory factors. The second phase of AcciMap was the only phase out of the three methods to produce a low to moderate HR in the intra-rater and inter-rater reliability analyses, suggesting that this aspect of the method is not reliable (). Further, there was a large and moderate difference in the intra-rater reliability HR and FAR, respectively, between the contributory factor assignment and the factor classification phase of STAMP-CAST ().
Table 4. Summary of the findings for the individual phase within method comparisons.
Table 5. Summary of main findings for the combined phase between method comparisons and the MCC results. Only large differences defined as ≥.15 units are shown.
Despite the observed differences between phases, all three accident analysis methods did not achieve an acceptable (>.80) intra-rater and inter-rater reliability HR. Conversely, FAR was acceptably (<.20) low due to the high number of correct rejections recorded for each true positive. Accordingly, it is important to note that the participants in this study were free to select and correctly reject any factor or classification mode from the resources provided in reference to their own (intra-rater) or others (inter-rater) analyses. Thus, whilst there is an argument to be made about implicit decision-making responses when using SDT for the above purposes, there is still a conscious element of choice involved which is difficult to objectively quantify. Finally, when hits, misses, false alarms and correct rejections were considered together in SDT, all three accident analysis methods produced a weak to moderate positive correlation between T1 and T2 (intra-rater reliability) and every other analysis performed at T2 (inter-rater reliability). Nevertheless, STAMP-CAST produced a significantly higher inter-rater reliability coefficient relative to AcciMap and AcciNet (). Whilst this study has not assessed usability or utility, or evaluated criterion-referenced validity, this latter finding may encourage the adoption of STAMP-CAST in practice from a reliability perspective. The provision of the STAMP control structure, which is a fitting conceptual representation of the system, as well as the simplicity in the control and feedback failures taxonomy, might explain why STAMP-CAST achieved the highest relative levels of reliability.
4.5. Implications
The findings from this study suggest that there is work required to help enhance the reliability of AcciMap, STAMP-CAST and AcciNet. In relation to AcciMap, the findings provide further evidence that analysts tend to perform poorly when identifying relationships between contributory factors (Hulme et al. Citation2021a). This suggests that practitioners require support when identifying interactions as found across all levels of the system. One avenue to improve the identification of relationships between contributory factors when using AcciMap is the provision of software support. For example, the UPLOADS incident reporting and learning App (Salmon et al. Citation2017a), the software presents the contributory factor descriptions back to users and asks them to select appropriate relationships. In addition, the provision of contributory classification scheme (e.g. Salmon et al. Citation2020a) could enhance the reliability and validity of relationship identification (as analysts begin to see patterns in the types of contributory factors that are often related with one another). Taking this further, artificial intelligence-based software support and large language models could suggest potential relationships to analysts, however this is still yet to be seen and tested.
In the case of STAMP-CAST, the findings add further weight to the notion that a more user-friendly taxonomy of control and feedback failures could be useful (Salmon, Cornelissen, and Trotter Citation2012). The current taxonomy has previously been criticised for its engineering basis, hence further work could explore the development and testing of a new taxonomy designed to enhance the reliability and validity of classifications when particularly used in intentional, or social systems. Whilst the use of a well-constructed taxonomy in accident analysis can potentially promote consistency in the categorisation of incident types, its effectiveness also depends on design and scope and should be accompanied by a thorough investigation process, relevant expertise and be adaptable to capture factors that may not fit precisely into well-defined categories.
The findings also indicate areas of potential development for AcciNet, particularly in relation to the contributory factor taxonomy. It is apparent that this taxonomy, although still in its early stages, may require further refinement to enhance its effectiveness and reliability in practical applications. This finding should be understood in the context of AcciNet’s novelty and the fact that this method may further evolve. We note that the classification of contributory factors via taxonomy is only offered by Salmon et al. (Citation2020b) as an optional step and also that other classification schemes are recommended (Salmon et al. Citation2020a). As AcciNet continues to be tested and perhaps improved, it may present unique strengths or innovations that distinguish it from more established methods, contributing to a more comprehensive and nuanced toolset for accident analysis. Therefore, the current findings are to be considered as part of an ongoing process of development, testing and refinement, aimed at realising the full potential of the AcciNet method.
4.6. Limitations and research considerations
The same limitations and research considerations apply here as they did with a study focussed on assessing the criterion-referenced validity of accident analysis methods (Hulme et al. Citation2021a). First, the STAMP-CAST and AcciNet methods use a hierarchical control structure (Leveson Citation2004) and task network (Stanton, Salmon, and Walker Citation2018) to describe and model systems, respectively. In the present case, the STAMP control structure and task network were used to model the Uber-Volvo system as a basis to support the accident analyses. In the case of STAMP-CAST and AcciNet, participants were provided with the completed control structure and task network, including all control and feedback mechanisms, and tasks and relationships (section 2.2.4 and 2.4.5). Consequently, the intra-rater and inter-rater reliability results would have been negatively impacted had participants developed their own control structure model and task network of the Uber-Volvo system, or indeed been asked to use the methods in an investigative capacity rather than purely analysis. Accordingly, providing a list of contributory factors in each participant ‘package’ increased experimental control relative to a real-life practitioner-oriented experiment.
Second, the self-reported level of expertise within the analyst sample across various theoretical and method dimensions was low (). Whilst six hours’ worth of training in AcciMap, STAMP-CAST and AcciNet was provided prior to the reliability analyses, the results may have been influenced by the level of expertise reported and whether the participants worked exclusively or not in an incident analysis capacity. The variability in all SDT metrics was considerable, with few analysts achieving high reliability levels and others indicating low agreement. An interesting area of future research is to test and compare methods amongst a highly trained group of expert analysts and place the results in context of those here. Further, it would be useful to repeat the present study with a more in-depth training program for each of the methods (e.g. a day long workshop for each method). A similar consideration can be aimed at academic qualifications in the sample; 24 (80.0%) participants reported having a PhD/Doctorate and/or a Master’s degree/postgraduate qualification. This overrepresentation is, if anything, a positive in terms of sample representativeness as individuals working in risk assessment, incident analysis, or safety management more generally are likely to have formal training in a related discipline. However, an argument can be made that experience and expertise in the use of a method is more important than qualifications when it comes to its effective application. Taken together, the level of expertise and demographic characteristics of our sample should be considered in reference to the obtained results and a noted as a key factor in future comparisons.
Third, as was the case in the validity study (Hulme et al. Citation2021a), the correct rejection frequency was high relative to hits, misses and false alarms. If all four categories in the SDT paradigm are included in future analyses, it may be worth thinking about ways in which to reduce the correct rejection frequency without penalising reliability and validity outcomes. For example, new rulesets could dictate which factors across levels of the RMF are conceivably related and those which are not (in the case of AcciMap); or which classification categories and modes in the classification scheme could reasonably apply to the particular contributory factor or failure identified (in the case of STAMP-CAST and AcciNet).
Fourth, AcciMap, STAMP-CAST and AcciNet should be applied to other systems and domains for the purposes of undertaking further method comparisons. This would allow for a better understanding of reliability generalisation as all adverse incidents fundamentally differ with respect to the level of complexity, factor interactions and causes. Likewise, it would be useful to compare accident analyses performed by teams versus individuals, whether in a fully cooperative approach or one that involves a process of independent verification. The hypothesis might be that greater level of stability in the result is achieved when accident investigation and analysis is undertaken as a group.
5. Conclusion
This study has tested and compared the intra-rater and inter-rater reliability of AcciMap, STAMP-CAST and AcciNet. The reliability findings revealed that all three methods produced a weak to moderate positive correlation coefficient. In the between method comparison analysis, STAMP-CAST produced a significantly higher inter-rater reliability coefficient relative to AcciMap and AcciNet. The findings suggest further work is required to enhance the reliability of systems-based accident analysis methods, with a large part of any potential improvements coming from further method training. These results may be used to inform the selection of systems-based accident analysis methods, albeit to a point, as other criteria to assist in their adoption is needed, including measures of usability, utility and validity. Further systems-based safety methods comparisons are encouraged in the HFE and safety science literature.
Supplemental Material
Download Zip (565.1 KB)Acknowledgements
The authors thank Mrs Kerri Salmon for helping with the logistical aspects of the study including planning, organising and booking out the testing locations. Further, the authors are grateful for the assistance provided by Ms Courtney Wilkie who helped with data cleaning and analysis. The authors thank each and every participant for their valuable time and willingness to apply the accident analysis methods on two separate occasions. This was a considerable undertaking, and we are truly grateful for their passion in helping to advance HFE and safety science practice.
Disclosure statement
No potential conflict of interest was reported by the author(s).
Additional information
Funding
References
- Ahmadi, O., S.B. Mortazavi, A. Khavanin, and H. Mokarami. 2019. “Validity and Consistency Assessment of Accident Analysis Methods in the Petroleum Industry.” International Journal of Occupational Safety and Ergonomics: JOSE 25 (3): 355–361. doi:10.1080/10803548.2017.1387400.
- Annett, J. 2002. “A Note on the Validity and Reliability of Ergonomics Methods.” Theoretical Issues in Ergonomics Science 3 (2): 228–232. doi:10.1080/14639220210124067.
- Chicco, D. 2017. “Ten Quick Tips for Machine Learning in Computational Biology.” BioData Mining 10 (1): 35. doi:10.1186/s13040-017-0155-3.
- Chicco, D., and G. Jurman. 2020. “The Advantages of the Matthews Correlation Coefficient (MCC) over F1 Score and Accuracy in Binary Classification Evaluation.” BMC Genomics 21 (1): 6. doi:10.1186/s12864-019-6413-7.
- de Ruijter, A., and F. Guldenmund. 2016. “The Bowtie Method: A Review.” Safety Science 88: 211–218. doi:10.1016/j.ssci.2016.03.001.
- Goncalves Filho, A.P., G.T. Jun, and P. Waterson. 2019. “Four Studies, Two Methods, One Accident – an Examination of the Reliability and Validity of Accimap and STAMP for Accident Analysis.” Safety Science 113: 310–317. doi:10.1016/j.ssci.2018.12.002.
- Goode, N., P.M. Salmon, N.Z. Taylor, M.G. Lenné, and C.F. Finch. 2017. “Developing a Contributing Factor Classification Scheme for Rasmussen’s AcciMap: Reliability and Validity Evaluation.” Applied Ergonomics 64: 14–26. doi:10.1016/j.apergo.2017.04.014.
- Grant, E., P.M. Salmon, N.J. Stevens, N. Goode, and G.J.M. Read. 2018. “Back to the Future: What Do Accident Causation Models Tell us about Accident Prediction?” Safety Science 104: 99–109. doi:10.1016/j.ssci.2017.12.018.
- Green, D.M, and J.A. Swets. 1966. Signal Detection Theory and Psychophysics. Ney York, USA, Wiley New York.
- Hallgren, K.A. 2012. “Computing Inter-Rater Reliability for Observational Data: An Overview and Tutorial.” Tutorials in Quantitative Methods for Psychology 8 (1): 23–34. doi:10.20982/tqmp.08.1.p023.
- Heinrich, H.W. 1931. Industrial Accident Prevention. A Scientific Approach. New York, USA, McGraw-Hill.
- Hollnagel, E. 2004. Barriers and Accident Prevention. Aldershot: Ashgate.
- Hollnagel, E. 2012. FRAM, the Functional Resonance Analysis Method: Modelling Complex Socio-Technical Systems. Farnham, England, Ashgate Publishing, Ltd.
- Hollnagel, E., D.D. Woods, and N. Leveson. 2006. Resilience Engineering: Concepts and Precepts. Farnham: Ashgate.
- Hulme, A., N.A. Stanton, G.H. Walker, P. Waterson, and P.M. Salmon. 2021a. “Are Accident Analysis Methods Fit for Purpose? Testing the Criterion-Referenced Validity of AcciMap, STAMP-CAST and AcciNet.” Safety Science 144: 105454. doi:10.1016/j.ssci.2021.105454.
- Hulme, A., N.A. Stanton, G.H. Walker, P. Waterson, and P.M. Salmon. 2021. “Complexity Theory in Accident Causation: Using AcciMap to Identify the Systems Thinking Tenets in 11 Catastrophes.” Ergonomics 64 (7): 821–838. doi:10.1080/00140139.2020.1869321.
- Hulme, A., N.A. Stanton, G.H. Walker, P. Waterson, and P.M. Salmon. 2021b. “Testing the Reliability and Validity of Risk Assessment Methods in Human Factors and Ergonomics. Ergonomics under Review.” Ergonomics 65 (3): 407–428. doi:10.1080/00140139.2021.1962969.
- Hulme, A., N.A. Stanton, G.H. Walker, P. Waterson, and P.M. Salmon. 2019. “What Do Applications of Systems Thinking Accident Analysis Methods Tell us about Accident Causation? A Systematic Review of Applications between 1990 and 2018.” Safety Science 117: 164–183. doi:10.1016/j.ssci.2019.04.016.
- Igene, O.O., C.W. Johnson, and J. Long. 2022. “An Evaluation of the Formalised AcciMap Approach for Accident Analysis in Healthcare.” Cognition, Technology & Work 24 (1): 161–181. doi:10.1007/s10111-021-00669-w.
- Johnson, C.W, and I.M. de Almeida. 2008. “An Investigation into the Loss of the Brazilian Space Programme’s Launch Vehicle VLS-1 V03.” Safety Science 46 (1): 38–53. doi:10.1016/j.ssci.2006.05.007.
- Kanis, H. 2000. “Questioning Validity in the Area of Ergonomics/Human Factors.” Ergonomics 43 (12): 1947–1965. doi:10.1080/00140130050201418.
- Kanis, H. 2014. “Reliability and Validity of Findings in Ergonomics Research.” Theoretical Issues in Ergonomics Science 15 (1): 1–46. doi:10.1080/1463922X.2013.802058.
- Katsakiori, P., G. Sakellaropoulos, and E. Manatakis. 2009. “Towards an Evaluation of Accident Investigation Methods in Terms of Their Alignment with Accident Causation Models.” Safety Science 47 (7): 1007–1015. doi:10.1016/j.ssci.2008.11.002.
- Khanzode, V.V., J. Maiti, and P.K. Ray. 2012. “Occupational Injury and Accident Research: A Comprehensive Review.” Safety Science 50 (5): 1355–1367. doi:10.1016/j.ssci.2011.12.015.
- Lee, S., Y.B. Moh, M. Tabibzadeh, and N. Meshkati. 2017. “Applying the AcciMap Methodology to Investigate the Tragic Sewol Ferry Accident in South Korea.” Applied Ergonomics 59 (Pt B): 517–525. doi:10.1016/j.apergo.2016.07.013.
- Leveson, N. 2011a. “Applying Systems Thinking to Analyze and Learn from Events.” Safety Science 49 (1): 55–64. doi:10.1016/j.ssci.2009.12.021.
- Leveson, N. 2004. “A New Accident Model for Engineering Safer Systems.” Safety Science 42 (4): 237–270. doi:10.1016/S0925-7535(03)00047-X.
- Leveson, N., N. Dulac, K. Marais, and J. Carroll. 2009. “Moving beyond Normal Accidents and High Reliability Organizations: A Systems Approach to Safety in Complex Systems.” Organization Studies 30 (2-3): 227–249. doi:10.1177/0170840608101478.
- Leveson, N.G. 2011b. Engineering a Safer World: Systems Thinking Applied to Safety. Cambridge, USA, The MIT Press.
- Lindberg, A.K., S.O. Hansson, and C. Rollenhagen. 2010. “Learning from Accidents – What More Do we Need to Know?” Safety Science 48 (6): 714–721. doi:10.1016/j.ssci.2010.02.004.
- MAIB 2015. Flooding and capsize of ro-ro passenger ferry Herald of Free Enterprise with loss of 193 lives. Retrieved 7 May, from https://www.gov.uk/maib-reports/flooding-and-subsequent-capsize-of-ro-ro-passenger-ferry-herald-of-free-enterprise-off-the-port-of-zeebrugge-belgium-with-loss-of-193-lives.
- Marcum, J.I. 1948. 19. A statistical theory of target detection by pulsed radar. Retrieved August, from https://www.rand.org/pubs/research_memoranda/RM754.html#related.
- Matthews, B.W. 1975. “Comparison of the Predicted and Observed Secondary Structure of T4 Phage Lysozyme.” Biochimica et Biophysica Acta 405 (2): 442–451. doi:10.1016/0005-2795(75)90109-9.
- NTSB 2018. National Transportation Safety Board Preliminary Report Highway: HWY18MH010. https://www.ntsb.gov/investigations/AccidentReports/Pages/HWY18MH010-prelim.aspx
- Olsen, N.S. 2013. “Reliability Studies of Incident Coding Systems in High Hazard Industries: A Narrative Review of Study Methodology.” Applied Ergonomics 44 (2): 175–184. doi:10.1016/j.apergo.2012.06.009.
- Perrow, C. 1984. Normal Accidents: Living with High-Risk Technologies. New York: Basic Books.
- Rasmussen, J. 1997. “Risk Management in a Dynamic Society: A Modelling Problem.” Safety Science 27 (2-3): 183–213. doi:10.1016/S0925-7535(97)00052-0.
- Rasmussen, J., Svedung, I. (2000). Proactive risk management in a dynamic society, Swedish Rescue Services Agency.
- Reason, J. 1990. Human Error. New York: Cambridge University Press.
- Salmon, P.M. 2016. “Bridging the Gap between Ergonomics Methods Research and Practice: Methodological Issues in Ergonomics Science Part II.” Theoretical Issues in Ergonomics Science 17 (5-6): 459–467. doi:10.1080/1463922X.2016.1200693.
- Salmon, P.M., M. Cornelissen, and M.J. Trotter. 2012. “Systems-Based Accident Analysis Methods: A Comparison of Accimap, HFACS, and STAMP.” Safety Science 50 (4): 1158–1170. doi:10.1016/j.ssci.2011.11.009.
- Salmon, P.M., N. Goode, N. Taylor, M.G. Lenné, C.E. Dallat, and C.F. Finch. 2017a. “Rasmussen’s Legacy in the Great Outdoors: A New Incident Reporting and Learning System for Led Outdoor Activities.” Applied Ergonomics 59 (Pt B): 637–648. doi:10.1016/j.apergo.2015.07.017.
- Salmon, P.M., A. Hulme, G.H. Walker, P. Waterson, E. Berber, and N.A. Stanton. 2020a. “The Big Picture on Accident Causation: A Review, Synthesis and Meta-Analysis of AcciMap Studies.” Safety Science 126: 104650. doi:10.1016/j.ssci.2020.104650.
- Salmon, P.M., A. Hulme, G.H. Walker, P. Waterson, and N.A. Stanton. 2020b. “The Accident Network (AcciNet): a New Accident Analysis Method for Describing the Interaction between Normal Performance and Failure.” Proceedings of the Human Factors and Ergonomics Society Annual Meeting 64 (1): 1676–1680. doi:10.1177/1071181320641407.
- Salmon, P.M., Read, G.J.M., Walker, G.H., Stevens, N.J., Hulme, A., McLean, S., Stanton, N.A. (2020c). Methodological issues in systems Human Factors and Ergonomics: Perspectives on the research–practice gap, reliability and validity, and prediction. Human Factors and Ergonomics in the Manufacturing and Service Industries: 1–14.
- Salmon, P.M., N.A. Stanton, M. Lenne, D.P. Jenkins, L. Rafferty, and G.H. Walker. 2011. Human Factors Methods and Accident Analysis: Practical Guidance and Case Study Applications. Surrey: Ashgate Publishing, Ltd.
- Salmon, P.M., G.H. Walker, G.J.M. Read, N. Goode, and N.A. Stanton. 2017b. “Fitting Methods to Paradigms: Are Ergonomics Methods Fit for Systems Thinking?” Ergonomics 60 (2): 194–205. doi:10.1080/00140139.2015.1103385.
- Sauer, J., A. Sonderegger, and S. Schmutz. 2020. “Usability, User Experience and Accessibility: Towards an Integrative Model.” Ergonomics 63 (10): 1207–1220. doi:10.1080/00140139.2020.1774080.
- Shappell, S.A, and D.A. Wiegmann. 2001. “Applying Reason: The Human Factors Analysis and Classification System (HFACS).” Human Factors and Aerospace Safety 1: 59–86.
- Shorrock, S.T, and C.A. Williams. 2016. “Human Factors and Ergonomics Methods in Practice: Three Fundamental Constraints.” Theoretical Issues in Ergonomics Science 17 (5-6): 468–482. doi:10.1080/1463922X.2016.1155240.
- Stanton, N.A. 2014. “Commentary on the Paper by Heimrich Kanis Entitled ‘Reliability and Validity of Findings in Ergonomics Research’: where is the Methodology in Ergonomics Methods?” Theoretical Issues in Ergonomics Science 15 (1): 55–61. doi:10.1080/1463922X.2013.778355.
- Stanton, N.A. 2016. “On the Reliability and Validity of, and Training in, Ergonomics Methods: A Challenge Revisited.” Theoretical Issues in Ergonomics Science 17 (4): 345–353. doi:10.1080/1463922X.2015.1117688.
- Stanton, N.A., J.W. Brown, K.M.A. Revell, J. Kim, J. Richardson, P. Langdon, M. Bradley, N. Caber, L. Skrypchuk, and S. Thompson. 2022. “OESDs in an on-Road Study of Semi-Automated Vehicle to Human Driver Handovers.” Cognition, Technology & Work 24 (2): 317–332. doi:10.1007/s10111-021-00682-z.
- Stanton, N.A., P. Salmon, D. Harris, A. Marshall, J. Demagalski, M.S. Young, T. Waldmann, and S.W.A. Dekker. 2009. “Predicting Pilot Error: Testing a New Methodology and a Multi-Methods and Analysts Approach.” Applied Ergonomics 40 (3): 464–471. doi:10.1016/j.apergo.2008.10.005.
- Stanton, N.A., P.M. Salmon, and G.H. Walker. 2018. Systems Thinking in Practice: Applications of the Event Analysis of Systemic Teamwork Method. Boca Raton, FL: CRC Press.
- Stanton, N.A., P.M. Salmon, G.H. Walker, and M. Stanton. 2019. “Models and Methods for Collision Analysis: A Comparison Study Based on the Uber Collision with a Pedestrian.” Safety Science 120: 117–128. doi:10.1016/j.ssci.2019.06.008.
- Stanton, N.A, and M.S. Young. 2003. “Giving Ergonomics Away? The Application of Ergonomics Methods by Novices.” Applied Ergonomics 34 (5): 479–490. doi:10.1016/S0003-6870(03)00067-X.
- Stanton, N.A, and M.S. Young. 1999. “What Price Ergonomics?” Nature 399 (6733): 197–198. doi:10.1038/20298.
- Svedung, I., and J. Rasmussen. 2002. “Graphic Representation of Accident Scenarios: Mapping System Structure and the Causation of Accidents.” Safety Science 40 (5): 397–417. doi:10.1016/S0925-7535(00)00036-9.
- Tanner, W.P, and J.A. Swets. 1954. “A Decision-Making Theory of Visual Detection.” Psychological Review 61 (6): 401–409. doi:10.1037/h0058700.
- Taylor, R. 1990. “Interpretation of the Correlation Coefficient: A Basic Review.” Journal of Diagnostic Medical Sonography 6 (1): 35–39. doi:10.1177/875647939000600106.
- Thoroman, B., P.M. Salmon, and N. Goode. 2020. “Evaluation of Construct and Criterion-Referenced Validity of a Systems-Thinking Based near Miss Reporting Form.” Ergonomics 63 (2): 210–224. doi:10.1080/00140139.2019.1694707.
- Underwood, P., and P. Waterson. 2013. “Systemic Accident Analysis: Examining the Gap between Research and Practice.” Accident; Analysis and Prevention 55: 154–164. doi:10.1016/j.aap.2013.02.041.
- Underwood, P., and P. Waterson. 2014. “Systems Thinking, the Swiss Cheese Model and Accident Analysis: A Comparative Systemic Analysis of the Grayrigg Train Derailment Using the ATSB, AcciMap and STAMP Models.” Accident; Analysis and Prevention 68: 75–94. doi:10.1016/j.aap.2013.07.027.
- Waterson, P., D.P. Jenkins, P.M. Salmon, and P. Underwood. 2017. “Remixing Rasmussen’: The Evolution of Accimaps within Systemic Accident Analysis.” Applied Ergonomics 59 (Pt B): 483–503. doi:10.1016/j.apergo.2016.09.004.
- Waterson, P., M.M. Robertson, N.J. Cooke, L. Militello, E. Roth, and N.A. Stanton. 2015. “Defining the Methodological Challenges and Opportunities for an Effective Science of Sociotechnical Systems and Safety.” Ergonomics 58 (4): 565–599. doi:10.1080/00140139.2015.1015622.