
 ?Mathematical formulae have been encoded as MathML and are displayed in this HTML version using MathJax in order to improve their display. Uncheck the box to turn MathJax off. This feature requires Javascript. Click on a formula to zoom.
It is shown that the thermal conductivity of anharmonic insulators can be derived parameter free and self-consistently from the temperature (T) dependence of the phonon–phonon scattering momentum, the phonon group velocities, and the specific heat. Using the example of SrTiO3 the phonon mean free path is derived from the Fourier transform of the acoustic—optic mode crossing momentum. The temperature dependence of the phonon group velocities is self-consistently evaluated from the soft optic, acoustic phonon modes, which are also the input for the calculation of the specific heat. The overall quantitative agreement with experimental data suggests further applications to other anharmonic systems like, e.g., KTaO3 PbTe, and related materials.
The thermal conductivity (TC) of solids is typically characterized by temperature dependent phonon scattering processes which at low temperatures are in the ballistic regime and follow at high temperature the normal Fourier heat conduction. The calculation of the TC is mostly based on the Callaway model [Citation1] and modifications of it [Citation2,Citation3], where instead of scattering lengths relaxation times are introduced which, however, are rather difficult to evaluate explicitly for a specific system. In addition, an exact knowledge of the phonon spectrum and its temperature dependence are indispensable. Extensive studies of the TC have been devoted to ferroelectric or almost ferroelectric compounds since their lattice dynamics is governed by large anharmonicity [Citation4–13]. A recent study of SrTiO3 (STO) and doped STO has revealed a novel region in the TC, namely a regime of phonon Poiseuille flow where TC evolves faster than cubic in temperature [Citation12]. A similar observation has been made before in (Ta1-xNbxSe4)2I which has been attributed to extremely strong anharmonicity [Citation14].
Here it is shown that quite generally the TC can be rather simply evaluated in ferroelectric and almost ferroelectric systems by calculating their specific heat, the temperature dependent phonon–phonon scattering length and the temperature dependent phonon group velocity. The model is parameter free, meaning that the interaction constants are derived from the temperature independent zone boundary optic mode frequency, the temperature dependent zone boundary acoustic mode frequency, whereas the transverse soft optic mode frequency is derived self-consistently. Details about the self-consistent phonon approximation are given in Refs. [Citation15–17], and applications to STO in Refs. [Citation18–20]. The procedure outlined in these papers resembles closely the work of Ref. [Citation21]. The overall features of the calculated TC are in good quantitative agreement with experimental data. In view of the fact that the lattice dynamics of STO are well understood, this compound is taken as an example. Extensions to doped STO are discussed.
STO is one of the best investigated perovskite oxides due to its outstanding properties and its wide application range. In analogy to true ferroelectric perovskites it exhibits long wave length transverse optic mode softening over a broad temperature interval [Citation22–24], where the completion of softening is, however, inhibited by quantum fluctuations which was named quantum paraelectricity [Citation25]. Besides of the soft optic mode also a transverse acoustic zone boundary mode softens and freezes at 105 K, inducing a structural phase transition from cubic to tetragonal [Citation26–28]. This transition is characterized by the oxygen octahedral rotation angle [Citation29]. Ferroelectricity can be induced in STO by either isotopic replacement of 16O by 18O [Citation30,Citation31] or by introducing small amounts of Ca at the Sr lattice site thereby causing an XY pseudospin ferroelectric transition [Citation32]. Also the replacement of Ba at the Sr site yields a polar transition [Citation33]. Small amounts of oxygen vacancies rapidly change the system from insulating to semiconducting and metallic [Citation34–36], where superconductivity is observed at low temperature and unusually small carrier density [Citation37,Citation38]. Similarly, superconductivity sets in with small amounts of Nb doping [Citation39,Citation40]. This superconducting state is unusual since it corresponds to the first two-band superconductor after its prediction.
The lattice dynamics of STO has been investigated in detail using the polarizability model [Citation15–17]. This model is superior to first-principles approaches and effective Hamiltonian schemes, since it enables a self-consistent derivation of all relevant temperature dependent properties of ferroelectric and quantum paraelectric perovskite oxides and IV–VI semiconductors [Citation19]. Its basic ingredients are attractive harmonic interactions in the local electron-lattice coupling stabilized by long range repulsive fourth-order anharmonic terms [Citation15–17]. Upon treating the latter by a cumulant expansion, pseudo-harmonic temperature dependent effective interactions are obtained which have to be calculated self-consistently for each temperature T. In this way the soft modes which dominate the lattice dynamics are derived. Simultaneously, the double-well potential of the respective compound is obtained which is characteristic for each compound and differs significantly between those [Citation20].
While for a long time the focus was on the soft lattice modes only, early on an apparent anomaly in the related transverse acoustic mode was observed at finite momentum experimentally [Citation21, Citation41–45], which attracted little attention. This mode-mode coupling induced anomalies could also be reproduced within the polarizability model and assigned to elastic finite size precursor dynamics. With decreasing temperature the precursors grow in size to eventually occupying the full sample size at the phase transition temperature [Citation46,Citation47]. Simultaneously, also polar nano domains emerge, which coexist with the soft mode and evidence that order/disorder and displacive dynamics coexist, however, on different time and length scales [Citation48].
The above preliminaries are an important ingredient to calculate the TC for anharmonic almost ferroelectric compounds since from them the phonon–phonon scattering length is extracted which defines the mean free path to be used further.
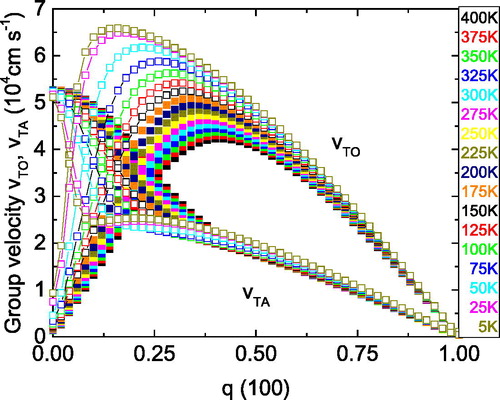
Basically, the TC is simply the product of specific heat cv, the phonon mean free path lph, and the phonon group velocity. All quantities are temperature dependent, which is the main reason for the difficulties in calculating the TC. In the following the temperature dependent dispersion of the lowest transverse optic (TO) and related transverse (TA) acoustic modes in the (100) direction are used to derive these three quantities. These modes have been chosen since they are strongly temperature dependent and are coupled by higher order anharmonic interactions which cause the loss of their individual character at intermediate momentum. As such they are no longer elementary excitation like but adopt a hybrid type character which is a consequence of the strong TO softening. This softening leads to a TO–TA coupling and an avoided crossing with characteristic wave vector which defines the phonon mean free path as discussed in deeper detail below. Importantly, the strong TO mode temperature dependence induces also a temperature-dependence in the crossing region which is especially strong at low temperature where quantum fluctuations dominate the lattice dynamics of STO. The dispersion for these two modes is shown in as a function of temperature where the mode-mode coupling momentum space is highlighted by the encircled area. While detailed experimental data for the phonon mode dispersion are not available, the temperature dependence of the q = 0 optic mode has been measured and is presented in the inset to the figure in comparison to theoretical results evidencing the convincing agreement between both. To increase the mode-mode coupling visibility, the difference between optic and acoustic mode is formed where the minimum in it defines the maximum phonon scattering momentum () since it indicates the avoided crossing region of the two modes under consideration As is obvious from , the minimum in the mode difference moves with decreasing temperature to the long wave length limit, whereas it saturates at an almost constant value in the high temperature regime. In addition, the difference becomes smaller and smaller with decreasing temperature. The corresponding momentum value q is Fourier transformed in order to extract the real space length scale of the scattering event as shown in the inset to . This can be approximated by an exponential as displayed by the full line in the inset which defines in the following the phonon mean free path lph. This definition is related to the fact that anharmonicity induced phonon–phonon scattering takes place at the crossing momentum value.
Figure 1. (a) The phonon dispersion of the lowest transverse optic (squares) and acoustic (circles) modes of STO along (100) as a function of temperature; the inset to the figure shows the squared of the soft ferroelectric mode as a function of temperature (black line and symbols) in comparison to experimental data (blue and green stars) from Refs. [Citation49,Citation50]; (b) the difference between the transverse optic (TO) and transverse acoustic (TA) mode frequencies as a function of momentum q and temperature. The inset to this figured shows the phonon mean free path which is derived from the minimum in Δ(ω) = ωTO(q) − ωTA(q), where the inverse of the crossing momentum of optic and acoustic modes defines the mean free path
which is identical for both modes.
![Figure 1. (a) The phonon dispersion of the lowest transverse optic (squares) and acoustic (circles) modes of STO along (100) as a function of temperature; the inset to the figure shows the squared of the soft ferroelectric mode ωTO2(q=0) as a function of temperature (black line and symbols) in comparison to experimental data (blue and green stars) from Refs. [Citation49,Citation50]; (b) the difference between the transverse optic (TO) and transverse acoustic (TA) mode frequencies as a function of momentum q and temperature. The inset to this figured shows the phonon mean free path which is derived from the minimum in Δ(ω) = ωTO(q) − ωTA(q), where the inverse of the crossing momentum of optic and acoustic modes defines the mean free path lph which is identical for both modes.](/cms/asset/de839bb9-c2ff-43f8-8e2a-254b448689d3/gfer_a_1683492_f0001_c.jpg)
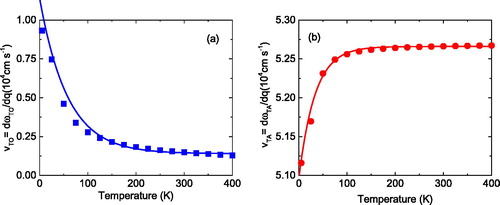
Furthermore, the group velocities of acoustic and optic modes are readily obtained from by forming the derivative of both modes with respect to q ().
Figure 2. Group velocities of the optic vTO and the acoustic vTA modes as a function of momentum q and temperature.
For both, optic and acoustic modes ωTO and ωTA, the long wave length limit of the velocities vTO, vTA is taken and plotted as a function of temperature in . These quantities enter Equation (3) below and are the essential ingredients to evaluate the temperature dependence of the TC [Citation51,Citation52]. Interestingly, their individual behavior is grossly different also with respect to the order of magnitude of the velocities. While the optic mode velocity increases exponentially with decreasing temperature, it increases for the acoustic mode velocity with increasing temperature. In the high temperature region both saturate at small values for the former and at large values for the latter.
Figure 3. (a) vTO in the limit q → 0 as a function of temperature, (b) the same as (a) but for vTA. The squares and circles refer to the calculations, the full lines are obtained from an exponential fit to the calculation. Note, that the scale of the y-axis is different in both figures.
Knowing the temperature dependent dispersion of STO, it is rather straightforward to calculate the phonon specific heat cV, which is explicitly given by:
(1)
(1)
where k is the Boltzmann constant and T temperature. EquationEquation (1)
(1)
(1) is integrated with respect to q over the whole Brillouin zone. The dispersion as shown in is used for each temperature. Since the phase transition from cubic to tetragonal at TS = 105 K is driven by a zone boundary acoustic mode, which is not shown in , because it corresponds to the (110) direction, the formerly calculated mode is inserted in EquationEquation (1)
(1)
(1) . The results for cV are displayed in together with experimental results of Ref. [Citation49].
Figure 4. The specific heat cV of STO as a function of temperature in comparison to experimental data (red open circles). The inset shows the derivative with respect to temperature of cV as a function of temperature again in comparison with the experimental data (red open circles).
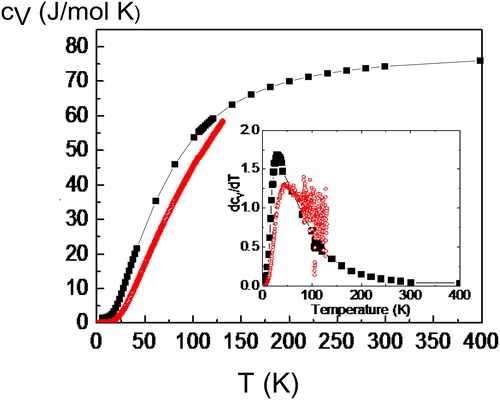
Around TS a rather tiny anomaly is observed which is more apparent in the derivative of cV with respect to T (inset to ). This is in agreement with various measurements of cV in STO [Citation11, Citation50–53].
Now all ingredients are obtained to calculate the TC of STO. This is a simple task as only the product of the above derived quantities has to be formed for each temperature corresponding to the Peierls–Boltzmann transport theory:
(2)
(2)
Note that the contribution from the optic mode is neglected since vTO is much smaller than vTA (see ) as has also been observed in other systems [Citation54]. This does, however, not imply that the optic phonons are unimportant, but just the opposite, namely they represent the dominant scattering channel for the heat-carrying acoustic phonons. Omitting these [Citation55–57] would release an enormous increase in the TC. The result for the TC is shown in .
Figure 5. TC as a function of temperature for STO shown on a double logarithmic scale. The experimental data of Ref. [Citation12] of STO are represented by the black squares. The theoretically obtained results are given by the red squares.
![Figure 5. TC as a function of temperature for STO shown on a double logarithmic scale. The experimental data of Ref. [Citation12] of STO are represented by the black squares. The theoretically obtained results are given by the red squares.](/cms/asset/deb6e552-2134-4a25-9f2b-3bac82db73f3/gfer_a_1683492_f0005_c.jpg)
A comparison with experimental data [Citation11,Citation12] shows an overall good agreement, even though some experimentally observed fine details are not reproduced, especially for T > 200 K where probably further phonon branches need to be taken into account. However, in view the simplicity of this parameter free approach based on the self-consistent phonon theory the overall agreement clearly suggests that anharmonic effects in terms of phonon–phonon interactions which provide the phonon mean free path, are the basic ingredient to understand the TC of STO and related compounds. It is important to note that the mean free path changes from the order of lattice constants at high temperature to diverging at low temperature and thus provides a natural crossover from kinetic to ballistic transport regimes. The observation of a Poiseuille flow appearing above the Casimir region [Citation12] is attributed to the enhanced quantum fluctuation effects of STO which appear just in this temperature window.
Since the key ingredient of the above theory is the phonon mean free path as deduced from the phonon–phonon scattering momentum (inset to ), a similar analysis can be performed for doped STO where strong deviations in κ as compared to the undoped system have been reported [Citation12]. The temperature dependent exponential decay of lph is given by:
(2)
(2)
where l0 is of the order of some lattice constants, A is a material constant which depends on doping and decreases systematically with increasing doping, implying that the exponential gets less important, and Tx is a characteristic temperature which defines the maximum in κ. This temperature scale is plotted as a function of doping in where obviously an almost linear increase with increasing doping takes place. Experimentally a systematic investigation has not been carried out, however, from the data in Ref. [Citation12] it is clearly observed that indeed the maximum in κ moves to higher temperature with increasing doping.
Figure 6. The characteristic temperature scale Tx as a function of doping.
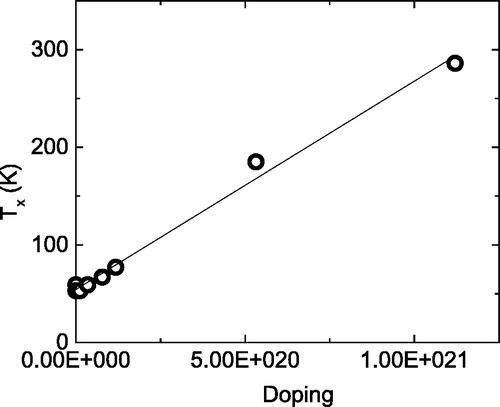
Simultaneously, the double-well potential of the respective compound gets shallower and narrower to be pseudo-harmonic for large doping. Details will be presented elsewhere [Citation58].
In conclusion, a simple derivation of the TC of an anharmonic crystal has been proposed where nonlinear phonon–phonon interaction is the most important ingredient. The critical momentum at which the interaction is strongest is strongly temperature dependent and governed by higher order electron–phonon coupling. Simultaneously, it defines the phonon mean free path and thereby the temperature evolution of κ. The overall good agreement with experimental data approves this rather elementary scheme in calculating the TC and should be applicable to similar compounds with significant phonon softening, as, e.g., PbTe and KTaO3 which are, however, experimentally much less investigated as compared to STO such that the important input data, as outlined above, are not available at present.
Acknowledgements
It is a pleasure to acknowledge valuable discussions with H. Keller.
References
- J. Callaway, Model for lattice thermal conductivity at low temperatures, Phys. Rev. 113 (4), 1046 (1959). DOI: 10.1103/PhysRev.113.1046.
- R. A. Guyer, and J. A. Krumhansl, Thermal conductivity, second sound, and phonon hydrodynamic phenomena in nonmetallic crystals, Phys. Rev. 148 (2), 778 (1966). DOI: 10.1103/PhysRev.148.778.
- R. A. Guyer, and J. A. Krumhansl, Solution of the linearized phonon Boltzmann equation, Phys. Rev. 148 (2), 766 (1966). DOI: 10.1103/PhysRev.148.766.
- M. Tachibana, T. Kolodiazhnyi, and E. Takayama-Muromachi, Thermal conductivity of perovskite ferroelectrics, Appl. Phys. Lett. 93 (9), 092902 (2008). DOI: 10.1063/1.2978072.
- A. J. H. Mante, and J. Volger, Phonon transport in barium titanate, Phys. Lett. 24A, 139 (1967). DOI: 10.1016/0031-8914(71)90164-9.
- B. Salce, J. L. Gravil, and L. A. Boatner, Disorder and thermal transport in undoped KTaO3, J. Phys. Condens. Matter 6, 4077 (1994). DOI: 10.1088/0953-8984/6/22/007.
- H. H. Barrett, and M. G. Holland, Thermal conductivity in perovskites, Phys. Rev. B. 2 (8), 3441 (1970). DOI: 10.1103/PhysRevB.2.3441.
- W. H. Huber, L. M. Hernandez, and A. M. Goldman, Electric field dependence of the thermal conductivity of quantum paraelectrics, Phys. Rev. B. 62 (13), 8588 (2000). DOI: 10.1103/PhysRevB.62.8588.
- D. A. Ackerman et al., Glassy behavior of crystalline solids at low temperatures, Phys. Rev. B. 23 (8), 3886 (1981). DOI: 10.1103/PhysRevB.23.3886.
- J. J. De Yoreo, R. O. Pohl, and G. Burns, Low-temperature thermal properties of ferroelectrics, Phys. Rev. B. 32 (9), 5780 (1985).
- E. F. Steigmeier, Field effect on the Cochran modes in SrTiO3 and KTaO3, Phys. Rev. 168 (2), 523 (1968). DOI: 10.1103/PhysRev.168.523.
- V. Martelli et al., Thermal transport and phonon hydrodynamics in strontium titanate, Phys. Rev. Lett. 120 (12), 125901 (2018).
- S. R. Popuri et al., Glass-like thermal conductivity in SrTiO3 thermoelectrics induced by A-site vacancies, Soc. Chem. Adv. 4, 3370 (2014).
- A. Smontara, J. C. Lasjaunias, and R. Maynard, Phonon Poiseuille flow in quasi-one-dimensional single crystals, Phys. Rev. Lett. 77 (27), 5397 (1996). DOI: 10.1103/PhysRevLett.77.5397.
- R. A. Cowley, Lattice dynamics and phase transitions of strontium titanate, Phys. Rev. 134 (4A), A981 (1964).
- G. Shirane, and Y. Yamada, Lattice-dynamical study of the 110°K phase transition in SrTiO3, Phys. Rev. 177 (2), 858 (1969). DOI: 10.1103/PhysRev.177.858.
- H. Vogt, Refined treatment of the model of linearly coupled anharmonic oscillators and its application to the temperature dependence of the zone-center soft-mode frequencies of KTaO3 and SrTiO3, Phys. Rev., B Condens. Matter 51 (13), 8046 (1995). DOI: 10.1103/physrevb.51.8046.
- K. A. Müller, and H. Burkard, SrTiO3: an intrinsic quantum paraelectric below 4 K, Phys. Rev. B. 19 (7), 3593 (1979). DOI: 10.1103/PhysRevB.19.3593.
- Y. Yamada, and G. Shirane, Neutron scattering and nature of the soft optical phonon in SrTiO 3, J. Phys. Soc. Jpn. 26 (2), 396 (1969). DOI: 10.1143/JPSJ.26.396.
- P. A. Fleury, J. F. Scott, and J. M. Worlock, Soft phonon modes and the 110°K phase transition in SrTiO3, Phys. Rev. Lett. 21 (1), 16 (1968). DOI: 10.1103/PhysRevLett.21.16.
- T. Riste et al., Critical behaviour of SrTiO3 near the 105°K phase transition, Solid State Comm. 9 (17), 1455 (1971).
- K. A. Müller, and W. Berlinger, Static critical exponents at structural phase transitions, Phys. Rev. Lett. 26 (1), 13 (1971). DOI: 10.1103/PhysRevLett.26.13.
- M. Itoh et al., Ferroelectricity induced by oxygen isotope exchange in strontium titanate perovskite, Phys. Rev. Lett. 82 (17), 3540 (1999). DOI: 10.1103/PhysRevLett.82.3540.
- A. Bussmann-Holder, H. Büttner, and A. R. Bishop, Stabilization of ferroelectricity in quantum paraelectrics by isotopic substitution, J. Phys. Condens. Matter 12, L115 (2000). DOI: 10.1088/0953-8984/12/6/108.
- J. G. Bednorz, and K. A. Müller, Sr1−xCaxTiO3: an XY Quantum Ferroelectric with Transition to Randomness, Phys. Rev. Lett. 52 (25), 2289 (1984). DOI: 10.1103/PhysRevLett.52.2289.
- L. Zhang et al., The cell volume effect in barium strontium titanate, Solid State Comm. 104 (5), 263 (1997). DOI: 10.1016/S0038-1098(97)00289-5.
- D. Bäuerle et al., Soft modes in semiconducting SrTiO3: II. The ferroelectric mode, Z. Phys. B. Condens. Matter 38, 335 (1980). DOI: 10.1007/BF01315325.
- A. Bussmann-Holder et al., A polarizability model for the ferroelectric mode in semiconducting SrTiO3, Z Phys. B. Condens. Matter 41 (4), 353 (1981). DOI: 10.1007/BF01307326.
- X. Lin et al., Metallicity without quasi-particles in room-temperature strontium titanate, NPJ Quantum Mater. 2 (1), 1 (2017).
- J. F. Schooley, W. R. Hosler, and M. L. Cohen, Superconductivity in semiconducting SrTiO3, Phys. Rev. Lett. 12 (17), 474 (1964). DOI: 10.1103/PhysRevLett.12.474.
- C. Collignon et al., Superfluid density and carrier concentration across a superconducting dome: the case of strontium titanate, Phys. Rev. B. 96 (22), 224506 (2017).
- G. Binnig et al., Two-band superconductivity in Nb-doped SrTiO3, Phys. Rev. Lett. 45 (16), 1352 (1980). DOI: 10.1103/PhysRevLett.45.1352.
- X. Lin et al., S-wave superconductivity in optimally doped SrTi1−xNbxO3 unveiled by electron irradiation, Phys. Rev. B. 92 (17), 174504 (2015).
- R. Migoni, H. Bilz, and D. Bäuerle, Origin of Raman scattering and ferroelectricity in oxidic perovskites, Phys. Rev. Lett. 37 (17), 1155 (1976). DOI: 10.1103/PhysRevLett.37.1155.
- H. Bilz, G. Benedek, and A. Bussmann-Holder, Theory of ferroelectricity: the polarizability model, Phys. Rev. B Condens. Matter 35 (10), 4840 (1987). DOI: 10.1103/physrevb.35.4840.
- A. Bussmann-Holder, The polarizability model for ferroelectricity in perovskite oxides, J. Phys. Condens. Matter 24 (27), 273202 (2012). DOI: 10.1088/0953-8984/24/27/273202.
- A. Bussmann-Holder, H. Büttner, and A. Bishop, Polar-soft-mode-driven structural phase transition in SrTiO3, Phys. Rev. Lett. 99 (16), 167603 (2007).
- A. Bussmann-Holder, Interplay of polarizability and ionicity in IV-VI compounds, Phys. Rev. B Condens. Matter 40 (17), 11639 (1989). DOI: 10.1103/physrevb.40.11639.
- A. Bussmann-Holder, K. Roleder, and J.-H. Ko, What makes the difference in perovskite titanates?, J. Phys. Chem. Solids. 117, 148 (2018). DOI: 10.1016/j.jpcs.2018.02.025.
- G. Shirane, and E. Sawaguchi, On the anomalous specific heat of lead titanate, Phys. Rev. 81 (3), 458 (1951). DOI: 10.1103/PhysRev.81.458.2.
- G. Shirane et al., Soft ferroelectric modes in lead titanate, Phys. Rev. B. 2, 155 (1970). DOI: 10.1103/PhysRevB.2.155.
- J. Harada, J. D. Axe, and G. Shirane, Neutron-scattering study of soft modes in cubic BaTiO3, Phys. Rev. B. 4 (1), 155 (1971). DOI: 10.1103/PhysRevB.4.155.
- E. Courtens et al., New excitations in quantum paraelectrics, Phys. B Condens. Matter 219-220, 577 (1996). doi:10.1016/0921-4526(95)00817-9.
- A. Bussmann-Holder, Electron-phonon-interaction-driven anharmonic mode-mode coupling in ferroelectrics: the origin of acoustic-mode anomalies, Phys. Rev. B. 56 (17), 10762 (1997). DOI: 10.1103/PhysRevB.56.10762.
- J. L. Servoin et al., ed. Devrees, J., Recent developments in condensed matter physics. In Low-Dimensional Systems, Phase Changes and Experimental Techniques (Plenum Press, New York, 1982), Vol. 4, p. 157.
- A. Bussmann -Holder, K. Roleder, and J.-H. Ko, Instabilities in the ferro- and antiferroelectric lead perovskites driven by transition metal ion mass: from PbTiO3 via PbZrO3 to PbHfO3, J. Phys. Condens. Matter 26 (27), 275402 (2014). DOI: 10.1088/0953-8984/26/27/275402.
- J.-H. Ko et al., Mode softening, precursor phenomena, and intermediate phases in PbZrO3, Phys. Rev. B. 87 (18), 184110 (2013).
- M. Stachiotti et al., Crossover from a displacive to an order-disorder transition in the nonlinear-polarizability model, Phys. Rev. B Condens. Matter 47 (5), 2473 (1993). DOI: 10.1103/physrevb.47.2473.
- J. Petzelt et al., Dielectric, infrared, and Raman response of undoped SrTiO3 ceramics: evidence of polar grain boundaries, Phys. Rev. B. 64 (18), 184111 (2001).
- J. L. Servoin, Y. Luspin, and F. Gervais, Infrared dispersion in SrTiO3 at high temperature, Phys. Rev. B. 22 (11), 5501 (1980). DOI: 10.1103/PhysRevB.22.5501.
- G. Lang et al., Anharmonic line shift and linewidth of the Raman mode in covalent semiconductors, Phys. Rev. B. 59 (9), 6182 (1999). DOI: 10.1103/PhysRevB.59.6182.
- A. Bussmann-Holder et al., Relation between structural instabilities in EuTiO3 and SrTiO3, Phys. Rev. B. 83 (21), 212102 (2011).
- A. Debernardi, S. Baroni, and E. Molinari, Anharmonic phonon lifetimes in semiconductors from density-functional perturbation theory, Phys. Rev. Lett. 75 (9), 1819 (1995). DOI: 10.1103/PhysRevLett.75.1819.
- D. A. Broido et al., Intrinsic lattice thermal conductivity of semiconductors from first principles, Appl. Phys. Lett. 91 (23), 231922 (2007). DOI: 10.1063/1.2822891.
- M. Omini, and A. Sparavigna, Beyond the isotropic-model approximation in the theory of thermal conductivity, Phys. Rev. B. 53 (14), 9064 (1996).
- M. Omini, and A. Sparavigna, Heat transport in dielectric solids with diamond structure, Nuovo Cimento D. 19, 1537 (1997).
- D. A. Broido, A. Ward, and N. Mingo, Lattice thermal conductivity of silicon from empirical interatomic potentials, Phys. Rev. B. 72 (1), 014308 (2005).
- A. Bussmann-Holder, to be published.