
ABSTRACT
Chromitite petrogenesis in layered intrusions is important because some chromitites host economic Ni-Cu-platinum group element mineralization. Cryptic layering, which could be useful to reconstruct the chromitite origin, has been documented for some chromitites. Here, we document cm-scale stratigraphic profiles of the major and trace element contents in chromite across two chromitite seams from the Bushveld Igneous Complex. One set is from a massive UG-2 seam from the western limb, the other from a chromitite seam in the Turfspruit area of the northern limb, considered stratigraphically equivalent to the UG-2 (henceforth the ‘UG-2 equivalent’ or ‘UG-2E’). Stratigraphic profiles across the massive UG-2 only show a gradual increase in V contents (from bottom to top) and subtle variations in Mg#, Cr#, Mn, Zn, Co, Ti, and Ga contents. In contrast, the UG-2E profiles show significant variations in Mg# but not in Cr#, and distinct shifts in Mn, Zn, Co, Ni, Ti, and Ga contents and Fe3+/∑Fe values. These shifts correlate in part with variations in chromite abundance but also occur in sections as massive as the UG-2 reference. We argue that, in general, the presence of cryptic layering is more consistent with chromitite formation via gravitational settling or in situ crystallization rather than via slurries.
1. Introduction
Chromite mineral chemistry can yield useful information on the processes involved in the formation of chromitite seams, such as those occurring in mafic-ultramafic layered intrusions (e.g. Roeder and Reynolds Citation1991). There are several reasons for this: (1) chromite is an early cumulus phase (Roeder and Reynolds Citation1991; Barnes and Roeder Citation2001), (2) it has a relatively high closure temperature (~700°C; Van Orman and Crispin Citation2010), and (3) it is relatively resistant to alterations compared to associated silicate minerals (Barnes Citation2000). Thus, chromite chemistry commonly preserves information about crystallization conditions (Irvine Citation1965, Citation1966; Dick and Bullen Citation1984; Barnes Citation1986; Roeder and Reynolds Citation1991; Barnes and Roeder Citation2001; Voigt and von der Handt Citation2011) and the processes involved in chromitite seam formation (e.g. Irvine Citation1967; Eales and Reynolds Citation1986; Barnes and Roeder Citation2001; Mathez and Mey Citation2005; Junge et al. Citation2014). Better constraints on the mechanisms involved in the formation of chromitite seams could also help understand the processes leading to the formation of significant platinum-group element (PGE)-Ni-Cu mineralization in some chromitite seams, as in the UG-2 horizon in the Bushveld Igneous Complex (BIC), which together with the Merensky Reef, contains the world’s largest PGE reserves (U.S. Geological Survey (USGS) Citation2022).
Despite the potential of chromite chemistry to yield useful information on the history and origin of chromitite seams and associated PGE mineralization, the mechanisms of chromitite seam formation are still widely debated. Several models have been proposed, but testable hypotheses to evaluate among them are scarce. The two main models are as follows: (1) gravitational settling of chromite that crystallized within a magma chamber (e.g. Irvine Citation1975; Cameron Citation1977; Naldrett et al. Citation2012), and (2) emplacement of crystal-rich slurries into the main magma chamber, from which distinct chromite layers originate by hydrodynamic sorting (e.g. Maier et al. Citation2013; Forien et al. Citation2015). These two models were reviewed in detail by Latypov et al. (Citation2017) who concluded that neither could explain the existence of chromitite draping overhanging walls in some erosional structures (potholes and anti-potholes) caused by thermo-mechanical erosion of the magma chamber floor. Instead, Latypov et al. (Citation2017) proposed a third mechanism, in which chromite seams grow via in situ crystallization of chromite in crystallization fronts that develop from the contact upwards and outwards on cumulate piles.
Overhanging chromitite margins (Latypov et al. Citation2017) or xenocrystic textures (Lesher et al. Citation2019) appear to be the only effective features to distinguish between in situ crystallization and gravitational settling. Hydrodynamic sorting of slurries should always result in a layer of silicate minerals overlying or in between the chromitite seams (i.e. successive slurries would not produce a continuous chromitite seam). Another problem is related to the volume of magma required to form thick chromitite seams (see e.g. Campbell and Murck Citation1993; Eales Citation2000) or the conditions that would favour crystallization of only chromite without a cotectic silicate mineral (see review by Latypov et al. Citation2018). Additional complications arise from documented variations in chromite chemistry. For example, Junge et al. (Citation2014) interpreted the stratigraphic variations in chromite chemistry (Mg#, Cr#, TiO2) in the UG-2 to represent cryptic layering that defines at least 10 distinct sublayers, rather than a single seam.
The goal of this contribution is to establish whether chromite chemistry, expanded to incorporate trace elements and Fe3+/∑Fe, could be used to further evaluate the mechanisms leading to the formation of chromitite layers. To achieve this goal, we used the chromite chemistry from a reference UG-2 chromitite (Waterval, western limb) that was previously studied by Naldrett et al. (Citation2012) and Langa et al. (Citation2021a, Citation2021b), as well as a suite of the UG-2 equivalent (UG-2E) chromitite from the northern limb (Turfspruit area), also previously documented in Langa et al. (Citation2021a Citation2021b). Langa et al. (Citation2021a) compared the major and minor element chemistry of chromite in the UG-2E and the UG-2 at 3–4 cm intervals, and this study documents the trace element (V-Mn-Ga-Ti-Co-Ni-Zn-Ge) chemistry of chromite through the same two chromitite seams measured by laser ablation inductively coupled mass spectrometry (LA-ICP-MS) at 3–4 cm intervals. To our knowledge, this is the first study that uses trace elements combined with major element chemistry (Mg# and Cr#) to evaluate the existence of cryptic variations in chromitite seams and evaluate possible mechanisms of chromitite formation. Furthermore, in the case of the UG-2E, some trace elements could be useful in evaluating the effects of contamination by assimilation of local host rocks. This contribution also corrects some inconsistencies in the chromite modal abundances summarized in Langa et al. (Citation2021a).
2. UG-2 chromitite: geological and geochemical background
This section emphasizes only the main aspects related to the UG-2 chromitite in the eastern and western limbs and the interpreted stratigraphic equivalent in the northern limb, the UG-2E chromitite. The general geology of the BIC and the related PGE-Ni-Cu-mineralized reefs are reviewed by Maier et al. (Citation2013). The igneous stratigraphy in the Flatreef area of the northern limb, including stratigraphic correlation with the Upper Critical Zone (UCZ) of the eastern and western limb, was reconstructed by Grobler et al. (Citation2019).
2.1. UG-2 chromitite in the eastern and western limbs
Chromitite seams within the UCZ of the Rustenburg Layered Suite (RLS) in the BIC can be separated, from bottom to top, into three groups: Lower Group (LG), Middle Group (MG), and Upper Group (UG) chromitites (Cousins and Feringa Citation1964; Gain Citation1985). The Upper Group 2 (UG-2) chromitite is the uppermost chromitite layer in the UCZ, except in sections of the eastern limb, where an overlying UG-3 is present (McLaren and De Villiers Citation1982; Manoochehri et al. Citation2015; Viljoen Citation2016). The UG-2 occurs approximately 15–400 m below the Merensky Reef (Lee Citation1996; Barnes and Maier Citation2002; Hutchinson et al. Citation2015; Sehoole et al. Citation2020) and is economically important because it is the most PGE-endowed chromitite layer in the BIC, with grades ranging from 4 to 10 ppm Σ[PGE + Au] (e.g. McLaren and De Villiers Citation1982; Lee Citation1996; Hey Citation1999; Junge et al. Citation2014; Citation2019). The thickness of the UG-2 varies from 0.15 to 2.55 m (McLaren and De Villiers Citation1982; Mathez and Mey Citation2005; Kotzé and Gauert Citation2020) and is remarkably similar along its entire strike length of approximately 280 km in the western and eastern limbs of the BIC (Viljoen Citation2016).
A significant amount of work on chromite compositions in the eastern and western limbs of the BIC is available (e.g. see compilation in Langa et al. Citation2021a). Some results have shown cm-scale systematic variations in major and minor element chemistry from the base to the top of chromitite seams, especially in the UG-2 (e.g. Eales and Reynolds Citation1986; Teigler and Eales Citation1993; Mathez and Mey Citation2005; Naldrett et al. Citation2012; Junge et al. Citation2014; Citation2019). These cryptic variations are not unique to the UG-2 and have also been shown in the LG-6 chromitite at the Rustenburg Platinum Mines, northwest of the BIC (Teigler Citation1999). In general, the existence of cryptic layering is poorly known elsewhere because other significant chromitite seams in the Lower Group (LG) and Middle Group (MG) have not been studied to the same level of detail as the UG-2.
Several interpretations for the variations in chromite chemistry have been proposed. For example, Eales and Reynolds (Citation1986) showed that Cr/Al values in chromite increase from the base to the top of the main UG-2 chromitite seam in the northwestern BIC (Union Section Mine) and interpreted the increase to be the result of the onset of plagioclase crystallization (as plagioclase incorporates Al but not Cr). Mathez and Mey (Citation2005) also documented cryptic variations in Mg#, Cr, Ti, and Ni from the base to the top of the UG-2 chromitite seam in the northeastern BIC (Middelpunt Mine) and attributed the variations to re-equilibration of chromite with surrounding silicate melt (i.e. ‘trapped liquid shift’ of Barnes Citation1986, summarized in section 2.4 below). Naldrett et al. (Citation2012) showed a progressive upward increase in V through the UG-2 chromitite seam in the western limb (Waterval) and interpreted it to represent changing partition coefficients of V between chromite and melt during in situ crystallization of chromite. Junge et al. (Citation2014) showed that the mineral chemistry of UG-2 chromite through a chromitite seam in the western BIC (Karee Mine) is characterized by multiple cycles of upward decreases in Mg# combined with increases in Cr# and TiO2. They interpreted these shifts as cryptic variations, representing separate chromitite sublayers that formed sequentially and merged to form what appears as a single massive chromitite seam. In contrast, Veksler et al. (Citation2018) noted no variations in chromite Mg# and Cr# within two different UG-2 chromitite sections in the eastern and western limbs (Nkwe and Khuseleka mines). Instead, they noted that any observed variations in chromite chemistry were correlated to changes in chromite modal proportions and interpreted the variations to be due mostly to re-equilibration with different proportions of silicate melt (trapped liquid shift).
The existence of cryptic layering implies no physical disturbance of the layering post-chromitite formation and would be considered evidence of either gravitational settling or in-situ crystallization (in both cases, the earliest layer is at the bottom). In contrast, cryptic layering would be inconsistent with hydrodynamic sorting of cumulate slurries, because this process would randomize any variations in chromite chemistry and leave evidence as physical features such as the spatial distributions of oxide, sulphide, and silicate phases within the chromitite seam (Maier et al. Citation2013, Citation2021a, b; Forien et al. Citation2015).
2.2. UG-2E chromitite in the northern limb and effects of crustal contamination in the platreef
Merensky Reef and UG-2 reef equivalents (UG-2E) have been documented in the Rooiport and Grasvally areas of the northern limb, south of the Ysterberg-Planknek Fault and near the Zebediela Fault (Van der Merwe Citation2008) and in drill core in the deeper sections of the Flatreef project, Turfspruit area (e.g. Nodder Citation2015; Grobler et al. Citation2019; Langa et al. Citation2021a, b). This chromitite seam averages 1 m in thickness and typically has mm- to cm-thick overlying ‘leader’ chromitite stringers (Grobler et al. Citation2019). The underlying lithology tends to be a pegmatoidal pyroxenite or harzburgite. Evidence that magmas in the Turfspruit areas intruded into Transvaal Supergroup meta-sedimentary rocks is seen in drill core as rafts and xenoliths of country rocks that have been metamorphosed to hornfels and calc-silicates (Yudovskaya and Kinnaird Citation2010; Grobler et al. Citation2019; Keir-Sage et al. Citation2021). This magma-country rock interaction is a common feature and used to define the Platreef through most of the northern limb (e.g. Barton et al. Citation1986; Kinnaird Citation2005). In addition, compared to the other limbs of the BIC, most sections of the Platreef are enriched in Zr, Rb, K, and Ca, considered to be the result of contamination by local meta-sedimentary rocks (Grobler et al. Citation2019; Keir-Sage et al. Citation2021). Langa et al. (Citation2021a) showed that the chromite in the most massive UG-2E chromitite sections is compositionally identical to the UG-2, consistent with the stratigraphic correlation proposed by Grobler et al. (Citation2019), whereas the chromite in the less-massive sections was depleted in Mg# (Mg# < 0.4) and Cr# (Cr# < 0.6) compared to the UG-2. Langa et al. (Citation2021a) suggested that crustal contamination was the main cause of the discrepancies in the less-massive sections of the UG-2E. What remains to be documented, and the purpose of this study, is whether sections of the sampled UG-2E exhibit any cryptic layering.
2.3. Chromitite seam formation
Several mechanisms have been proposed for the petrogenesis of chromitite seams in the Bushveld Complex and other systems (e.g. Stillwater), including (1) crystallization of chromite within the magma chamber and accumulation via gravitational settling (e.g. Irvine Citation1975; Cameron Citation1977; Naldrett et al. Citation2012), (2) crystallization of chromite in situ along the temporary floor of the magma chamber (e.g. Campbell and Murck Citation1993; Latypov et al. Citation2013, Citation2015, Citation2017, Citation2020), (3) deposition of chromite from slurries (e.g. Maier et al. Citation2013, Citation2021a, b; Forien et al. Citation2015; Vukmanovic et al. Citation2019), and (4) injection of chromite-rich slurries to form sills (e.g. Voordouw et al. Citation2009; Mungall et al. Citation2016).
Chromite begins crystallizing relatively early in the crystallization sequence (Irvine Citation1967), but typically crystallizes simultaneously with olivine ± orthopyroxene ± clinopyroxene ± plagioclase (Irvine Citation1966, Citation1967). Most models of chromitite formation require mechanisms that favour crystallization of only chromite, which could result fromfor example, (1) mixing between primitive and differentiated magmas in the magma chamber (e.g. Irvine Citation1977; Sharpe and Irvine Citation1983), (2) increase (e.g. Cameron Citation1977; Lipin Citation1993; Cawthorn Citation2005) or decrease (Latypov et al. Citation2018) in pressure, (3) increase in fO2 (e.g. Cameron and Desborough Citation1969; Ulmer Citation1969), (4) contamination of a new magma pulse by felsic material inside the magma chamber (e.g. Irvine Citation1975; Alapieti et al. Citation1989; Kinnaird et al. Citation2002), and (5) volatile fluxing (e.g. Nicholson and Mathez Citation1991). All these models work in principle, but because of the low solubility of Cr in most magmas all require much larger volumes of melt than can be inferred to have existed at the time of chromite formation (e.g. Campbell and Murck Citation1993; Mondal and Mathez Citation2007; Hutchinson et al. Citation2015; Latypov et al. Citation2018). Some authors (e.g. Latypov et al. Citation2018; Friedrich et al. Citation2020) have argued that some of these processes are not mutually exclusive and could operate in concert. For example, Latypov et al. (Citation2018) suggested that mafic melts close to a chromite topological trough in the Mg2SiO4–CaAl2Si2O8–SiO2–MgCr2O4 quaternary system could become saturated in chromite as a result of pressure reduction upon their ascent into crustal-level magma chambers. These periodically replenished chromite-saturated melts could enter the magma chamber forming massive chromitite layers.
2.4. Trapped liquid shift
Barnes (Citation1986) showed that the compositions of cumulus minerals may change as they interact with intercumulus silicate melts. The magnitude of the shift in composition is a function of (1) the relative proportions of intercumulus liquid and cumulus minerals (greater for larger amounts of intercumulus liquid), (2) the compositions of the cumulus minerals and mineral/melt partition coefficients, (3) the degree to which the system is open or closed to exchange with surrounding intercumulus liquid or magma, (4) diffusion rates (higher for divalent elements than trivalent elements in oxides; see also review by Van Orman and Crispin Citation2010), and (5) time available for exchange and diffusion (generally long in the case of relatively small crystals in slowly cooled large layered intrusions; see also Barnes and Robertson Citation2019).
In the case of chromite, Mg# and Cr# are expected to decrease because chromite would re-equilibrate with residual intercumulus melts with lower Mg# and Cr#, producing a trend similar to that observed during the crystallization of orthopyroxene (‘Trend B’ in Naldrett et al. Citation2012). However, if plagioclase is present, it may modify or buffer Al contents, producing a trend similar to that observed during crystallization of orthopyroxene ± plagioclase (‘Trend A’ in Naldrett et al. Citation2012; see also Roeder and Reynolds Citation1991).
3. Samples and analytical methods
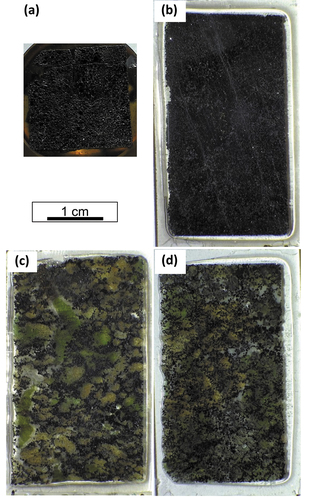
The samples and analytical methods are described in more detail in Langa et al. (Citation2021a) and only a short summary is presented here. Two sets of samples from the BIC () were used: (1) a reference UG-2 chromitite from the western limb of the BIC and (2) a sample of the UG-2E from the northern limb. shows the simplified stratigraphic profiles of the studied drill core sections. The UG-2 reference suite () was extracted from a 60 cm-thick chromitite layer, mostly massive (), sampled at 3 cm intervals, and mounted in epoxy (for a total of 19 samples). A thin parting towards the top of the UG-2 chromitite, containing only ~1 vol. % chromite was excluded. The UG-2E chromitite suite () was extracted from a 189 cm-thick chromitite layer, sampled at 1–4 cm intervals (for a total of 49 polished sections). In contrast to the UG-2 reference suite, the UG-2E chromitite samples () range from massive to semi-massive and include local disseminations, stringers, and patches.
Figure 1. Geological map of the Rustenburg Layered Suite of the Bushveld Igneous Complex (after Maier et al. Citation2021b) showing sample locations of the UG-2 reference and UG-2E samples used in this study (black squares).
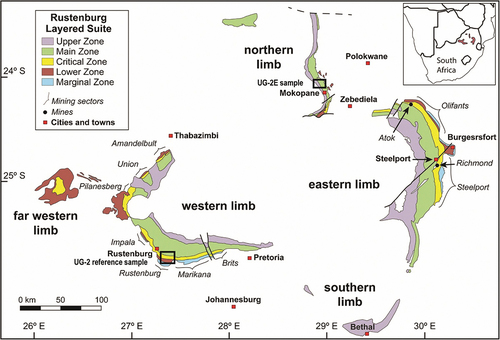
Figure 2. Simplified stratigraphic profiles of the studied drill core sections. (a) UG-2 reference. (b) UG-2E. The UG-2E is not as massive as the UG-2 reference.
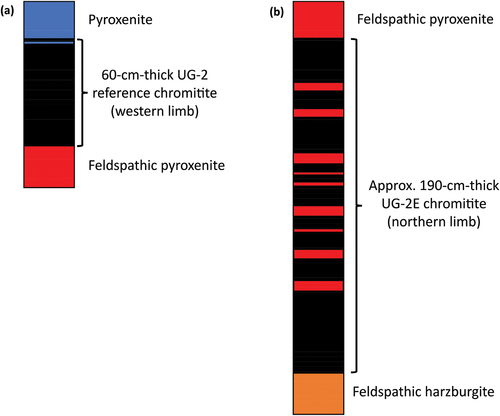
Figure 3. Representative samples of the UG-2 reference chromitite and representative samples of the UG-2E chromitite showing its textural variability. (a) Sample of the massive UG-2 reference mounted in epoxy puck (middle of chromitite). (b) Sample of the massive UG-2E (towards bottom of chromitite). (c) Sample of the patchy UG-2E (middle of chromitite). (d) Sample of the disseminated UG-2E (middle of chromitite). UG-2E samples made into 100-micron-thick thin sections.
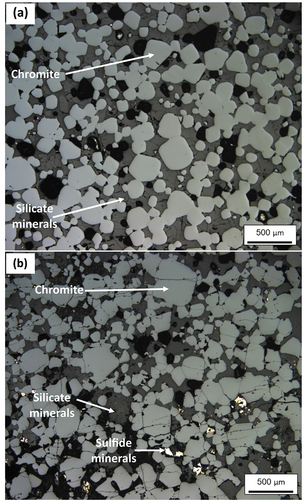
Petrography was performed using reflected light microscopy. shows photomicrographs representative of the massive UG-2 reference and UG-2E chromitites. Chromite modal proportions (per standard thin section) were estimated using ImageJ v1.51i (an image processing software developed by the U.S. National Institutes of Health). High magnification images, representative of the samples, were used for chromite modal abundance estimation using ImageJ. This allowed for significantly better resolution between the chromite grains and the interstitial material, resulting in good chromite modal estimation.
Figure 4. Reflected light photomicrographs (reflected light) of representative chromitite samples from the massive section of the UG-2E and the UG-2 reference suite (modified after Langa et al. Citation2021a). (a) Example of the massive UG-2 reference chromitite, in which chromite grains are mostly subhedral (light grey), and range in size from 0.01 to 0.25 mm. Chromite grains occupy approximately 64% of the section, interstitial silicate minerals 36% (dark grey matrix minerals), and tiny speckles of sulphide (bright anhedral minerals in matrix) only ~ 0.5%. (b) Massive portion of UG-2E chromitite in thin section showing clustering of euhedral to subhedral chromite grains, ranging in size from 0.04 to 0.7 mm wide. Chromite (light grey areas) occupies approximately 60% of the section, whereas silicate minerals occupy approximately 39% of the section and sulphides occupy ~ 1% of the section. Black areas are mostly holes outlining chromite gains plucked out during polishing (accounted for as part of the chromite mode).
Chromite major and minor element contents were obtained by wavelength-dispersive electron probe microanalysis (WD-EPMA) at the Ontario Geological Survey Geoscience Laboratories (GeoLabs) and the Department of Earth Sciences at the University of Toronto, using Cameca SX100 and JEOL JXA-8230 instruments, respectively. Chromite trace element contents were determined by LA-ICP-MS at the Harquail School of Earth Sciences using a Resonetics Resolution M50 excimer 193 nm laser coupled to a Thermo X-SeriesII quadrupole ICP-MS. To calibrate the ferric iron (Fe3+) content estimated from EPMA, six selected samples from the UG-2 reference and UG-2E were analysed by Mössbauer spectroscopy at the Swedish Museum of Natural History using a conventional spectrometer system operated in constant acceleration mode.
A large suite of trace elements was analysed by LA-ICP-MS. Two major groups were considered: (1) Zn-Mn-Co-Ni, which are expected to substitute for the main divalent cations (Mg2+ and Fe2+) in the tetrahedral sites of chromite, and (2) V-Ti-Ga-Ge, which are expected to substitute for the main trivalent cations (Al3+, Cr3+, and Fe3+) in the octahedral sites of chromite. Preliminary tests showed that all of these elements were consistently above detection limits and had low analytical uncertainties. The following elements: Y, Zr, Nb, Mo, Cd, Sn, Hf, Ta, W, and Pb, were very close to or below the limits of detection and were, therefore, not included.
The agreement between replicated EPMA analyses of chromite at different facilities was excellent, but there were significant differences in V content. The discrepancy is attributed to differing corrections applied to compensate for the overlap of the TiKβ X-ray peak on VKα (Chatterjee Citation2012; Evans Citation2017). The V contents obtained by LA-ICP-MS (which do not require any special corrections for V) were consistently lower than those obtained by EPMA, indicating that the overlap corrections were unsuccessful. Thus, only the V contents derived from LA-ICP-MS were used and presented here.
4. Results
Major, minor, and trace element mineral data for the UG-2 reference and UG-2E chromite samples are summarized in Langa et al. (Citation2021a) supplementary material (tables 1 to 4). However, here, major and trace element data, for individual UG-2 reference and UG-2E chromite samples, are arranged in stratigraphic order (Table 1, Electronic Supplementary Material #1 – ESM#1). Raw EPMA and LA-ICP-MS data are shown in Tables 2 and 3 (respectively), and Mössbauer spectroscopy results are shown in Table 4.
4.1. Re-evaluation of chromite modal abundance
Careful re-examination of chromite modes in Langa et al. (Citation2021a) showed that they were systematically overestimated. This was mostly a calibration problem arising primarily from the use of images of entire thin sections or epoxy pucks, for which the resolution of the areas containing interstitial silicate minerals was insufficient. For example, using images of entire thin sections or epoxy pucks for area analysis in ImageJ resulted in the incorporation of significant proportions of interstitial areas (silicate and sulphide minerals) into the chromite modal abundance (image bleed outside chromite grain real boundaries).
More accurate chromite modal abundances (Table 1, ESM#1) were estimated again using ImageJ, but with significant modifications to the procedure (detailed in ESM#2). First, sets of higher magnification images, representative of the samples, were used. This step allowed for significantly better spatial resolution between the chromite grains and the interstitial material. Second, parameters such as colour saturation, brightness, and hue were calibrated and adjusted more systematically to prevent ‘bleeding’ of the chromite grain boundaries into the interstitial spaces. Third, the parameters previously mentioned were also adjusted to account for pits caused by loss of chromite grains during polishing.
The results show that chromite modal proportion estimates in Langa et al. (Citation2021a) are inaccurate and systematically higher. The main discrepancy is that the revised chromite modal proportions for massive section of the chromitites range between 60 and 80 vol. % chromite, whereas the initial estimates were consistently >80 vol. %.
4.2. Stratigraphic variations in chromite mineral chemistry
For the UG-2 reference suite, stratigraphic variations in Mg# (), Cr# ( contents () show periodic shifts and reversals with height from the base (at 0 cm) to the top (at 60 cm) of the seam. Mg# ranges 0.40 to 0.44 and Cr# ranges 0.65 to 0.67. The black arrows in the figures show some of the largest shifts. Although there are some antithetical relationships between Mg# and Cr# (e.g. at ca. 45 cm and at ca. 7 cm), other intervals do not display matching shifts in Mg# and Cr# (e.g. at 15 cm). Vanadium contents show some local variations and a systematic increase from the base (as low as 1472 ppm) towards the top of the chromitite seam (up to 2416 ppm), validating the trend documented by Naldrett et al. (Citation2012) using EPMA.
Figure 5. Stratigraphic variations in chromite composition through the UG-2 reference chromitite seam. (a) Variations in Mg#. (b) Variations in Cr#. (c) Variations in V content (LA-ICP-MS data). For reference, the base of the chromitite seam is set at 0 cm and black arrows indicate some of the most relevant shifts in chemistry. Mg# [Mg/(Mg +Fe2+)]; Cr# [Cr# = Cr/(Cr +Al)]. Error bars are 1σ uncertainty.
![Figure 5. Stratigraphic variations in chromite composition through the UG-2 reference chromitite seam. (a) Variations in Mg#. (b) Variations in Cr#. (c) Variations in V content (LA-ICP-MS data). For reference, the base of the chromitite seam is set at 0 cm and black arrows indicate some of the most relevant shifts in chemistry. Mg# [Mg/(Mg +Fe2+)]; Cr# [Cr# = Cr/(Cr +Al)]. Error bars are 1σ uncertainty.](/cms/asset/91ab878a-036d-4614-b554-5687d0fccacf/tigr_a_2169961_f0005_c.jpg)
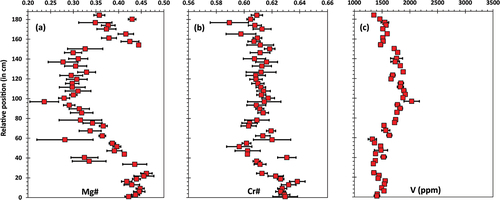
Results for the UG-2E show significantly more variation in Mg# () than the UG-2 reference, with Mg# ranging 0.24 to 0.46 cm, and displaying large uncertainties in some intervals (e.g. at 60 and 80 cm). The middle section of the chromitite (from ca. 33 to 150 cm) has low Mg# (<0.40), in marked contrast to the bottom and top sections. The Mg# in the bottom section (0–35 cm) is consistently >0.40 and roughly in the same range as the reference UG-2 suite. The Mg# in the top section (~150–184 cm) is also distinct from the middle section, but is more heterogeneous than the bottom section, with Mg# down to ~0.35, and slightly larger uncertainties. There are some variations in Cr# (), but not as pronounced as for Mg#. Cr# ranges from 0.59 to 0.64, but in contrast to Mg# only the bottom section (0 cm to 22 cm) is distinct from the rest (i.e. consistently having Cr# > 0.62, whereas the rest of the samples clusters mostly around Cr# = 0.61). In contrast to the UG-2 reference chromitite, the UG-2E shows clear examples of antithetical relationships between Mg# and Cr# (basal section, between 0 cm to 25 cm). The larger uncertainties compared to UG-2 reference data, indicate a larger compositional variability in the UG-2E at the sample scale (~ length of a standard polished section). The variations in V contents () are less pronounced than in the UG-2 reference and display a different profile. Instead of a progressive increase in V content upwards (as recorded in the UG-2 reference), the UG-2E shows higher V content in chromite towards the centre of the chromitite seam (mostly above 1600 ppm and up to 2033 ppm), whereas the top and bottom sections have roughly the same range (1300 to 1600 ppm). The section containing the higher V content roughly coincides with the interval with lower Mg# ().
Figure 6. Stratigraphic variations in chromite composition through the UG-2E chromitite seam. (a) Variations in Mg#. (b) Variations in Cr#. (c) Variations in V content (LA-ICP-MS data). For reference, the base of the chromitite seam is set at 0 cm. Error bars are 1σ uncertainty.
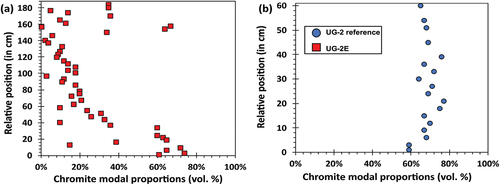
compares the stratigraphic variations in chromite modal abundances between the UG-2E () and the UG-2 (). The UG-2E chromitite seam () ranges from massive to disseminated chromite, with chromite modal proportions varying from <10 vol. % up to 74 vol. %. In contrast, the UG-2 reference () is predominantly massive (≥60% modal chromite, ranging from approx. 60 to 77 vol. % chromite). Only the bottom section of the UG-2E and some samples from the top section have modal chromite proportions comparable to the UG-2 (≥60 vol. %). Chromite modal proportions decrease significantly in the middle section.
Figure 7. Stratigraphic variations in chromite modal proportions. (a) Variations within the UG-2E chromitite. (b) Variations within the UG-2 reference chromitite.
For the UG-2E, between 150 and 154 cm, there is a sudden shift in Mg# from 0.32 to 0.45 (), which corresponds to a change from 34 to 64 vol.% modal chromite (). The small gap corresponds to a silicate parting with no chromite. The gradual decrease in Mg# from ca. 44 to 100 cm () corresponds with a gradual decrease in chromite modal proportions (). There is a decrease in Cr# in the ~19–60 cm interval (), which roughly corresponds to the onset of decreasing chromite modal proportions (); however, there are no significant differences in Cr# above 80 cm, in particular at 150 cm, where the major change in Mg# occurs. For the UG-2, in contrast, there are no significant variations in modal chromite proportions () that could be linked to the small variations in Mg# and Cr# ().
summarizes the main results for the trace element contents in chromite (Mn, Zn, Co, Ni, Ti, Ga, and Ge). The top row of panels () shows the stratigraphic variations in the UG-2 reference, and the bottom row () shows the equivalent stratigraphic variations in the UG-2E. In the UG-2 reference, most of the elements analysed showed no significant variations. The chromite Ga content () is the most significant exception, showing a distinct increase from the base of the chromitite seam to ca. 40 cm. The Ti contents () also increase from the base, but only to 20 cm, remaining relatively constant from 20 to 60 cm. Zinc () shows two pronounced shifts in concentration at 27 and 33 cm, which are matched by very subtle shifts in Mn, Co, Ni, and Ga (most noticeable at 27 cm). Trace element contents for the sample at the base of the UG-2 are generally distinct from those of the overlying samples and may relate to the chromites being in direct contact with the silicate-rich footwall (). Significantly, some of the shifts in Mg# and Cr# (marked with black arrows in ) lack corresponding shifts in trace elements.
Figure 8. Comparison of the stratigraphic variations in some trace element contents in chromite chemistry between the UG-2 reference (top row, blue circles) and the UG-2E (bottom row, red squares). Trace elements shown, from left to right: Mn, Zn, Co, Ni, Ti, Ga, Ge. Error bars are 1σ uncertainty.
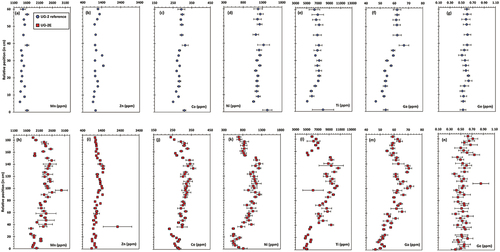
In contrast, trace element contents in chromite in the UG-2E (, bottom row) are more variable and show shifts that match the major shifts in Mg# and Cr# (). Most significant, is the separation into three sections (bottom, middle, and top), established mainly using Mg# (), is complemented by distinct variations in Mn, Co, Ni, and Ti. Gallium () is slightly different, having a more gradational shift from the bottom to the top of the seam. Only Ge () remains relatively constant from the base to the top of the chromitite seam. Zinc () shows mostly small variations, except for the average at ~37 cm, which is anomalously high and with high uncertainties. It is also relevant to compare the ranges of trace element contents between the UG-2 and the UG-2E. The major difference is in the Mn and Ti contents, which are noticeably higher in the UG-2E, although the Ti contents in the massive sections (top and bottom) of the UG-2E are similar to those of the UG-2. In contrast, the Ni content of chromite for the middle section of the UG-2E roughly approaches the UG-2 value, but is significantly lower for the top and bottom sections. The Zn, Ga, and Ge contents in chromite are roughly similar in the UG-2 and the UG-2E.
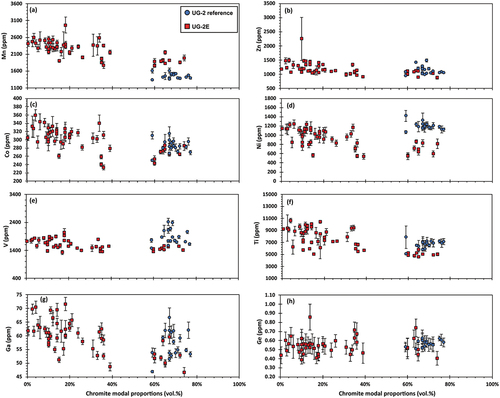
provides a different perspective and compares the chromite content for the seven elements shown in , plus V, as a function of chromite modal proportions. The UG-2 reference chromitite is consistently massive and chromite modal proportions cluster between 60 and 80 vol. %. The massive sections of the UG-2E also cluster between 60 and 80 vol. % chromite, whereas the less massive sections are ≤40 vol. % chromite. There are no particular correlative changes in these elements (i.e. Mn, Zn, Co, Ni, V, Ti, Ga, and Ge) with chromite abundance. It is also relevant to note that none of the samples had estimated chromite proportions in the range ~40 to ~60%.
Figure 9. Variations in minor and trace elements content in chromite in the UG-2E as a function of modal chromite abundance (red squares), compared to the UG-2 reference (blue circles). (a) Mn. (b) Zn. (c) Co. (d) Ni. (e) V. (f) Ti. (g) Ga. (h) Ge. Error bars are 1σ uncertainty.
compares the stratigraphic variations in chromite Fe3+/∑Fe for the UG-2E () and the UG-2 reference (), based on EPMA data calibrated with Mössbauer data for a subset of samples (Table 4). The results are also consistent with the major and trace element data shown previously. The more massive sections of UG-2E (ca. 0–34 cm and ca. 154–184 cm) have different values (lower and near 0.25) than the middle section (up to about 0.28). In contrast, the UG-2 reference suite displays roughly constant values (ca. 0.22) for most of the samples, with a slight increase at the bottom of up to 0.25.
Figure 10. Stratigraphic variations in Fe3+/∑Fe [Fe3+/(Fe2++Fe3+)] of chromite. (a) Within the UG-2E chromitite. (b) Within the UG-2 reference chromitite.
![Figure 10. Stratigraphic variations in Fe3+/∑Fe [Fe3+/(Fe2++Fe3+)] of chromite. (a) Within the UG-2E chromitite. (b) Within the UG-2 reference chromitite.](/cms/asset/37fcc000-a153-405e-9239-91b7534be532/tigr_a_2169961_f0010_c.jpg)
5. Discussion
One of the objectives of this study is to replicate the work of Junge et al. (Citation2014) and determine if cryptic variations in chromite major element content, similar to those documented in their study, are also present in other UG-2 chromitite intersections (such as the reference suite in this study). The intent is to help establish the extent to which such cryptic variations are reproducible, the first step towards attributing cryptic variations to a common, and hence useful, feature of the UG-2 chromitite. Another goal is to expand the number of variables tracking potential cryptic variations by including stratigraphic variations in chromite trace element contents. The possibility of cryptic layering in the UG-2 chromitite, and chromitites in general, was investigated because of the potential implications in the understanding of chromitite petrogenesis, and of its potential as a correlation tool, for example for the UG-2E. However, because of existing evidence of local crustal contamination in the Flatreef (e.g. Grobler et al. Citation2019), which may have affected the UG-2E, an essential step in the interpretation of chromite chemistry is to establish the range of possible variations that could be attributed solely to closed-system behaviour (i.e. without local contamination).
5.1. UG-2 chromitite as a reference to understand possible variations in chromite chemistry in closed systems
The UG-2 chromitite is arguably the best chromitite to analyse closed-system behaviour because it has been widely investigated and it is located in the middle of very thick magmatic stratigraphy (with several hundreds of metres of igneous stratigraphy above and below). Variations in major element chemistry are typically illustrated on Mg# vs. Cr# diagrams because these two parameters involve the most important substitutions in chromite (Fe-Mg for divalent cations; Cr-Al for trivalent cations).
Compilation of Mg# vs. Cr# data for Bushveld chromitites, (modified from Langa et al. Citation2021a), shows that UG-2 chromite contents define tight clusters, centred roughly at Mg# = 0.47 and Cr# = 0.65, with sporadic values defining diagonal trends of decreasing Mg# with increasing Cr# (the ‘Rhum trend’ in Henderson Citation1976; ‘Trend A’ in Naldrett et al. Citation2012). However, a detailed inspection of the data and sample descriptions reveals that the massive sections of the UG-2 (i.e. chromite mode 60% or higher) consistently have Mg# > 0.4 and exhibit narrow ranges in Mg#, which seem unrelated to further changes in chromite modal abundance (e.g. Mathez and Mey Citation2005). In contrast, samples with Mg# < 0.4 typically occur at the margins of the UG-2 or in disseminated chromite above and below the main chromitite, where chromite modal abundance is low and the chromite grains are surrounded by silicate minerals (e.g. Teigler and Eales Citation1993; Mathez and Mey Citation2005; Junge et al. Citation2014; Veksler et al. Citation2015, Citation2018). These are the chromites that largely define the pattern of increasing Cr# with decreasing Mg# (‘Trend A’ in Naldrett et al. Citation2012).
Figure 11. Mg# vs. Cr# for chromites in massive chromitites from the UG-2 and UG-2E of the Bushveld Complex (modified after Langa et al. Citation2021a). Note the direct overlap of UG-2E chromite samples with Mg# ≥ 0.4 and Cr# ≥ 0.62 with UG-2 samples.
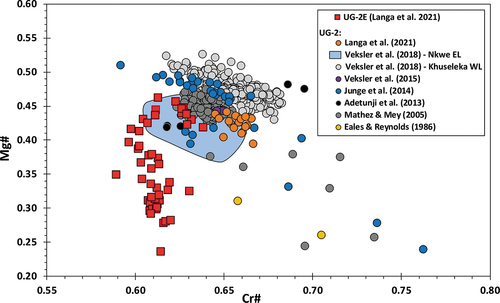
Previous studies inferred that the low Mg# and high Cr# could be the result of (1) preservation of the initial chemical composition of the chromite grains (Junge et al. Citation2014); (2) equilibration of chromite with larger amounts of residual intercumulus melts than the massive sections of the chromitite (e.g. Mathez and Mey Citation2005; Veksler et al. Citation2018) – representing the trapped liquid shift of Barnes (Citation1986); (3) sub-solidus re-equilibration of chromite with local silicate mineralogy (e.g. Teigler and Eales Citation1993; Mathez and Mey Citation2005; Veksler et al. Citation2018); or (4) late-magmatic/hydrothermal alteration of the chromite (Junge et al. Citation2014). In general, the low Mg# and high Cr# are consistent with the expected changes in chromite chemistry due to a combination of equilibration with surrounding silicate melts (trapped liquid shift), plus sub-solidus re-equilibration with silicate minerals. For example, Mg# would decrease with decreasing chromite proportion because chromite would re-equilibrate with melts and cumulus silicate minerals with higher Fe/Mg (lowering Mg#). On the other hand, Cr# would increasefor example, because Al partitions preferentially into surrounding plagioclase (e.g. Teigler and Eales Citation1993). However, Cr# can also vary depending on the system dynamics. Some examples of scenarios that could affect Cr and Al behaviour, and thus affect the Cr# include (S.J. Barnes, pers. comm., Jan. 2022): (1) Relatively high initial cumulus plagioclase abundance (and low interstitial liquid) could cause relatively constant Cr# because of less re-equilibration of chromite with plagioclase crystallizing from the interstitial liquid (i.e. less-partitioning of Al into plagioclase). (2) Preferential partitioning of Cr into interstitial (surrounding) clinopyroxene could cause a decrease in Cr# (e.g. Barnes and Roeder Citation2001). (3) A system that is cooling rapidly could inhibit Cr and Al diffusion from the chromite structure, resulting in relatively constant Cr#. In this case, the Cr and Al (Cr#) may not re-equilibrate, whereas Mg and Fe2+ (hence Mg#) could be affected by TLSE and subsolidus re-equilibration, because divalent cations diffuse much faster and continue to diffuse at lower temperatures than trivalent cations (Van Orman and Crispin Citation2010). However, trends of constant or decreasing Cr# with decreasing Mg# are not observed in the UG-2. ‘Trend A’, decreasing Mg# with increasing Cr# (Naldrett et al. Citation2012), which is consistent with the trapped liquid shift, is the expected and observed trend for ‘normal’ UG-2 intersections.
5.2. Stratigraphic variations in chromite chemistry through the UG-2 chromitite
Langa et al. (Citation2021a; also see ) showed that in Mg# vs. Cr# space the geochemical characteristics of the UG-2 reference used in this study are consistent with those of the UG-2 elsewhere in the Bushveld. However, the results from this study () show that when looked in terms of stratigraphic variations in composition, the results are different from those documented in Junge et al. (Citation2014) in several aspects. The main difference is that the shifts in Mg# and Cr# are not as common or as pronounced through the stratigraphic profile. In addition, trace element profiles do not show significant variations or variations matching the changes in Mg# or Cr#. Therefore, our results for the UG-2 reference chromitite fail to validate the hypothesis that cryptic variations are present. The only robust variations in the UG-2 reference chromitite are for V contents, which increase upwards (). Also, the differences in the UG-2 reference in our study with that of Junge et al. (Citation2014) implies that cryptic layering in the UG-2 chromitite may not be a widespread feature and that different areas of the Bushveld may exhibit different geochemical profiles.
The sample at the bottom of the UG-2 reference chromitite seam, which is in direct contact with the silicate-rich footwall rocks, has lower Mg#, but higher Cr#, Fe3+/∑Fe, Mn, Co, Ni, Ti, and Ga than the sample immediately above (). The lower Mg# and higher Cr# Fe3+/∑Fe at the base are consistent with the influence of the trapped liquid shift (as shown in Veksler et al. Citation2015, Citation2018), although the trace element behaviour could be influenced by one or more processes other than the trapped liquid shift. For example, Veksler et al. (Citation2018) showed that whole-rock enrichment or depletion in Zr and Y did not match the patterns predicted by the trapped liquid shift. The geochemical characteristics of the UG-2 reference basal chromites do not appear to be related to late-magmatic/hydrothermal alteration of the chromite, as the chromite here do not have corroded margins or alteration/replacement textures indicative of such processes.
5.3. Stratigraphic variations in chromite chemistry through the UG-2E chromitite
In contrast to the reference UG-2, three distinct sections can be recognized in the UG-2E using stratigraphic variations in major and trace elements in chromite (): a massive section at the base (0 to ~30 cm), a middle section with variable modal chromite (~30 to ~150 cm), and a top section (~150 to 184 cm) with features roughly similar to the bottom section.
Furthermore, shows that a subset of UG-2E samples defines a distinct vertical trend of decreasing Mg# without significant changes in Cr# (with Cr# ca. 0.61). Such a trend is not seen in any of the compiled data for Bushveld chromitites. The trend is defined mostly by samples with Mg# < 0.4, which corresponds to samples with lower chromite modal abundance (). The exception to the vertical trend is defined by a small cluster of samples with Mg# > 0.40 and Cr# > 0.62 that matches well with other UG-2 chromitites. These samples are mainly from the base of the UG-2E (the first 30 cm).
Although the UG-2E Cr# () does not follow the trend defined by UG-2 samples with low chromite modal abundance, the relatively constant Cr# could be explained by the offsetting effects of (1) the trapped liquid shift and (2) high initial cumulus plagioclase abundance resulting in less-partitioning of Al into plagioclase. The relatively constant Cr# could also be explained by the inability of Cr and Al to re-equilibrate because of rapid cooling of the UG-2E. Field relationships (Grobler et al. Citation2019) support this possibility because the UG-2E is much closer to its country rocks than the UG-2. This is significant because, as shown in Barnes and Robertson (Citation2019), the time scales of processes such as chromite sub-solidus re-equilibration would be dependent on the geometry of the system. Therefore, if the UG-2E cooled faster, then it is possible that Mg# (which diffuses more rapidly) re-equilibrated, but Cr# (which diffuses more slowly) did not (compared to the UG-2). Cooling time is also relevant because any cryptic variations in the UG-2 could have been minimized, or even erased, by longer cooling times, resulting in discrepancies in the geochemical profiles of the UG-2 and UG-2E.
For the higher Fe3+/∑Fe values of the UG-2E chromites (up to about 0.3) relative to those of the UG-2 (), data from Veksler et al. (Citation2018) show that UG-2 marginal chromites and disseminated chromite in the UG-2 footwall can have Fe3+/∑Fe values reaching up to 0.35. Thus, the variations in Fe3+/∑Fe within the UG-2E could also be explained by re-equilibration processes.
It can be argued that the partitioning of V into chromite is stronger in more Fe3+ rich spinel (S.J. Barnes, pers. comm., Jan. 2022), but from our data, the progressive increase in V content in the upper half of the UG-2 () does not appear to be controlled by increasing Fe3+ in chromite () or the trapped liquid effect.
For the correlation of trace elements with chromite mode, the trace elements shown in do not have an apparent positive correlation with chromite mode, which in turn, implies no apparent correlation with the trapped liquid shift (e.g. Veksler et al. Citation2018). An extra complication is that chalcophile elements such as Co, Ni, and Zn can be heavily influenced by their preferential partitioning into sulphide phases, making them less useful to track petrogenetic processes.
Similar to the UG-2 reference, the lack of alteration textures in the UG-2E chromite appears to rule out the possibility that the geochemical characteristics of the UG-2E are the result of late-magmatic/hydrothermal alteration.
5.3.1. Possible effects of crustal contamination on UG-2E chromite chemistry
Based on sulphide assemblages and composition, PGM mineralogy, and whole-rock δ34S values (Langa et al. Citation2021b), as well as proximity to local country rocks (Grobler et al. Citation2019), it is reasonable to expect that local meta-sedimentary footwall contamination affected the UG-2E. There is also abundant evidence of local country rock assimilation in drill cores through the UG-2E (Grobler et al. Citation2019; Langa et al. Citation2021a). The nature of the contamination (type of contaminants, degree of contamination) is difficult to evaluate and outside the scope of this study, because of the variability of the local host rock, which includes banded iron formation, shales, and dolostones, in variable proportions (Kinnaird Citation2005; Keir-Sage et al. Citation2021).
As discussed previously in section 5.1, it is possible to generate the trend of decreasing Mg# at nearly constant Cr# observed in the UG-2E in a closed system (i.e. system unaffected by local country rock contamination). For example, faster cooling rates could have allowed divalent cations to re-equilibrate while keeping trivalent cation re-equilibration to a minimum (e.g. Van Orman and Crispin Citation2010). Such conditions could apply to the UG-2E, which is closer to local country rocks than the UG-2. Likewise, the variations in Fe3+/∑Fe could be related to assimilation of iron from local meta-sedimentary rocks, but could also be explained by processes in a closed system, given that the changes in Fe3+/∑Fe are within the range of what has been observed in UG-2 samples (e.g. Veksler et al. Citation2015, Citation2018).
In summary, despite evidence of crustal contamination in the stratigraphic interval containing the UG-2E, chromite composition alone is not enough to infer whether chromite crystallization was affected by crustal contamination (i.e. in an ‘open system’), because the same geochemical features, although only observed in the UG-2E, can be explained by special conditions (e.g. faster cooling) within a closed system.
5.4. Implications for chromitite petrogenetic models
The subtle variations in major, minor, and trace elements in the massive sections of the UG-2 reference in this study do not support the coalescence of multiple discrete chromitite layers, as suggested by Junge et al. (Citation2014). However, our results could mean that the record of coalescence of multiple discrete chromitite layers is not equally preserved across the Bushveld. Similar studies of UG-2 chromitite in different sectors of the BIC would be needed to further assess how common cryptic layering is within the UG-2.
Establishing whether cryptic layering is present, and whether it can be linked to separate events (i.e. distinct sublayers; e.g. Junge et al. Citation2014), could be useful to understand petrogenetic processes. For example, cryptic variations, such as those documented in Junge et al. (Citation2014), and to some extent, the minor variations shown in this study, would be inconsistent with a chromitite origin via hydrodynamic sorting of crystal-rich slurries (e.g. Maier et al. Citation2013; Forien et al. Citation2015). Hydrodynamic sorting is expected to also produce silicate layers for each event, as shown by Forien et al. (Citation2015), indicating that successive slurries could not generate continuous chromitite seams. Furthermore, if chromite of different compositions were generated elsewhere, mechanical sorting of a slurry would randomize chromite grains and could not produce the progressive increase in V contents documented for the reference UG-2 suite ().
The results for the UG-2E are also inconsistent with what would be expected from hydrodynamic sorting of crystal-laden slurries. A single slurry event would not produce the three distinct sections with contrasting changes in mode and composition, and multiple-slurry events should have generated layers of silicate minerals separating the chromitites.
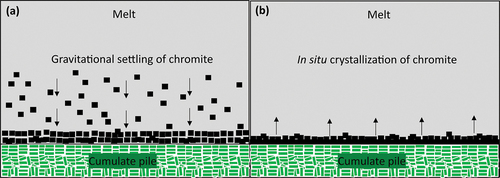
If hydrodynamic sorting is discarded, then gravitational settling (; e.g. Irvine Citation1975) or in situ crystallization (; e.g. Latypov et al. Citation2017) become the more likely mechanisms. However, mineral chemistry alone cannot distinguish between the two and field evidence is required. For example, the occurrence and abundance of continuous chromitite on overhanging pothole walls in the Bushveld (e.g. Latypov et al. Citation2015, Citation2017; Mathez and Kinzler Citation2017), which cannot be explained by gravity settling. No field evidence was collected for the sections analysed in this study, therefore we cannot further distinguish between in situ crystallization and gravitational settling.
Figure 12. UG-2 reference and UG-2E chromitite petrogenetic models. (a) Gravitational settling of chromite to form chromitite. (b) In situ crystallization of chromite to form chromitite.
One other physical process cannot be discarded. For example, for the UG-2E, the sharp changes in Mg#, Mn, Co, Ni, and Ti content, defining the bottom and top of the middle section (ca. 25 cm and 150 cm) can be interpreted as the result of magmatic erosion of pre-existing chromitite (e.g. Latypov et al. Citation2017).
6. Conclusions
The UG-2 reference suite analysed in this study shows weak evidence of cryptic variations in Mg# and Cr#. Further, the shifts observed are not as numerous or as pronounced as those documented by Junge et al. (Citation2014). In addition, trace element variations (e.g. in Mn, Zn, Co, Ni, V, Ti, Ga, and Ge contents) do not match the subtle shifts in Mg# and Cr#. Therefore, for the UG-2 reference suite studied, we could not recognize multiple discrete layers as shown for a different UG-2 intersection by Junge et al. (Citation2014). These discrepancies imply that cryptic layering may not be a common and widespread feature of the UG-2 and that chromite chemistry of the UG-2 is likely more heterogeneous across the Bushveld than can be assumed from only a few localities.
Some shifts observed in the UG-2 and UG-2E chromitites can explain by re-equilibration processes (e.g. as a result of the TLSE or sub-solidus re-equilibration with surrounding silicate minerals), especially in sections in direct contact with silicate-rich rocks or intervals with low modal chromite abundance (≪ 60% by volume).
Stratigraphic variations in major and trace element chromite chemistry through the UG-2E delineate at least three sections: bottom, middle, and top of the chromitite seam. Although drill core evidence (Langa et al. Citation2021a) and evidence from sulphide minerals (Langa et al. Citation2021b) indicate some degree of crustal contamination (open system), the variations in chromite mineral chemistry can also be explained by closed-system re-equilibration under the particular conditions of the UG-2E, such as faster cooling than the UG-2 due to much closer proximity to country rocks.
The UG-2 reference chromite chemistry profile (i.e. minor variations in chromite chemistry from the base to the top of the chromitite) do not support the formation of the UG-2 from a slurry, because slurry emplacement would randomize the position of chromite grains of different chemistry and not preserve the progressive increase in V content from the base to the top of the chromitite documented for the UG-2 reference.
The UG-2E chromite chemistry profile, especially through the massive section at the base (>60% chromite) that matches the characteristics of the UG-2 (Mg# > 0.40 and Cr# > 0.62), together with the three distinct zones within the UG-2E, do not support chromitite formation via hydrodynamic sorting of slurries.
Gravitational settling (e.g. Irvine Citation1975) or in situ crystallization (e.g. Latypov et al. Citation2017) are the likely mechanisms for chromitite petrogenesis for the UG-2 reference and UG-2E in this study.
Overall, the results of this study highlight the potential of detailed and systematic chromite chemistry, including trace elements, as a tool to understand the petrogenesis of chromitite seams in layered intrusions.
Supplemental Material
Download Zip (1.4 MB)Acknowledgments
First, we would like to thank the late Tony Naldrett for providing the UG-2 reference suite. We would like to thank the Natural Sciences and Engineering Research Council of Canada (NSERC) and Ivanplats for financial support through a Collaborative Research Grant [funding reference number CRDPJ 514753-17]. We thank the Canadian Queen Elizabeth II Diamond Jubilee Scholarships (QES) and the International Development Research Centre (IDRC) for graduate scholarships. We thank Tim Dunnett, Albie Brits, Jan Mapeka, Alexandra Crossingham, and the rest of the Ivanplats team in Mokopane for field and logistics support. We also thank Dave Crabtree (Ontario GeoLabs), Yanan Liu (University of Toronto), Rémy Poulin, and Kirk Ross (Laurentian University) for assisting with EPMA at various stages of the project; Joe Petrus (Laurentian University) for assisting with LA-ICP-MS analyses; and Willard Desjardins for preparing the polished sections. MIL acknowledges that this research was undertaken thanks in part to funding from the Canada First Research Excellence Fund through the Arthur B. McDonald Canadian Astroparticle Physics Research Institute.
Disclosure statement
We declare that we do not have any commercial or associative interest that represents a conflict of interest in connection with the manuscript submitted.
Supplementary material
Supplemental data for this article can be accessed online at https://doi.org/10.1080/00206814.2023.2169961
Additional information
Funding
References
- Alapieti, T.T., Kujanpaa, J., Lahtinen, J.J., and Papunen, H., 1989, The Kemi stratiform chromitite deposit, northern Finland: Economic Geology, v. 84, no. 5, p. 1057–1077. 10.2113/gsecongeo.84.5.1057.
- Barnes, S.J., 1986, The effect of trapped liquid crystallization on cumulus mineral compositions in layered intrusions: Contributions to Mineralogy and Petrology, v. 93, no. 4, p. 524–531. 10.1007/BF00371722.
- Barnes, S.J., 2000, Chromite in komatiites: II. Modification during Greenschist to mid-amphibolite Facies Metamorphism. Journal of Petrology, v. 41.3, p. 387–409.
- Barnes, S.J., and Maier, W.D., 2002, Platinum-group elements and microstructures of normal Merensky Reef from Impala Platinum Mines, Bushveld Complex: Journal of Petrology, v. 43, no. 1, p. 103–128. 10.1093/petrology/43.1.103.
- Barnes, S.J., and Robertson, J.C., 2019, Time scales and length scales in magma flow pathways and the origin of magmatic Ni–Cu–PGE ore deposits: Geoscience Frontiers, v. 10, no. 1, p. 77–87. 10.1016/j.gsf.2018.02.006.
- Barnes, S.J., and Roeder, P.L., 2001, The range of spinel compositions in terrestrial mafic and ultramafic rocks: Journal of Petrology, v. 42, no. 12, p. 2279–2302. 10.1093/petrology/42.12.2279.
- Barton, J.M., Cawthorn, R.G., and White, J., 1986, The role of contamination in the evolution of the Platreef of the Bushveld Complex: Economic Geology, v. 81, no. 5, p. 1096–1104. 10.2113/gsecongeo.81.5.1096.
- Cameron, E.N., 1977, Chromite in the central sector of the eastern Bushveld Complex, South Africa: American Mineralogist, v. 62, p. 1082–1096.
- Cameron, E.N., and Desborough, G.A., 1969, Occurrence and characteristics of chromite deposits—eastern Bushveld Complex: Economic Geology monograph, v. 4, p. 23–40.
- Campbell, I.H., and Murck, B.W., 1993, Petrology of the G and H chromitite zones in the Mountain View area of the Stillwater Complex, Montana: Journal of Petrology, v. 34, no. 2, p. 291–316. 10.1093/petrology/34.2.291.
- Cawthorn, R.G., 2005, Pressure fluctuations and the formation of the PGE-rich Merensky and chromitite reefs, Bushveld Complex: Mineralium Deposita, v. 40, no. 2, p. 231–235. 10.1007/s00126-005-0011-0.
- Chatterjee, N., 2012, Electron: Microprobe Analysis Course, v. 12.141.
- Cousins, C.A., and Feringa, G., 1964, The chromite deposits of the western belt of the Bushveld Complex: The Geology of Some Ore Deposits in Southern Africa, v. 2, p. 183–202.
- Dick, H.J.B., and Bullen, T., 1984, Chromian spinel as a petrogenetic indicator in abyssal and alpine-type peridotites and spatially associated lavas: Contributions to Mineralogy and Petrology. Beitrage Zur Mineralogie Und Petrologie. v. 86, p. 54–76, 10.1007/BF00373711.
- Eales, H.V., 2000, Implications of the chromium budget of the Western Limb of the Bushveld Complex: South African Journal of Geology. v. 103, p. 141–150, 10.2113/103.2.141.
- Eales, H.V., and Reynolds, I.M., 1986, Cryptic variations within chromitites of the upper critical zone, northwestern Bushveld Complex: Economic Geology, v. 81, no. 5, p. 1056–1066. 10.2113/gsecongeo.81.5.1056.
- Evans, D.M., 2017, Chromite compositions in nickel sulphide mineralized intrusions of the Kabanga-Musongati-Kapalagulu Alignment, East Africa: Petrologic and exploration significance: Ore Geology Reviews. v. 90, p. 307–321, 10.1016/j.oregeorev.2017.03.012.
- Forien, M., Tremblay, J., Barnes, S.J., Burgisser, A., and Page, P., 2015, The role of viscous particle segregation in forming chromite layers from slumped crystal slurries: Insights from analogue experiments: Journal of Petrology, v. 56, no. 12, p. 2425–2444. 10.1093/petrology/egv060.
- Friedrich, B.M., Marques, J.C., Olivo, G.R., Frantz, J.C., Joy, B., and Queiroz, W.J.A., 2020, Petrogenesis of the massive chromitite layer from the Jacurici Complex, Brazil: Evidence from inclusions in chromite: Mineralium Deposita, v. 55, no. 6, p. 1105–1126. 10.1007/s00126-019-00917-0.
- Gain, S.B., 1985, The geologic setting of the platiniferous UG-2 chromitite layer on the farm Maandagshoek, eastern Bushveld Complex: Economic Geology, v. 80, no. 4, p. 925–943. 10.2113/gsecongeo.80.4.925.
- Grobler, D.F., Brits, J.A.N., Maier, W.D., and Crossingham, A., 2019, Litho- and chemostratigraphy of the Flatreef PGE deposit, northern Bushveld Complex: Mineralium Deposita. v. 54, p. 3–28, 10.1007/s00126-018-0800-x.
- Henderson, P., 1976, Reaction trends shown by chrome-spinels of the Rhum layered intrusion: Geochimica et Cosmochimica Acta, v. 39, p. 1035–1044.
- Hey, P.V., 1999, The effects of weathering on the UG2 chromitite reef of the Bushveld Complex, with special reference to the platinum-group minerals: South African Journal of Geology, v. 102, no. 3. 251–260.
- Hutchinson, D., Foster, J., Prichard, H., and Gilbert, S., 2015, Concentration of particulate platinum-group minerals during magma emplacement; a case study from the Merensky Reef, Bushveld Complex: Journal of Petrology, v. 56, no. 1, p. 113–159. 10.1093/petrology/egu073.
- Irvine, T.N., 1965, Chromian spinel as a petrogenetic indicator: Part 1: Canadian Journal of Earth Sciences. v. 2, p. 648–672, 10.1139/e65-046.
- Irvine, T.N., 1966, Chromian spinel as a petrogenetic indicator: Part 2: Canadian Journal of Earth Sciences, v. 4, p. 71–103.
- Irvine, T.N., 1967, Chromian spinel as a petrogenetic indicator: Part 2: Petrologic Applications. Canadian Journal of Earth Sciences, v. 4, no. 1, p. 71–103. 10.1139/e67-004.
- Irvine, T.N., 1975, Crystallization sequences in the Muskox intrusion and other layered intrusions—II: Origin of Chromitite Layers and Similar Deposits of Other Magmatic Ores. Geochimica Et Cosmochimica Acta, v. 39, no. 6. 991–1020.
- Irvine, T.N., 1977, Origin of chromitite layers in the Muskox intrusion and other stratiform intrusions: A new interpretation: Geology, v. 5, no. 5, p. 273–277. 10.1130/0091-7613(1977)5<273:OOCLIT>2.0.CO;2.
- Junge, M., Oberthür, T., and Melcher, F., 2014, Cryptic variation of chromite chemistry, platinum group element and platinum group mineral distribution in the UG-2 chromitite: An example from the Karee Mine, western Bushveld Complex, South Africa: Economic Geology, v. 109, no. 3, p. 795–810. 10.2113/econgeo.109.3.795.
- Keir-Sage, E., Leybourne, M.I., Jugo, P.J., Grobler, D.F., and Mayer, C., 2021, Assessing the extent of local assimilation within the Platreef, Northern Limb of the Bushveld Igneous Complex, using sulfur isotopes and trace element geochemistry: Mineralium Deposita, v. 56, no. 1, p. 91–102. 10.1007/s00126-020-01024-1.
- Kinnaird, J.A., 2005, Geochemical evidence for multiphase emplacement in the southern Platreef: Applied Earth Science, v. 114, no. 4, p. 225–242. 10.1179/037174505X82152.
- Kinnaird, J.A., Kruger, F.J., Nex, P.A.M., and Cawthorn, R.G., 2002, Chromitite formation—a key to understanding processes of platinum enrichment: Applied Earth Science, v. 111, no. 1, p. 23–35. 10.1179/aes.2002.111.1.23.
- Kotzé, E., and Gauert, C., 2020, PGE distribution in the chromitite layers at Eastern Chrome Mine, Eastern Bushveld Complex, South Africa: A descriptive study with comparison of EPMA and LA-ICP-MS methods for detection of trace PGE in base metal sulphides: South African Journal of Geology, v. 123, no. 4, p. 551–572. 10.25131/sajg.123.0033.
- Langa, M.M., Jugo, P.J., Leybourne, M.I., and Grobler, D.F., 2021b, Sulfide mineral chemistry and platinum-group minerals of the UG-2 chromitite in the northern limb of the Bushveld Igneous Complex, South Africa: The Canadian Mineralogist. v. 59, p. 1339–1362, 10.3749/canmin.2100042.
- Langa, M.M., Jugo, P.J., Leybourne, M.I., Grobler, D.F., Adetunji, J., and Skogby, H., 2021a, Chromite chemistry of a massive chromitite seam in the northern limb of the Bushveld Igneous Complex, South Africa: Correlation with the UG-2 in the eastern and western limbs and evidence of variable assimilation of footwall rocks: Mineralium Deposita. v. 56, p. 31–44, 10.1007/s00126-020-00964-y.
- Latypov, R., Chistyakova, S., and Mukherjee, R., 2017, A novel hypothesis for origin of massive chromitites in the Bushveld Igneous Complex: Journal of Petrology, v. 58, no. 10, p. 1899–1940. 10.1093/petrology/egx077.
- Latypov, R.M., Chistyakova, S.Y., Namur, O., and Barnes, S., 2020, Dynamics of evolving magma chambers: Textural and chemical evolution of cumulates at the arrival of new liquidus phases: Earth-Science Reviews, p. 103388.
- Latypov, R., Chistyakova, S., Page, A., and Hornsey, R., 2015, Field Evidence for the In Situ Crystallization of the Merensky Reef: Journal of Petrology, egv023. no. 12, p. 2341–2372.10.1093/petrology/egv023.
- Latypov, R., Costin, G., Chistyakova, S., Hunt, E.J., Mukherjee, R., and Naldrett, T., 2018, Platinum-bearing chromite layers are caused by pressure reduction during magma ascent: Nature Communications, v. 9, no. 1, p. 462. 10.1038/s41467-017-02773-w.
- Latypov, R., O’Driscoll, B., and Lavrenchuk, A., 2013, Towards a model for the in situ origin of PGE reefs in layered intrusions: Insights from chromitite seams of the Rum Eastern Layered Intrusion, Scotland: Contributions to Mineralogy and Petrology, v. 166, no. 1, p. 309–327. 10.1007/s00410-013-0876-3.
- Lee, C.A., 1996, A review of mineralization in the Bushveld Complex and some other layered intrusions: Developments in Petrology, v. 15, p. 103–145.
- Lesher, C.M., Carson, H.J.E., and Houlé, M.G., 2019, Genesis of chromite deposits by dynamic upgrading of Fe ± Ti oxide xenocrysts: Geology, v. 47, no. 3, p. 207–210. 10.1130/G45448.1.
- Lipin, B.R., 1993, Pressure increases, the formation of chromite seams, and the development of the ultramafic series in the Stillwater Complex, Montana: Journal of Petrology, v. 34, no. 5, p. 955–976. 10.1093/petrology/34.5.955.
- Maier, W.D., Abernethy, K.E.L., Grobler, D.F., and Moorhead, G., 2021a, Formation of the Flatreef deposit, northern Bushveld, by hydrodynamic and hydromagmatic processes: Mineralium Deposita, v. 56, no. 1p. 1–20. 10.1007/s00126-020-01027-y
- Maier, W.D., Barnes, S.J., and Groves, D.I., 2013, The Bushveld Complex, South Africa: Formation of platinum–palladium, chrome-and vanadium-rich layers via hydrodynamic sorting of a mobilized cumulate slurry in a large, relatively slowly cooling, subsiding magma chamber: Mineralium Deposita, v. 48, no. 1. 1–56.
- Maier, W.D., Yudovskaya, M., and Jugo, P., 2021b, Introduction to the special issue on the Flatreef PGE-Ni-Cu deposit, northern limb of the Bushveld Igneous Complex: Mineralium Deposita, v. 56, p. 1–10.
- Manoochehri, S., Schmidt, M.W., and Britz, W., 2015, Trapped liquid, paleo-porosity and formation time scale of a chromitite–(ortho) pyroxenite cumulate section, Bushveld, South Africa: Journal of Petrology, v. 56, no. 11, p. 2195–2222. 10.1093/petrology/egv069.
- Mathez, E.A., and Kinzler, R.J., 2017, Metasomatic chromitite seams in the Bushveld and Rum layered intrusions: Elements, v. 13, no. 6, p. 397–402. 10.2138/gselements.13.6.397.
- Mathez, E.A., and Mey, J.L., 2005, Character of the UG-2 chromitite and host rocks and petrogenesis of its pegmatoidal footwall, northeastern Bushveld Complex: Economic Geology, v. 100, no. 8, p. 1617–1630. 10.2113/gsecongeo.100.8.1617.
- McLaren, C.H., and De Villiers, J.P., 1982, The platinum-group chemistry and mineralogy of the UG-2 chromitite layer of the Bushveld Complex: Economic Geology, v. 77, no. 6, p. 1348–1366. 10.2113/gsecongeo.77.6.1348.
- Mitchell, A.A., Henckel, J., and Mason-Apps, A., 2019, The Upper Critical Zone of the Rustenburg Layered Suite in the Swartklip Sector, north-western Bushveld Complex, on the farm Wilgerspruit 2JQ: I: Stratigraphy and PGE Mineralization Patterns. South African Journal of Geology, v. 122, no. 2, p. 117–142. 10.25131/sajg.122.0010.
- Mondal, S.K., and Mathez, E.A., 2007, Origin of the UG2 chromitite layer, Bushveld Complex: Journal of Petrology, v. 48, no. 3, p. 495–510. 10.1093/petrology/egl069.
- Mungall, J.E., Kamo, S.L., and McQuade, S., 2016, U–Pb geochronology documents out-of-sequence emplacement of ultramafic layers in the Bushveld Igneous Complex of South Africa: Nature Communications, v. 7, no. 1, p. 1–13. 10.1038/ncomms13385.
- Naldrett, A.J., Wilson, A., Kinnaird, J., Yudovskaya, M., and Chunnett, G., 2012, The origin of chromitites and related PGE mineralization in the Bushveld Complex: New mineralogical and petrological constraints: Mineralium Deposita, v. 47, no. 3, p. 209–232. 10.1007/s00126-011-0366-3.
- Nicholson, D.M., and Mathez, E.A., 1991, Petrogenesis of the Merensky Reef in the Rustenburg section of the Bushveld Complex: Contributions to Mineralogy and Petrology, v. 107, no. 3, p. 293–309. 10.1007/BF00325100.
- Nodder, S.M., 2015, Correlating the Bushveld’s northern limb with the western and eastern limbs: A geochemical and petrological study. Master dissertation, Cardiff University
- Roeder, P.L., and Reynolds, I., 1991, Crystallization of chromite and chromium solubility in basaltic melts: Journal of Petrology, v. 32, no. 5, p. 909–934. 10.1093/petrology/32.5.909.
- Sehoole, L., Manzi, M.S., Zhang, S.E., and Bourdeau, J.E., 2020, An innovative seismic and statistical approach to understand 3D magmatic structures and ore deposits in the western Bushveld Complex, South Africa: Ore Geology Reviewsv. 126, p. 103784. 10.1016/j.oregeorev.2020.103784.
- Sharpe, M.R., and Irvine, T.N., 1983, Melting relations of two Bushveld chilled margin rocks and implications for the origin of chromitite: Carnegie Institute Washington Yearbook, v. 82, p. 295–300.
- Teigler, B., 1999, Chromite chemistry and platinum-group element distribution of the LG6 Chromitite, northwestern Bushveld Complex: South African Journal of Geology, v. 102, no. 3. 282–285.
- Teigler, B., and Eales, H.V., 1993, Correlation between chromite composition and PGE mineralization in the Critical Zone of the western Bushveld Complex: Mineralium Deposita, v. 28, no. 5, p. 291–302. 10.1007/BF02739368.
- Ulmer, G.C., 1969, Experimental investigations of chromite spinels: Society of Economic Geologists, monograph, v. 4, p. 114–1314.
- U.S. Geological Survey (USGS), 2022, Mineral commodity summaries: U.S. Geological Survey, p. 126.
- Van der Merwe, M.J., 2008, The geology and structure of the Rustenburg Layered Suite in the Potgietersrus/Mokopane area of the Bushveld Complex, South Africa: Mineralium Deposita, v. 43, no. 4, p. 405–419. 10.1007/s00126-007-0168-9.
- Van Orman, J.A., and Crispin, K.L., 2010, Diffusion in oxides: Reviews in Mineralogy and Geochemistry, v. 72, no. 1, p. 757–825. 10.2138/rmg.2010.72.17.
- Veksler, I.V., Reid, D.L., Dulski, P., Keiding, J.K., Schannor, M., Hecht, L., and Trumbull, R.B., 2015, Electrochemical Processes in a Crystal Mush: Cyclic Units in the Upper Critical Zone of the Bushveld Complex, South Africa: Journal of Petrology, v. 56, no. 6, p. 1229–1250. 10.1093/petrology/egv036.
- Veksler, I.V., Sedunova, A.P., Darin, A.V., Anosova, M.O., Reid, D.L., Kaufmann, F.E., and Trumbull, R.B., 2018, Chemical and textural re-equilibration in the UG-2 chromitite layer of the Bushveld Complex, South Africa: Journal of Petrology, v. 59, no. 6, p. 1193–1216. 10.1093/petrology/egy058.
- Viljoen, M., 2016, The Bushveld Complex-Host to the World’s Largest Platinum, Chromium and Vanadium Resources: Episodes Journal of International Geoscience, v. 39, no. 2. 238–268.
- Voigt, M., and von der Handt, A., 2011, Influence of subsolidus processes on the chromium number in spinel in ultramafic rocks: Contributions to Mineralogy and Petrology, v. 162, no. 4, p. 675–689. 10.1007/s00410-011-0618-3.
- Voordouw, R., Gutzmer, J., and Beukes, N.J., 2009, Intrusive origin for upper group (UG1, UG2) stratiform chromitite seams in the Dwars River area, Bushveld Complex, South Africa: Mineralogy and Petrology, v. 97, no. 1–2, p. 75. 10.1007/s00710-009-0072-3.
- Vukmanovic, Z., Holness, M.B., Stock, M.J., and Roberts, R.J., 2019, The creation and evolution of crystal mush in the Upper Zone of the Rustenburg Layered Suite, Bushveld Complex, South Africa: Journal of Petrology, v. 60, no. 8, p. 1523–1542. 10.1093/petrology/egz038.
- Yudovskaya, M.A., and Kinnaird, J.A., 2010, Chromite in the Platreef (Bushveld Complex, South Africa): Occurrence and evolution of its chemical composition: Mineralium Deposita, v. 45, no. 4, p. 369–391. 10.1007/s00126-010-0276-9.