
 ?Mathematical formulae have been encoded as MathML and are displayed in this HTML version using MathJax in order to improve their display. Uncheck the box to turn MathJax off. This feature requires Javascript. Click on a formula to zoom.
ABSTRACT
The paper presents a numerical and experimental study of a setup which mimics the famous ‘sympathy’ of pendulum clocks experiment conducted by Christian Huygens. The setup consists of two pendula (metronomes) installed on a platform which can move either in horizontal or vertical direction. Existence and co-existence of different synchronisation regimes is studied both experimentally and numerically. The main contribution of the paper reveals that the stability onsets of those modes resemble behaviour of systems with auto-parametric resonance. Therefore, the resonances of translational frequency of the platform and rotational frequency of metronomes induce different types of synchronous behaviour. This novel approach turns out to be more insightful then an analysis of how the platform mass and/or the spring stiffness influence the stability onsets.
1. Introduction
In February 1665 Huygens made a discovery: two of the pendulum clocks hanging from a common wooden bar supported by two chairs demonstrated an odd phenomenon: the pendula swung in opposite direction, keeping an identical period of oscillations with respect to each other: the pendula were synchronised, or exhibited ‘sympathy’ (Huygens, Citation1893). There is a gradually growing interest in synchronisation, partly due to various applications in different fields of science and technology (Blekhman, Citation1988; Pikovsky, Rosenblum, & Kurths, Citation2003; Strogatz, Citation2003). A part of those studies is somehow inspired by Huygens' synchronisation setups (Bennett, Schatz, Rockwood, & Wiesenfield, Citation2002; Czolczynski, Perlikowski, Stefanski, & Kapitaniak, Citation2013; Fradkov & Andrievsky, Citation2008, Citation2009; Fradkov, Andrievsky, & Boykov, Citation2012; Hoogeboom, Pogromsky, & Nijmeijer, Citation2016; Kapitaniak et al., Citation2012; Kuznetsov, Leonov, Nijmeijer, & Pogromsky, Citation2007; Martens, Thutupalli, Fourriere, & Halltschek, Citation2013; Nijmeijer & Ramirez, Citation2017; Oud, Nijmeijer, & Pogromsky, Citation2006; Pantaleone, Citation2002; Peña Ramírez, Aihara, Fey, & Nijmeijer, Citation2014; Peña Ramírez, Olvera, Nijmeijer, & Alvarez, Citation2016). Besides pendulum clocks, synchronisation experiments are often conducted with metronomes. That is due to the inexpensive and easy to use nature of the simple instruments. However, researchers found that these musical tools lend themselves perfectly for conducting synchronisation experiments due to the following properties: (1) they are self-sustained, i.e. an internal source of energy is present to compensate for dissipated energy; (2) The shape of the oscillations are independent of the initial conditions and is purely described by the system parameters and (3) the oscillations are robust against small disturbances.
This allows for an easy adjustment of the metronome's eigenfrequencies and simplifies the analysis of how this frequency affects the outcome of the experiments. Briefly speaking, the change of the experimental parameters can lead to different synchronisation phenomena: the metronomes can exhibit either in-phase, or anti-phase synchronous motion, while their co-existence is also possible: in this situation the initial conditions are responsible if the metronomes eventually fall in the anti-phase or in-phase motion. A preliminary study of the bifurcations in synchronisation of metronomes is reported in Hoogeboom et al. (Citation2016) and it turns out that both the in-phase and anti-phase synchronous solutions undergo various bifurcations which result in stability changes. The role of bifurcation parameters was played by the platform mass, spring stiffness and/or the damping coefficient. The goal of this paper is to present arguments which allow to study those bifurcations as consequences of resonances between the translational frequency of the platform and rotational frequency of the metronome(s). In particular, we study how the ratio of theses eigenfrequencies influence the stability onsets of the synchronous behaviour.
One of the simplest systems which exhibits the parametric resonance is a pendulum with a periodically oscillating pivot. Despite its simplicity, the mathematical analysis is quite involved (see, e.g. Arnold, Citation1977, Citation1988, Citation1989; Broer & Vegter, Citation1992 to mention a few) and is built on stability analysis of Hill's equation. The situation, which is usually referred to as autoparametric resonance, occurs when several coupled oscillating systems with different eigenfrequencies demonstrate unstable behaviour when those frequencies satisfy a resonance condition, see, e.g. Verhulst (Citation2002). For an involved mathematical analysis of parametrically excited systems, we refer to Yakubovich and Starzhinskii (Citation1975).
In this paper we treat a Huygens inspired experimental platform of coupled self-excited pendula with rotational eigenfrequency installed on a platform with translational eigenfrequency
that can move either in horizontal or vertical direction. Via a numerical study we show that the synchronisation onset resembles Arnold's tongues and we emphasise the role of the resonance condition between
and
in the corresponding bifurcation analysis. This observation indicates that the analytical methods applicable for analysis of parametric resonance (e.g. small-parameter methods, averaging technique) could also be utilised in the analysis of synchronous behaviour in Huygens-like synchronisation setups, similar to that reported in Pena Ramirez and Nijmeijer (Citation2016).
The paper is organised as follows. First we describe the experimental platform and discuss different synchronous steady-state regimes therein. A mathematical modelling of the setup will be followed by the numerical analysis which clearly demonstrates the effect of parametric resonance.
2. Experimental results
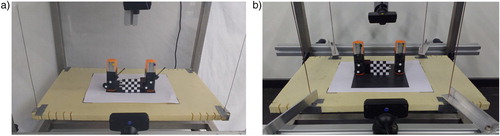
The experimental setups used in this study are depicted in Figure . They consist of two metronomes standing on a platform vertically suspended at the corners by thin cables. In the first setup, Figure (a), the platform can freely move in the horizontal plane while the vertical motion is restricted. In the second setup, Figure (b), the platform can freely move in vertical direction while motions in the horizontal plane are suppressed. Hereto, the cables are suspended by springs and are guided through thin holes in fixed metal strips to restrict motion in the horizontal plane. Due to a degree of freedom of the platform, whether it is horizontal or vertical, the metronomes are able to transfer energy to one another, hence the metronomes could potentially synchronise just like Huygens observed with pendulum clocks.
Figure 1. Experimental setups with two metronomes placed in row configuration on a platform that is solely moving in one of the elementary directions: (a) horizontal displacement; (b) vertical displacement: the cables are suspended by springs and guided through the holes in metal strips.
The metronomes used in the experiments are Nikko Lupina 311 metronomes. It is a lightweight device of approximately that consists of a pendulum with an additional small mass, called the bob, that can be slided up and down the pendulum to adjust the metronome frequency from largo 40 beats per minute (bpm) to prestissimo 208 bpm. It also contains an internal escapement mechanism that compensates for dissipated energy by giving it a small pulse every time the pendulum swings back and forth. The mechanism consists of a set of gears, axles, a toothed wheel and a coiled spring that acts as an internal energy source that can be loaded by turning a screw to the side. Each time the pendulum swings back and forth, a tooth ‘escapes’ and hits the pendulum, resulting in the pulse and the distinctive ticking sound of a metronome. In this study, the bob mass is set as close as possible to the centre of rotation, resulting in the highest natural frequency of the metronome, namely 208 beats per minute, i.e.
as two beats are generated during one cycle.
To measure the platform motions and pendulum angles, a contactless measurement setup by means of video cameras is implemented. Hereto, one camera is positioned in front of the metronomes to determine their angular displacements and a second camera is placed above the platform to measure its motions. Each camera determines its position relative to the setup with means of small checkerboard patterns and subsequently, by tracking certain black-and-white markers the desired displacements can be measured in real world coordinates.
The experiments are described as follows. The metronomes are initialised from a certain arbitrary position, however after some transient behaviour of approximately 30 seconds, the pendula seem to converge to a stable solution in which the pendula are either moving in the same or in opposite direction with equal frequency and amplitude, i.e. the metronomes are either synchronised in-phase or anti-phase. In the horizontal case, the pendula synchronise in-phase independently of the initial positions, while in the vertical case, the type of synchronisation is dependent on the initial positions. When the metronomes are released close to its in-phase, they synchronise in-phase and analogously, when they are released close to its anti-phase they synchronise anti-phase.
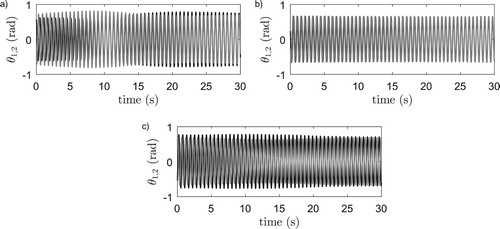
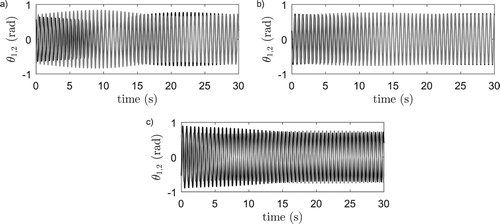
The obtained experimental results are presented in Figure where the black and gray time series correspond to the angular displacement of pendulum 1 and 2, respectively. The obtained solution regarding the horizontal system is presented in Figure (a), while the two obtained solutions regarding the vertical system are presented in Figure (b,c).
Figure 2. Experimental results, pendulum angles : black and
: gray (top). (a) Horizontal system, in-phase synchronisation. (b) Vertical system, in-phase synchronisation. (c) Vertical system, anti-phase synchronisation.
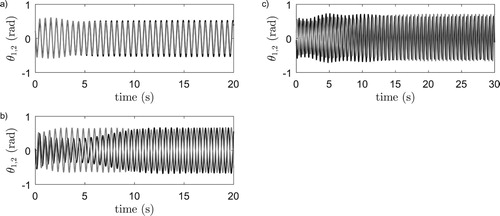
It is generally known that the stiffness of the coupling medium highly influences the synchronising behaviour of pendulum clocks or metronomes, e.g. Peña Ramírez et al. (Citation2016), Peña Ramírez et al. (Citation2014), and Hoogeboom et al. (Citation2016). Therefore, it is decided to conduct an additional set of experiments with stiffer setups. To achieve this increase in stiffness, the suspension cables are replaced by stiffer and shorter substitutes in the horizontal case, whereas in the vertical case the springs that suspend the platform are simply replaced by stiffer ones. The obtained experimental results are presented in Figure . In the horizontal case, we now observe both in- and anti-phase synchronisation depending on the initial pendula positions, see Figure (a,b), while in the vertical case we now solely observe a single type of synchronisation that is different from in-phase and anti-phase synchronisation. It is a stable solution in which one of the pendula is oscillating with a phase lead or lag with respect to the other. This type of synchronisation is called quarter-phase synchronisation and is observed numerically for vertically coupled oscillatory systems (Czolczynski et al., Citation2013; Hoogeboom, Citation2015; Kapitaniak et al., Citation2012), yet an experimental observation was still lacking.
Figure 3. Experimental results with stiffer setups, pendulum angles : black and
: gray (top). (a) Horizontal system in-phase synchronisation. (b) Horizontal system, anti-phase synchronisation. (c) Vertical system, quarter-phase synchronisation.
In conclusion, depending on the platform stiffness–and thus, the platform eigenfrequency–we see certain transformations between synchronisation regimes. This, therefore, raises questions about the influence of platform and metronome eigenfrequencies on the synchronous behaviour. In order to investigate how the interaction of those frequencies is responsible for stability/instability of the synchronous regimes, we are going to pursue the following plan: first the synchronisation setup is modelled via the first principles, then the parameters of the model are tuned to match the experimental results. Once we are certain that the model mimics the real behaviour reasonably well, we are going to study numerically how the ratio of the rotational and translational eigenfrequencies affects the stability of the synchronous regimes.
3. Modelling the experimental setup
To further investigate the frequency dependency and possible autoparametric resonance behaviour, it is necessary to derive suitable mathematical models that can accurately describe and predict the dynamics of the real systems.
3.1. Metronome model
To describe the dynamical behaviour of the Nikko Lupina 311 metronome in a mathematical sense, the same model as derived in Hoogeboom et al. (Citation2016) is used. It is a two-mass pendulum model given by
(1)
(1) where
is a smooth approximation of the escapement mechanism's impulsive input that is a function of the pendula angular displacement and velocity
(2)
(2) Herein,
approximates the sign function of the pendulum's angular velocity. The metronome parameters are identified and estimated in Hoogeboom et al. (Citation2016), partly by using conventional methods and partly by a standard least squares estimation procedure based on experimental data. The parameters, descriptions and estimated values are listed in Table .
Table 1. Properties of the Nikko Lupina 311 metronome, experimentally found by the least square method, Hoogeboom et al. (Citation2016).
3.2. Equations of motion
In order to derive a model for the experimental setups, following (Hoogeboom et al., Citation2016), consider the schematic representations in Figure . Herein the experimental setups are represented in a schematic front view with the platform in gray and the metronomes in blue. Furthermore, is a fixed world frame and
,
body fixed frames of the platform and metronome respectively. Note that the platform is assumed to solely move in a single direction which is limited by a linear spring-damper system, i.e. translations in other directions and rotations are neglected. In reality, however, some of these motions are not strictly constrained, for example the suspension of the platform in Figure (b) allows the platform to rotate in the
-plane. However, by careful positioning of the metronomes on the platform, these motions can be reduced to a minimum such that they do not significantly influence the behaviour.
Figure 4. Schematic representations of the experimental setups presented in Figure . Two metronomes (blue) coupled by a platform (gray) which motion is constricted by a linear spring-damper system. (a) Platform displaces horizontally (b) Platform displaces vertically.
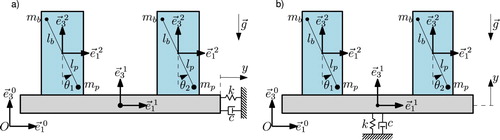
The generalised coordinates are selected as which are the platform displacement in respective direction (either horizontal, or vertical) and the pendulum angular displacements. Assuming no dry friction or backlash is present, a model is derived using the Euler-Lagrange equations of motion, which results in:
(3a)
(3a)
(3b)
(3b)
(3c)
(3c) where
,
and
, which are, respectively, the total mass, net pendulum moment and pendulum moment of inertia. Note that g denotes the gravitational acceleration, k the platform stiffness, c the platform damping and M the platform mass including the metronome casings but without the weight of the pendula. Furthermore, the functions
and
are system specific. For the horizontal system, Figure (a), these functions become:
(4a)
(4a)
(4b)
(4b) and for the vertical system, Figure (b):
(5a)
(5a)
(5b)
(5b) The platform parameters are identified using the least square estimation procedure and the resulting values are presented in Table for both the original setups (horizontal 1 and vertical 1) and for the stiffer setups (horizontal 2 and vertical 2). Note that this table also presents the resulting platform eigenfrequencies,
.
Table 2. Properties of the coupling platform (Pl), experimentally found by the least square method, Hoogeboom et al. (Citation2016).
To gain more insight in the influence of eigenfrequencies on the dynamical behaviour of the systems, the equations of motion are transformed to dimensionless form. Hereto, let be the platform's eigenfrequency;
the approximation of the natural metronome frequency;
the dimensionless platform damping factor;
the scaled platform displacement and;
a dimensionless time. Note that
and
. These scaled quantities imply the following properties:
(6)
(6) Substituting these expressions in (Equation3
(3a)
(3a) ) and rearranging terms results in the following dimensionless equations of motion:
(7a)
(7a)
(7b)
(7b)
(7c)
(7c) where
,
,
,
.
4. Numerical analysis
4.1. Computer simulations
To compare and validate the model (Equation3(3a)
(3a) ) a number of computer simulation are performed using numerical integration methods. Hereto, the parameter values are used as listed in Tables and for the original setups (horizontal 1 and vertical 1) and simulations are started with initial pendulum positions and velocities close to the experiments presented in Figure . The obtained simulation results are depicted in Figure . When comparing the simulation results with the experiments Figure , it can be concluded that the model captures the dynamical behaviour reasonably well for both the horizontal and vertical system.
Figure 5. Numerical integration results of system (Equation3(3a)
(3a) ), pendulum angles
: black and
: gray. (a) Horizontal system, in-phase synchronisation. (b) Vertical system, in-phase synchronisation. (c) Vertical system, anti-phase synchronisation. Compare this with Figure .
At this point, it should be mentioned that the solutions provided in Figures , and are periodic solutions, i.e. the time-dependent platform and pendula positions and velocities repeat itself each full swing of the metronomes.
4.2. Local stability analysis
Since the model can be assumed sufficiently accurate for this system, it can now be used to numerically investigate the influence of eigenfrequencies on the synchronous behaviour. Since the focus of this research lies in the periodic solutions rather than the transient behaviour, it is decided to use a numerical continuation and bifurcation tool instead of numerical integration methods. With the tool Auto (Doedel & Oldeman, Citation2012) it is possible to investigate the existence and stability of the periodic solutions observed during the experiments when a certain system parameter, called the bifurcation parameter, is varied.
Since we want to investigate the influence of eigenfrequencies on the synchronous behaviour of coupled metronomes, it is decided to perform this continuation procedure with the dimensionless equation of motion (Equation7(7a)
(7a) ). This way, it is possible to select the platform and metronome eigenfrequencies,
and
, directly as bifurcation parameter instead of indirect parameters like platform stiffness or mass as was done in Hoogeboom et al. (Citation2016) and Francke (Citation2016). The results of this analysis are presented in Figure . Figure (a,c) present the results regarding the horizontal system and Figure (b,d) regarding the vertical system. In each diagram, either
or
is selected as bifurcation parameter while the other is kept constant at the original metronome frequency, i.e.
or
, respectively.
Figure 6. Bifurcation diagrams computed with Auto for systems (Equation7(7a)
(7a) ).
/
/π denote in/quarter/anti-phase synchronisation and solid/dashed lines denote stable/unstable solutions. (a) Horizontal system,
and
is bifurcation parameter. (b) Vertical system,
and
is bifurcation parameter. (c) Horizontal system,
and
is bifurcation parameter. (d) Vertical system,
and
is bifurcation parameter.
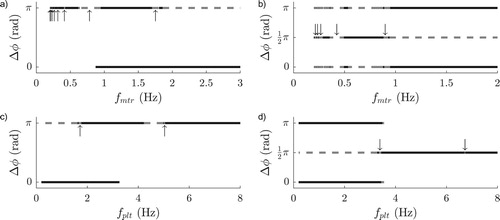
At first, we conclude that the observations made during the experiments and simulations are in correspondence with the bifurcation diagrams, i.e. the observed synchronisation phenomena for the platform eigenfrequencies mentioned in Table are corresponding with Figure (c,d). Secondly, we observe that in the horizontal case, a transformation between solely stable in-phase to stable in- and anti-phase synchronisation occurs at approximately , and in the vertical case, a transformation from stable in- and anti-phase to solely stable quarter-phase synchronisation at approximately
. Thirdly, Auto experiences numerical difficulties for certain synchronised solutions which is why no data is available in certain frequency ranges for: (1) In-phase synchronisation in Figure (a); (2) In-phase synchronisation in Figure (c); (3) In- and anti-phase synchronisation in Figure (d). However, it should be mentioned that other synchronous behaviour may be possible within these regions. For example, it is known that there exists more than one type of in-phase synchronisation (Francke, Citation2016). Fourthly, in Figure , the in- and anti-phase solutions become generally unstable below
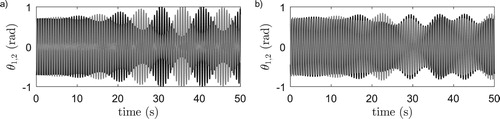
except for some inexplicable small stable sections. Finally, at the small arrows, we observe certain windows in the eigenfrequency bands in which the anti- and quarter-phase solutions of respectively the horizontal and vertical system become unstable. To see what happens inside these regions, simulations are performed within these regions and with initial pendula positions close to anti- respectively quarter-phase synchronisation. The resulting angular displacements of the pendula are presented in Figure . Clearly, after some transient behaviour, the metronomes converge to some kind of oscillating behaviour that is not related to synchronisation whatsoever. Considering the type of behaviour and the locations of the unstable regions, this behaviour is most likely originating from auto-parametric resonating effects.
Figure 7. Numerical integration results of system (Equation7(7a)
(7a) ) with
, pendulum angles
: black and
: gray. (a) Horizontal system,
. (b) Vertical system,
.
To further investigate the occurrence of auto-parametric resonance, it is required to get stability information about the anti- respectively quarter-phase solutions for the full -parameter space. Unfortunately, the bifurcation diagrams in Figure solely provide stability information about a few small subspaces of the full parameter space, see the gray lines in Figure which correspond to the stable solutions from Figure . To gain information about the remaining parameters, we performed a large number of computer simulations. Hereto, the dimensionless system (Equation7
(7a)
(7a) ) is simulated for different combinations of
and
and stability of the anti- and quarter-phase solutions for, respectively, the horizontal and vertical systems is determined accordingly. The results of this simulation study are presented in Figure . Herein the stability of the anti- respectively quarter-phase solution is depicted in terms of the platform eigenfrequency
and the ratio of frequencies
. White means stable behaviour and black means unstable behaviour.
Figure 8. (a) Stability of the anti-phase solution of the horizontal system, White/black denote stable/unstable anti-phase behaviour. Gray lines correspond to stable anti-phase behaviour according to the local stability analysis of Figure (a,c), see the vertical arrows therein. (b) Stability of the quarter-phase solution of the vertical system, White/black denote stable/unstable quarter-phase behaviour. Gray lines correspond to stable quarter-phase behaviour according to the local stability analysis of Figure (b,d), see the vertical arrows therein.
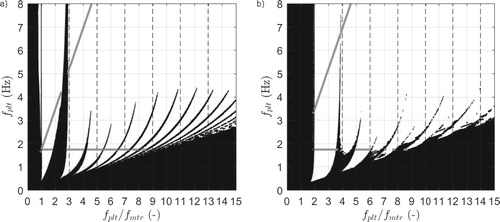
As can be seen, the results of the local stability analysis are in good correspondence with the simulation study, except for small sections around , 6.5 and 7.3 in Figure (b). This may be due to numerical difficulties in determining quarter-phase synchronisation, which also declares the granular nature of the results. Furthermore, the solutions are generally stable except for low platform frequencies, low
ratio, and the so-called Arnold tongues that clearly show the regions in which auto-parametric resonance affects the stability of the solutions. In the horizontal case, these tongues seem to appear and converge to platform eigenfrequencies that are odd multiples of the metronome eigenfrequency, i.e.
(8)
(8) While in the vertical case, the tongues seem to appear and converge when the platform eigenfrequency is close to even multiples of the metronome eigenfrequency, i.e.
(9)
(9)
In conclusion, it can be stated that coupled metronome systems are indeed subject to auto-parametric resonance and stability/instability of the synchronous regimes is influenced by the ratio of translational and rotational eigen-frequencies. When the metronomes are coupled in horizontal fashion, it affects the stability of the anti-phase synchronised solution, and in case of vertical coupling, it affects the stability of the quarter-phase synchronised solution.
5. Conclusions
The paper demonstrates that the stability/instability of the synchronous regimes in Huygens-like synchronisation setups is influenced by the ratio of the translational and rotational eigen-frequencies similar to systems exhibiting auto-parametric resonance. This observation augments previous studies on bifurcations of synchronous solutions in systems of coupled metronomes. Our analysis is made via a numerical study of the model of the synchronisation setup. The model of the setup is derived via the first principles in Hoogeboom et al. (Citation2016) and matches the experimental results reported in this paper.
The results reported support the conclusion that an analytical study of stability of synchronous regimes could be performed by the analytical methods capable to expose the parametric resonance, i.e. methods based on small parameters and averaging technique. An attempt to employ those methods for a justification of the system behaviour similar to Figure is a subject of our ongoing research.
Acknowledgments
This paper is dedicated to Professor Alexander Fradkov on the occasion of his 70th birthday. The authors warmly acknowledge fruitful collaboration with Professor Fradkov in different areas of science and engineering initiated 25 years ago and inspired by Huijgens' discovery.
Disclosure statement
No potential conflict of interest was reported by the authors.
References
- Arnold, V. (1977). Loss of stability of self-oscillations close to resonance and versal deformations of equivalent vector fields. Functional Analysis and its Applications, 11, 1–10. doi: 10.1007/BF01135526
- Arnold, V. (1988). Geometrical methods in the theory of ordinary differential equations (2nd ed.). New York: Springer-Verlag.
- Arnold, V. (1989). Mathematical methods of classical mechanics (2nd ed.). New York: Springer-Verlag.
- Bennett, M., Schatz, M., Rockwood, H., & Wiesenfield, K. (2002). Huygens' clocks. Proceedings of the Royal Society of London. Series A: Mathematical, Physical and Engineering Sciences, 458, 563–579. doi: 10.1098/rspa.2001.0888
- Blekhman, I. (1988). Synchronization in science and technology. New York, NY: ASME Press.
- Broer, H., & Vegter, G. (1992). Bifurcational aspects of parametric resonance. In Dynamics reported. Expositions in dynamical systems (pp. 1–53). Berlin: Springer.
- Czolczynski, K., Perlikowski, P., Stefanski, A., & Kapitaniak, T. (2013). Synchronization of the self-excited pendula suspended on the vertically displacing beam. Communications in Nonlinear Science and Numerical Simulation, 18, 386–400. doi: 10.1016/j.cnsns.2012.07.007
- Doedel, E., & Oldeman, B. (2012, January). Auto-07p: Continuation and bifurcation software for ordinary differential equations [Computer software manual]. Montreal, Canada.
- Fradkov, A., & Andrievsky, B. (2008). Control of wave motion in the chain of pendulums. In Proceedings of the 17th IFAC world congress (pp. 3136–3141). Seoul, Korea, July 6–11.
- Fradkov, A., & Andrievsky, B. (2009). Behavior analysis of harmonically forced chain of pendulums. In 18th IEEE international conference on control application (pp. 1563–1567). St. Petersburg, Russia, July 8–10.
- Fradkov, A., Andrievsky, B., & Boykov, K. (2012). Multipendulum mechatronic setup: Design and experiments. Mechatronics, 22, 76–82. doi: 10.1016/j.mechatronics.2011.11.006
- Francke, M. (2016). Huygens' synchronization: Parametric resonance and multi-dimensional coupling (Unpublished master's thesis). Eindhoven University of Technology.
- Hoogeboom, F. (2015). Huygens' synchronization: Experiments, modeling, and stability analyses (Unpublished master's thesis). Eindhoven University of Technology.
- Hoogeboom, F., Pogromsky, A., & Nijmeijer, H. (2016). Huygens' inspired multi-pendulum setups: Experiments and stability analysis. Chaos: An Interdisciplinary Journal of Nonlinear Science, 26, 116304. doi: 10.1063/1.4965031
- Huygens, C. (1893). Correspondance 1664–1665. In Ouvres completes de Christiaan Huygens (Vol. V). The Hague: La Societe Hollandaise Sciences.
- Kapitaniak, M., Brzeski, P., Czolczynski, K., Perlikowski, P., Stefanski, A., & Kapitaniak, T. (2012). Synchronization thresholds of coupled self-excited nonidentical pendula suspended on the vertically displacing beam. Progress of Theoretical Physics, 128(6), 1141–1173. doi: 10.1143/PTP.128.1141
- Kuznetsov, N., Leonov, G., Nijmeijer, H., & Pogromsky, A. (2007). Synchronization of two metronomes. IFAC Proceedings Volumes, 40(14), 49–52. doi: 10.3182/20070829-3-RU-4912.00007
- Martens, E., Thutupalli, S., Fourriere, A., & Halltschek, O. (2013). Chimera states in mechanical oscillator networks. Proceedings of the National Academy of Sciences, 110, 10563–10567. doi: 10.1073/pnas.1302880110
- Nijmeijer, H., & Ramirez, J. P. (2017). De sympathie van twee slingeruurwerken: Wat zag Huygens (NIET)? Nederlands Tijdschrift voor Natuurkunde [Dutch Journal of Physics], 36–39.
- Oud, W., Nijmeijer, H., & Pogromsky, A. (2006). A study of Huygens' synchronization: Experimental results. In Group coordination and cooperative control: Lecture notes in control and information science (pp. 191–203). Berlin: Springer-Verlag.
- Pantaleone, J. (2002). Synchronization of metronomes. American Journal of Physics, 70, 992–1000. doi: 10.1119/1.1501118
- Pena Ramirez, J., & Nijmeijer, H. (2016). The Poincare method: A powerful tool for analyzing synchronization of coupled oscillators. Indagationes Mathematics, 27, 1127–1146. doi: 10.1016/j.indag.2015.11.008
- Peña Ramírez, J., Aihara, K., Fey, R., & Nijmeijer, H. (2014). Further understanding of Huygens' coupled clocks: The effect of stiffness. Physica D: Nonlinear Phenomena, 270, 11–19. doi: 10.1016/j.physd.2013.12.005
- Peña Ramírez, J., Olvera, L., Nijmeijer, H., & Alvarez, J. (2016). The sympathy of two pendulum clocks: Beyond Huygens' observations. Scientific Reports, 6, 23580. doi: 10.1038/srep23580
- Pikovsky, A., Rosenblum, M., & Kurths, J. (2003). Synchronization: A universal concept in non-linear sciences. Cambridge: Cambridge University Press.
- Strogatz, S. (2003). SYNC: The emerging science of sponteneous order. New York, NY: Hyperion.
- Verhulst, F. (2002). Parametric and autoparametric resonance. Acta Applicandae Mathematica, 70, 231–264. doi: 10.1023/A:1013934501001
- Yakubovich, V., & Starzhinskii, V. (1975). Linear differential equations with periodic coefficients. New York, NY: John Wiley and Sons.