
Abstract
The paper offers an attempt to determine whether emissions from the unconventional gas industry are associated with hospitalisations in the Darling Downs, Queensland, Australia. Hospitalisation data were obtained from the Darling Downs Hospital and Health Services (DDHHS) and Coal Seam Gas (CSG) emissions data from the National Pollutants Inventory (NPI). Hospital admissions for circulatory and respiratory conditions, controlled for population, increased significantly from 2007 to 2014 (p < 0.001). Acute circulatory admissions increased 133% (2198–5141) and acute respiratory admissions increased 142% (1257–3051). CSG emissions increased substantially over the same period: nitrogen oxides (489% to 10,048 tonnes), carbon monoxide (800% to 6800 tonnes), PM10 (6000% to 1926 tonnes), volatile organic compounds (337% to 670 tonnes) and formaldehyde (12 kg to over 160 tonnes). Increased cardiopulmonary hospitalisations are coincident with the rise in pollutants known to cause such symptoms. Apparently, controls to limit exposure are ineffectual. The burden of air pollution from the gas industry on the wellbeing of the Darling Downs population is a significant public health concern.
Introduction
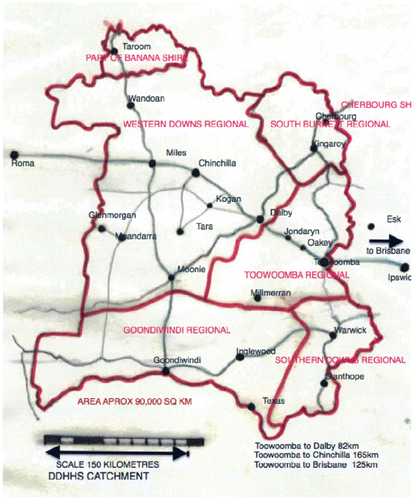
The Darling Downs (Figure ) west of the Great Dividing Range in Southern Queensland, Australia has long been noted for its robust, diversified agricultural industry and natural beauty [Citation1]. The Darling Downs Hospital and Health Service (DDHHS) covers an area of approximately 90,000 sq km with catchment population ca. 277,000 [Citation2]. There has been rapid development of the resources industry (CSG, underground gasification, coal), superimposed on pre-existing rural, farming and small town communities in the area now often known by its geological name, ‘the Surat Basin’.
Figure 1. Map DDHHS catchment showing Local Government Areas. Source: Author.
Outdoor air pollution, especially in an industrial context, has demonstrated multiple negative human health effects [Citation3]. Air pollution increases risks for a wide range of diseases including respiratory [Citation4] and cardiac [Citation5,6], and is a leading environmental cause of cancer deaths [Citation7]. Some effects are long-term and causation can be difficult to prove. For instance, a heart attack or stroke resulting from exposure during a day of high ambient PM concentration may be a consequence of chronic disease progression associated with long-term exposure [Citation8]. Emissions acknowledged by the CSG industry can be linked to both acute and chronic health effects (see Table , summary of air toxins/related health effects).
Table 1. Air toxins and associated health effects.
The unchecked expansion of unconventional gas companies into what was previously an agrarian area of the Darling Downs has led to the generation of extra emissions attributable to a single industry.
Concurrent with the rapidly expanding CSG developments, residents in Queensland’s Darling Downs reported impairments to their health [Citation23,24]. As acknowledged by the Darling Downs Public Health Unit (DDPHU) health impacts associated with Coal Seam Gas have been a major community concern. Since 2008 DDPHU has received a variety of health complaints related to this industry (including headaches, sore eyes, nosebleeds, rashes, respiratory symptoms, paraesthesia) [Citation25].
Yet there has been a remarkable lack of substantive investigation into potential human health impacts of the CSG industry in the Darling Downs. No baseline environmental studies, human health risk assessments or health studies were undertaken before large-scale extraction took place. State-based research organizations expected to be active in the space have disclosed little research investigating the possible physical health impacts of unconventional gas emissions. The significant 2010 Australian Research Council linkage project ‘A Human Health Risk Assessment for developing CSG water resources in Queensland’ [Citation26] was not pursued, purportedly because the industry partner, Santos, withdrew funding. A notable exception is the work of Werner et al. [Citation27] reviewing hospitalisation data up to 2011 for 3 areas in Queensland, with the finding that certain hospital admissions rates (neoplasms and blood/immune diseases) increased more quickly in the CSG area than the other study areas, after adjusting for key sociodemographic factors. In other jurisdictions, specifically the USA, increased rate and severity of asthma attacks [Citation28], increased hospitalisation [Citation29] for asthma, cardiac, neurological and skin conditions, increased incidence of congenital heart defects [Citation30], childhood leukaemia [Citation31], low birth weight [Citation32], and early infant death [Citation33] correlated with the presence of the unconventional gas industry. International researchers have documented significant declines in air quality correlating with gas industry activities [Citation34–36].
Despite appeals from health professionals to improve oversight, state and federal regulatory bodies have failed to act. In 2013 the Australian Medical Association (AMA) issued a policy statement warning: ‘Despite the rapid expansion of CSG developments, the health impacts have not been adequately researched, and effective regulations that protect public health are not in place’ [Citation37]. In 2013 also, the Queensland Government undertook a limited investigation into health complaints of Darling Downs residents [Citation38]. The report, while unable to determine whether reported health effects were clearly linked to exposure to CSG pollutants, acknowledged that there was ‘some evidence that might associate some of the residents’ symptoms to exposure to airborne contaminants arising from CSG activities.’ The critical recommendation from Queensland Health was that the regulator, the Department of the Environment and Heritage Protection (DEHP) monitor overall CSG emissions and the exposure of local communities to those emissions. DEHP acknowledged that they did not have access to data to allow for comparisons to the air quality objectives set out in the Environmental Protection Policy (EPP) (Air) to protect environmental values (including health and wellbeing). Despite this, DEHP determined that they found no cause to expand monitoring, thereby blocking Queensland Health’s recommendation that overall gasfield emissions and the exposure of the community to those emissions be monitored [Citation39]. The rejection by the regulator of these recommendations is of serious concern.
The anecdotal reports of health effects related to CSG industry activity [Citation23], coupled with the dearth of available research in the Australian context, motivated this investigation. This paper seeks to compile available reported emissions from CSG installations in the Darling Downs area and determine whether such activity is coincident with an increase in acute health effects. It brings together data on air pollutants as reported by the industry to the National Pollutant Inventory (NPI) [Citation40], population data from the Australian Bureau of Statistics (ABS) and hospitalisation data from the Darling Downs Hospital and Health Services (DDHHS).
Method
Population data
Estimated resident population by local government area (LGA), Queensland, 2007–2014 (Queensland Government Statistician’s Office) was sourced from ABS 3218.0, Regional Population Growth, Australia, 2015–2016 and Queensland Treasury estimates where Geographies were based on the 2016 edition of the Australian Statistical Geography Standard (ASGS) [Citation41].
Air toxics data
Reported emissions to air were obtained from the Commonwealth Department of the Environment’s National Pollutant Inventory Website [Citation40]. Above a defined threshold, the Australian Government requires polluting industries to self-report to the NPI their calculated, estimated emissions of 93 toxic substances, identified as important owing to their possible effect on human health and the environment.
Hospital admission data
Inpatient admissions were obtained for DDHHS and South West residents treated within all acute public hospital facilities interfaced to the Transition 11 clinical benchmarking system. This included all Activity Based Funding (ABF) facilities and the majority of satellite facilities within each HHS, but excluded the Brisbane Mater Adult, Mothers and Children’s Hospitals. Hospitalisation of residents from South West has been separated from the main DDHHS data, as with such a large, sparsely populated area (310,000 km2, population approximately 26,000) it is difficult to draw inferences regarding activity and effects. Data on hospital admissions were provided by DDHHS for the years 2006–2015. Data for 2006 were partial (01/07/06 to 31/12/06) and data for 2015 was also incomplete (01/01/15 to 18/08/15) and were excluded.
Statistical analysis
Acute hospital admission data (circulatory and respiratory) were controlled for population increases in the DDHHS catchment. Linear regression analysis was performed using SPSS.
Results
In the DDHHS region, in 2015 there were 3521 registered births and 2353 registered deaths. In 2011, 2.4% of the population (2763) in the region was employed in mining.Footnote1 Statistics from the ABS indicate population increase from 252,785 to 276,723 [Citation41]. The region with regard to Queensland regional statistics means the area serviced by the Darling Downs Hospital and Health Service as shown by their maps; including Cherbourg, Goondiwindi, South Burnett, Southern Downs, Toowoomba and Western Downs, and Taroom.Footnote2,Footnote3
Linear regression analysis was performed on the hospital admissions data, controlled for population, versus time (Table and Figure ). Admissions for circulatory conditions significantly increased over the period from 0.87% in 2007 to 1.86% in 2014 (R2 = 0.908, p < 0.001). Respiratory admissions also significantly increased from 0.50% in 2007 to 1.10% in 2014 (R2 = 0.913, p < 0.001).
Table 2. DDHHS acute hospital admissions by residence and year.
Figure 2. DDHHS acute circulatory and respiratory hospital admissions as a percentage of population from 2007 to 2014.
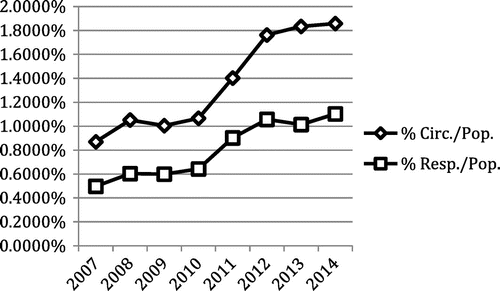
Figure shows a map of the Darling Downs showing towns, gas wells and gas facilities. Table is a compilation of emissions reported to the NPI by QGC, Origin, Santos, and Arrow facilities in the DDHHS catchment (2005/06–2015/16). Figures and graph selected emissions (2007–2014).
Figure 3. Map: gas wells (triangles), CSG emission reporting sites (flame). Source Google Earth Pro, overlay Landstat/Copernicus. (cited 2017 August 4).
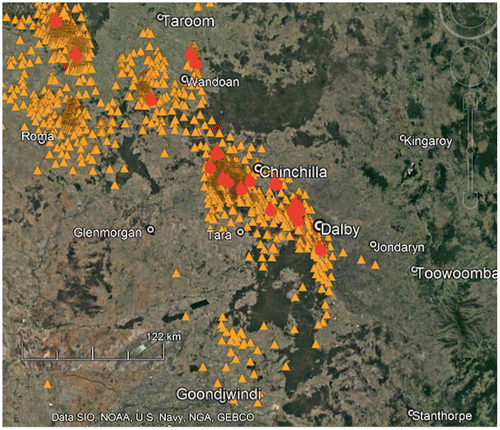
Table 3. Compilation NPI data, self-reported emissions (kilograms) QGC, Origin, Santos, Arrow facilities DDHHS Western Darling Downs catchment 2005/06–2015/16.
Figure 4. Selected emissions: carbon monoxide, oxides of nitrogen, particulate matter 10, (Kilograms) Western Darling Downs, reported by CSG companies QGC, Origin, Arrow, Santos.
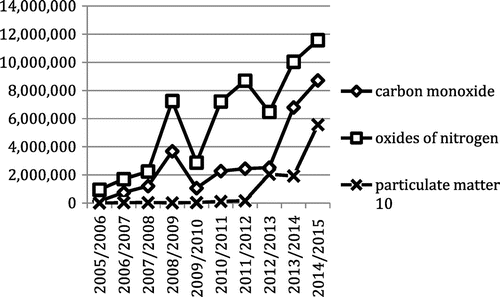
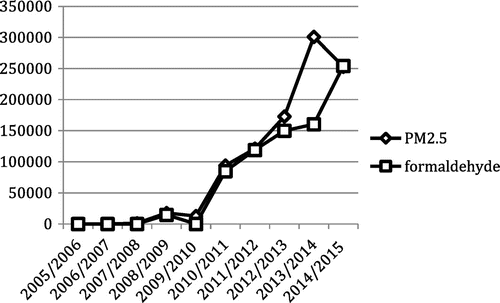
Figure 5. Selected emissions: Particulate matter 2.5, formaldehyde (Kilograms) Western Darling Downs, reported by CSG companies QGC, Origin, Arrow, Santos.
Limitations
There are limitations to the data available for consideration. For instance it was not possible to break down admissions into demographics (age/gender) and times/dates of admission. Factors for which data are unavailable are the change, if any, in the population rates of cigarette smoking and obesity, and the prior health status of residents who may have moved into (and out of) the area between 2007 and 2014. The contribution to ill health of viral epidemics is unknown (e.g. swine flu 2009, but the expected peak and return to baseline in the following year did not occur (Table ).
NPI reporting of emissions is annual, with no data available on times/dates/durations of peak emissions, and no data available on the prevailing weather conditions. The difficulty in correlating lower volume pollutants to chronic (cancer, neurodevelopmental) health conditions is recognised, hence the need to rely on high volume pollutants and acute health effects. An assessment of the cumulative load of air toxins such as phenol, n-hexane, PAHs and heavy metals was impossible as reporting was inconsistent. Other resource developments (coal/underground gasification), and possible changes in agricultural practices have not been studied.
It is also notable that the gross emission values provided by the NPI are industries’ estimates of their releases to air. As these are total annual estimates, it is impossible to calculate the resulting concentration of pollutants, either individually or combined in the airshed at any given time with any confidence. Nor can the results be used to compare air emissions against any relevant national or state air quality guidelines or standards, given as concentrations. Estimates of the aggregate pollutant load and concentration do not capture spatial or temporal conditions, which may lead to dangerous exposure and therefore acute or chronic health effects (point emission, low air temperature, etc. See below).
Discussion
There are noted anomalies in the industry NPI data. In 2008/2009 across all Arrow projects, there was detailed reporting of a wide range of toxins, yet many were not reported previously or since. During that year, levels of carbon monoxide and oxides of nitrogen were significantly higher than recorded in the preceding/following year. No explanation is apparent. After 2009/2010 several projects across the Darling Downs and South West no longer reported benzene, though previously reporting significant volumes. Despite undertaking comparable activities, Santos consistently failed to report formaldehyde emissions while QGC reported up to 219 tonnes per year. Although reporting is a statutory requirement, data are self-calculated (estimated, not measured) and are not reported below a threshold. It is difficult to know how such reporting could be audited. It is plausible that emissions have been substantially underestimated.
Emissions reported by the CSG industry to the NPI have escalated since expansion of CSG from 2006 onwards. Toxins include particulate matter with over 6,000% increase in reported emissions of PM10 between the years of 2006/2007 and 2013/2014 (29.19–1926.9 tonnes). Reported emissions of PM2.5 increased from zero to 301 tonnes. Emissions of oxides of nitrogen increased by 489%, (1704–10048 tonnes) VOCs by 337%, (153.4–670.6 tonnes) CO by 801%, (754–6,800 tonnes) SO2 by more than 1000% (1.14–12.97 tonnes) and, remarkably emissions of the known carcinogen formaldehyde increased from 12 kg to 160.42 tonnes over the same time period. Further escalation in emissions is noted in the reporting periods 2014/2015, and 2015/2016 (Table ).
Between the years of 2007 and 2014, hospitalisations of DDHHS patients for respiratory conditions increased by 142%, and hospitalisations for circulatory conditions increased by 133%. Hospitalisations from DDHHS areas fluctuated between 2007 and 2010 with significant rates of change apparent in 2010/2011 (circulatory conditions increased 32%, respiratory conditions 42%) and 2011/2012 (circulatory conditions increased 27%, respiratory conditions 18%). Increases were evident across all DDHHS areas including areas relatively distant from intense gas field industrialisation such as Goondiwindi and Inglewood. Interpretation of individual changes in these very low population centres is made more difficult by the number of drive in/drive out gasfield workers from across the Darling Downs.
Changes are not explicable by the modest population increase of 9.46% during the same time period, or the change in median age, which over the longer time frame of 2005–2015 increased by 2.4 years. They do however give weight to the community’s perception that there has been an adverse change in their health status. It is noted that these changes were not commented on in the Queensland Government 2013 CSG investigation. This may relate to the limits of their terms of reference and/or lag time with data compilation.
There is international acknowledgement of the serious adverse impacts on human health of air pollution in general, and the toxicity of the specific air pollutants reported by the gas industry to the NPI (see Table , summary of air toxins/related health effects). Many families, including young children are, for up to 24 h a day, living, breathing and sleeping in the midst of point emission sources in Queensland’s gasfields. They are exposed to acute peaks and chronic, lower concentrations of mixtures of harmful chemicals. Air dispersion throughout the regional airshed means the broader population is likely to be repeatedly exposed to lower doses of the same toxins.
Although the quantity of emitted pollutants is notionally ‘within guidelines,’ there does not appear to be a level of emissions unacceptable to industry or the regulator. Former Queensland Premier Campbell Newman stated: ‘Emission limits are not prescribed for each gas well or the broader reticulation system but rather, emissions from this infrastructure must not cause nuisance or environmental harm’ (Letter from The Hon. Campbell Newman, Premier of Queensland, to Dr McCarron, 7th November 2012).
Currently, production facilities act with the assumption that emitted pollutants will be dispersed in the surrounding airshed to ‘safe’ levels (Dilution is assumed to be the solution to pollution) [Citation42].
Since there is an unexplained rise in hospitalisations for health conditions associated with exposure to CSG emissions coincident with the expansion of the industry, it is questionable whether this management strategy is effective. Such a method for the neutralisation of harmful wastes largely ignores local environmental effects: large-volume point emissions, wind strength/direction and day/night temperature differences which could lead to adverse levels of exposure.
Australia has National Air Quality Standards with defined maximum limits for the aforementioned pollutants (CO, NO2, Ozone, SO2, Lead, PM10) over specified averaging periods [Citation43]. Yet without real-time 24 h monitoring, there is no way to know whether such standards have been exceeded. Additionally, deleterious health effects have been noted to occur at levels below current air quality guidelines, and for many pollutants it is not clear whether a safe threshold exists [Citation3]. The Queensland Government has an ambient air-monitoring network [Citation44], but before February 2015 there was not a single air monitoring station sited in the expanding gas fields, with no station west of Jondaryan (see Figure , operated March 2014–Aug 2016). Air monitoring has been infrequent, ad hoc, episodic and reactive [Citation45]. Often, air monitoring did not occur until weeks after the local community reported extreme pollution events such as intense flaring. Monitoring and reporting practices for air quality appear inadequate to protect public health [Citation46]. Drinkwater (2015) noted the limited monitoring data received through the RTI process, and queried whether there is a shortfall in the process or whether monitoring data simply do not exist [Citation47]. Both considerations point to regulatory failure.
In this study the limitations of reporting requirements to the NPI were such that it was not possible to calculate the cumulative load of low volume highly toxic pollutants (phenol, PAH, BETX, heavy metals, etc.). Nevertheless, the need to monitor and restrict emissions of such pollutants is critically important, as they may be associated with future chronic health conditions, including cancer [Citation48] and neurodevelopmental abnormalities [Citation49].
DDHHS hospitalisation data for acute respiratory and circulatory conditions appear consistent with short-term health impacts of air pollution. Of concern is the future health of a population subject to chronic exposure. Long-term, real-time 24-h exposure monitoring to capture the temporal and spatial variability of a wide range of key environmental toxins is necessary to assess exposure. Average ambient levels do not give an adequate assessment of the health risks to vulnerable subgroups of the population [Citation50]. This applies particularly to children, pregnant women, the ill, including those with pre-existing cardiac and respiratory disease, and the elderly. It applies to those living in close proximity to infrastructure, who are exposed to spikes of multiple air toxins, with increased risks on still nights during temperature inversions. These are the populations also at most risk to high volume pollutants. Children, with their high ventilation rates per body weight and increased activity and play outdoors, are particularly susceptible to the adverse effects of air pollution [Citation51]. When exposed to mixtures of toxic chemicals they have heightened risk because of the immaturity of their immune and metabolic responses and their potential to live long enough for latent illnesses to develop [Citation52]. It is increasingly recognised that even current air standards properly applied provide suboptimal protection for the most vulnerable in our society. Monitoring by the regulatory bodies has been ineffectual and inadequate to protect public health. Over the past decade, an unmistakeable and significant change in the life of residents of the Darling Downs has related to the arrival and activities of the CSG industry. There has been an escalation in health impairment correlating with, and potentially attributable to, the escalating air pollution from this heavy industry. This is demonstrated by acute respiratory and circulatory hospitalisation. Hospitalisation is an extreme indicator of morbidly and does not take into account the potential full spectrum of health harms experienced by the community.
Conclusion
Health impacts from Coal Seam Gas have been a major community concern since the introduction of CSG industries in Queensland. For almost a decade the community has recognised and reported concerns about their changed health status.
Whilst the full range of factors underlying the escalating hospitalisation of Darling Downs’ residents for acute respiratory and circulatory conditions is unknown, the DDHHS statistics are significant and warrant full investigation as to causal factors. Communities in the Darling Downs have been exposed to significant pollution associated with the rapid and extreme industrialisation by the gas industry and with toxins directly attributable to that industry. The considerable growth in hospitalisations for acute respiratory and circulatory conditions concurrent with the increase in toxic pollutants in the local airspace suggests that controls to limit exposure are ineffectual.
A growing body of published research on the industry’s emissions and resultant adverse health impacts supports the decisions by other jurisdictions (France, Ireland, Bulgaria, New York State), to impose bans on unconventional gas development. Acute hospitalisation data from the Darling Downs raise a red flag. It is urgent that there should be a comprehensive investigation of the health impacts from the unconventional gas industry in Australia.
Disclosure statement
No potential conflict of interest was reported by the author.
Acknowledgements
Acknowledgement and thanks to the Darling Downs Hospital and Health Service for providing data relating to hospital admissions. The author is grateful to Dr Rye Senjen, Dr Jed Burns and Ms Shay Dougall for review, comments and assistance with statistics and maps.
Notes
1. ‘Mining’ includes coal mining, oil and gas extraction, metal ore mining, non-metallic mineral mining and quarrying, exploration and other mining support services.
2. http://www.qgso.qld.gov.au/index.php.
3. For reasons of space, the author is not including supplementary material in the paper, but it can be provided upon request.
References
- Queensland Government, 2012, The Queensland plan regional snapshot darling downs. Available online at: http://www.queenslandplan.qld.gov.au/resources/assets/regional-fact-sheets-darlingdowns.pdf (accessed 21 July 2017).
- Queensland Government, Queensland Health, 2016, Darling Downs hospital and health service annual report. Available online at: https://www.health.qld.gov.au/__data/assets/pdf_file/0017/431045/ddhhs-annualreport1516.pdf (accessed 24 June 2017).
- World Health Organization, 2013, Review of evidence on health aspects of air pollution – REVIHAAP Project: final technical report. Available online at: http://www.euro.who.int/en/health-topics/environment-and-health/air-quality/publications/2013/review-of-evidence-on-health-aspects-of-air-pollution-revihaap-project-final-technical-report (accessed 24 June 2017).
- Guarnieri, M. and Balmes, J.R., 2014, Outdoor air pollution and asthma Lancet, 383, 1581–1592. doi:10.1016/S0140-6736(14)60617-6.
- Brook, R.D., Rajagopalan, S., Pope, C.A., Brook, J.R., Bhatnagar, A., Diez-Roux, A.V., Holguin, F., Hong, Y., Luepker, R.V., Mittleman, M.A., Peters, A., Siscovick, D., Smith, S.C Jr., Whitsel, L., and Kaufman, J.D, 2010, Particulate matter air pollution and cardiovascular disease: an update to the scientific statement from the American Heart Association. Circulation, 121(21), 2331–2378.10.1161/CIR.0b013e3181dbece1
- EPA, 2009, Integrated Science Assessment (ISA) for particulate matter (final report). Washington, DC: United States Environmental Protection Agency. Available online at: http://cfpub.epa.gov/ncea/cfm/recordisplay.cfm?deid=216546#Download (accessed 21 July 2017).
- IARC (International Agency for Research on Cancer), 2013, PRESS RELEASE No 221. Available online at: https://www.iarc.fr/en/media-centre/iarcnews/pdf/pr221_E.pdf (accessed 4 August 2017).
- Hime, N., Cowie, C., Marks, G., 2015, Review of the health impacts of emission sources, types and levels of particulate matter air pollution in ambient air in NSW Produced for the NSW Environment Protection Authority and NSW Ministry of Health, Environmental Health Branch. Available online at: http://www.carcre.org.au/images/content/Health%20impacts%20of%20PM%20report_final%20for%20web.pdf (accessed 4 August 2017).
- Queensland Government, 2011, Department of Employment, Economic Development and Innovation. Health effects of nitrogen oxides. Available online at: https://www.dnrm.qld.gov.au/__data/assets/pdf_file/0020/212483/2-health-effects-of-nitrogen-dioxide.pdf (accessed 4 August 2017).
- EPA, 2016, Basic information about NO2. United States Environmental Protection Agency. Available online at: https://www.epa.gov/no2-pollution/basic-information-about-no2 (accessed 2 July 2017).
- Kleinerman, J., 1997, Some effects of nitrogen dioxide on the lung. Federation Proceedings, 36(5), 1714–1718. PMID 844614. Available online at: http://europepmc.org/abstract/med/844614 (accessed 2 July 2017).
- Gauderman, W.J., Avol, E., Gilliland, F., Vora, H., Thomas, D., Berhane, K., McConnell, R., Kuenzli, N., Lurmann, F., Rappaport, E., Margolis, H., Bates, D., and Peters, J., 2004, The effect of air pollution on lung development from 10 to 18 years of age. New England Journal of Medicine, 351(11), 1057–1067.10.1056/NEJMoa040610
- Halonen, J.I., Lanki, T., Yli-Tuomi, T., Kulamala, M., Tittanen, P., and Pekkanen, J., 2008, Urban air pollution, and asthma and COPD hospital emergency room visits. Thorax, 63(7), 635–641.10.1136/thx.2007.091371
- EPA, 2008, Integrated science assessment for oxides of nitrogen – health criteria (final report) (Washington, DC: United States Environmental Protection Agency). Available online at: http://cfpub.epa.gov/ncea/cfm/recordisplay.cfm?deid=194645#Download. (accessed 2 July 2017).
- Raub, J.A., 1999, Health effects of exposure to ambient carbon monoxide. Chemosphere – Global Change Science, 1, 331–351.10.1016/S1465-9972(99)00005-7
- Brauer, M., Hoek, G., Smit, H.A., de Jongste, J.C., Gerritsen, J., Postma, D.S., Kerkhof, M., and Brunekreef, B., 2007, Air pollution and development of asthma, allergy and infections in a birth cohort. European Respiratory Journal, 29(5), 879–888.10.1183/09031936.00083406
- Karr, C.J., Lumley, T., Schreuder, A., Davis, R., Larson, T., Ritz, B., and Kaufman, J., 2007, Effects of subchronic and chronic exposure to ambient air pollutants on infant bronchiolitis. American Journal of Epidemiology, 165(5), 553–560.
- Brunekreef, B. and Forsberg, B., 2005, Epidemiological evidence of effects of coarse airborne particles on health. European Respiratory Journal, 26(2), 309–318.10.1183/09031936.05.00001805
- Lin, S., Liu, X., Le, L.H., and Hwang, S-A., 2008, Chronic exposure to ambient ozone and asthma hospital admissions among children. Environmental Health Perspectives, 116(12), 1725–1730.10.1289/ehp.11184
- Australian Government Department of the Environment and Energy, 2014, National pollutant inventory. Sulfur dioxide (Internet). Available online at: http://www.npi.gov.au/resource/sulfur-dioxide (accessed 5 June 2017).
- U.S. Department of Health and Human Services National Cancer Institute, 2011, Formaldehyde and cancer risk. Available online at: http://www.cancer.gov/about-cancer/causes-prevention/risk/substances/formaldehyde/formaldehyde-fact-sheet#q4 (accessed 5 June 2017).
- U.S. Department of Health and Human Services, 2016, National toxicology programme. Report on carcinogens fourteenth edition. Available online at: https://ntp.niehs.nih.gov/ntp/roc/content/profiles/formaldehyde.pdf (accessed 4 August 2017).
- McCarron, G., 2013, Symptomatology of a gas field (Internet). Available online at: http://www.ntn.org.au/wp/wp-content/uploads/2013/05/Symptomatology-of-a-gas-field-An-independent-health-survey-in-the-Tara-rural-residential-estates-and-environs-April-2013.pdf (accessed 26 July 2017).
- McCarron, G. and King, D., 2014, Unconventional natural gas development: economic salvation or looming public health disaster? ANZJPH, 38, 108–109. doi:10.1111/1753-6405.12196.
- Queensland Government Queensland Health DDPHU, 2013, Coal seam gas in the Tara region: Summary risk assessment of health complaints and environmental monitoring data. Appendix 1. Available online at: https://www.health.qld.gov.au/research-reports/reports/environmental-health (accessed 4 August 2017).
- University of Queensland. Centre for coal seam gas (Internet). Available online at: http://research.ccsg.uq.edu.au/projects/human-health-risk-assessment-developing-csg-water-resources-queensland (assessed 24 June 2017).
- Werner, A.K., Watt, K., Cameron, C.M., Vink, S., Page, A. and Jagais, P., 2016, All-age hospitalisation rates in coal seam gas areas in Queensland, Australia, 1995–2011. BMC Public Health, 16, 125. doi:10.1186/s12889-016-2787-5.
- Rasmussen, S.G., Ogburn, E.L., McCormack, M., Casey, J.A., Bandeen-Roche, K., Mercer, D., and Schwartz, B.S., 2016, Asthma exacerbations and unconventional natural gas development in the Marcellus Shale. JAMA Internal Medicine, 176(9), 1334–1343, 1 September. doi:10.1001/jamainternmed.2016.2436
- Jemielita, T., Gerton, G.L., Neidell, M., Chillrud, S., Yan, B., Stute, M., Howarth, M., Saberi, P., Fausti, N., Penning, T.M., Roy, J., Propert, K.J., and Panettieri, R.A., 2015, Unconventional gas and oil drilling is associated with increased hospital utilization rates. PLoS One, 10(8), e0137371. doi:10.1371/journal.pone.0137371.
- McKenzie, L.M., Guo, R.Z., Savitz, D.A., Newman, L.S. and Adgate, J.L., 2014, Birth outcomes and maternal residential proximity to natural gas development in rural Colorado. Environmental Health Perspectives, 122, 412–417. doi:10.1289/ehp.1306722.
- McKenzie, L.M., Allshouse, W.B., Byers, T.E., Bedrick, E.J., Berrin, S. and Adgate, J.L., 2017, Childhood hematologic cancer and residential proximity to oil and gas development. PLoS One, 12(2), e0170423. doi:10.1371/journal.pone.0170423.
- Stacy, S.L., Brink, L.A., Larkin, J.C., Sadovsky, Y., Goldstein, B.D., Pitt, B.R., and Talbott, E.O., 2015, Perinatal outcomes and unconventional natural gas operations in southwest Pennsylvania. PLoS One, 10, e0126425. doi:10.1371/journal.pone.0126425.
- Busby, C. and Mangano, J.J., 2017, There’s a world going on underground – Infant mortality and fracking in Pennsylvania. Journal of Environmental Protection, 8, 381–393. doi:10.4236/jep.2017.84028.
- Edwards, P.M., Brown, S.S., Roberts, J.M., Ahmadov, R., Banta, R.M., deGouw, J.A., Dube, W.P., Field, R.A., Flynn, J.H., Gilman, J.B., Graus, M., Helmig, D., Koss, A., Langford, A.O., Lefer, B.L., Lerner, B.M., Li, R., Li, S-M., McKeen, S.A., Murphy, S.M., Parrish, D.D., Senff, C.J., Soltis, J., Stutz, J., Sweeney, C., Thompson, C.R., Trainer, M.K., Tsai, C., Veres, P.R., Washenflelder, R.A., Warneke, C., Wild, R.J., Young, C.J., Yuan, B., and Zamora, R., 2014, High winter ozone pollution from carbonyl photolysis in an oil and gas basin. Nature, 514(7522), 351–354. doi:10.1038/nature13767.
- McDuffie, E.E., Edwards, P.M., Gilman, J.B., Lerner, B.M., Dube, W.P., Trainer, M., Wolfe, D.E., Angevine, W.M., deGouw, J., Williams, E.J., Telvin, A.G., Murphy, J.G., Fischer, E.V., McKeen, S., Ryerson, T.B., Peischi, J., Holloway, J.S., Aikin, K., Langford, A.O., Senff, C.J., Alvarez, R.J., Hall, S.R., Ullmann, K., Lantz, K.O., and Brown, S.S., 2016, Influence of oil and gas emissions on summertime ozone in the Colorado Northern Front Range. Journal of Geophysical Research: Atmospheres., 6, 8–9. doi:10.1002/2016JD025265.
- Vinciguerra, T., Yao, S., Dadzie, J., Chittams, A., Deskins, T., Ehrman, S., and Dickerson, R.R., 2015, Regional air quality impacts of hydraulic fracturing and shale natural gas activities: evidence from ambient VOC observations. Atmospheric Environment, 110, 144–150. doi:10.1016/j.atmosenv.2015.03.056.
- Australian Medical Association, 2013, Webpage. Available online at: https://ama.com.au/ausmed/if-doubt-turn-csg-ama (accessed 30 June 2017).
- Queensland Government Queensland Health, 2013, Coal seam gas in the Tara region: Summary risk assessment of health complaints and environmental monitoring data. Available online at: https://www.health.qld.gov.au/research-reports/reports/environmental-health (accessed 4 August 2017).
- Right To Information Documents. 2013/2014. Available online at: http://www.lockthegate.org.au/further_reading (accessed 26 July 2017).
- Australian Government Department of the Environment and Energy. National Pollutant Inventory (Internet). Available online at: http://www.npi.gov.au/about-npi (accessed 24 June 2017).
- Queensland Government. Statistician’s office (Internet). Available online at: http://www.qgso.qld.gov.au/products/tables/erp-lga-qld/index.php?region=mackay (accessed 24 June 2017).
- Strnisa, D., 2017, Dilution (internet). Available online at: http://www.pollutionissues.com/Co-Ea/Dilution.html (accessed 21 July 2017).
- Australian Government. Department of the Environment and Energy. Air quality standards (Internet). Available online at: http://www.environment.gov.au/protection/air-quality/air-quality-standards (accessed 15 July 2017).
- Queensland Government. Air monitoring network (Internet). Available online at: https://www.qld.gov.au/environment/pollution/monitoring/air-monitoring/swq/ (accessed 4 August 2017).
- Australian Senate Select Committee on Unconventional Gas Mining Interim Report 2016. submission 275. Available online at: http://www.aph.gov.au/Parliamentary_Business/Committees/Senate/Gasmining/Gasmining/Interim_Report (accessed 15 July 2017).
- Doctors for the Environment Australia, 2016, Policy. Air pollution (Internet). Available online at: https://www.dea.org.au/images/general/DEA_Policy_-_Air_Pollution_v12-16.pdf (accessed 8 July 2017).
- Drinkwater RT, 2015, Understanding environmental risks associated with unconventional gas development in Australia. Australian Senate Select Committee on Unconventional Gas Submissions. Submission 45. Attachment 2. Available online at: http://www.aph.gov.au/Parliamentary_Business/Committees/Senate/Gasmining/Gasmining/Submissions
- Zeliger, H., 2004, Unexplained cancer clusters: common threads. Archives of Environmental Health, 59(4), 172–176.10.3200/AEOH.59.4.172-176
- Grandjean, P. and Landrigan, P.J., 2014, Neurobehavioural effects of developmental toxicity. The Lancet Neurology, 13, 330–338. doi:10.1016/S1474-4422(13)70278-3.
- Brown, D.R., Lewis, C. and Weinberger, B.I., 2015, Human exposure to unconventional natural gas development: a public health demonstration of periodic high exposure to chemical mixtures in ambient air. Journal of Environmental Science and Health, Part A: Toxic/Hazardous Substances and Environmental Engineering, 50(5), 460–472. doi:10.1080/10934529.2015.992663.
- Allen, J. 2002, The ozone we breathe. NASA Earth Observatory, featured articles. Available online at: https://earthobservatory.nasa.gov/Features/OzoneWeBreathe/ (accessed 4 August 2017).
- Australian Government Environmental Health Risk Assessment Guidelines for assessing human health from environmental hazards, 2012. Available online at: http://www.eh.org.au/documents/item/916 (accessed 4 August 2017).