
 ?Mathematical formulae have been encoded as MathML and are displayed in this HTML version using MathJax in order to improve their display. Uncheck the box to turn MathJax off. This feature requires Javascript. Click on a formula to zoom.
Abstract
Integrating a broad range of information types and finding trade-offs between conflicting goals is a challenge in global supply chain network design (GSCND). Effective decision support systems (DSS) should be user-friendly, provide transparency, and support human judgement. There is a wide range of optimisation models that aim to improve the outcome of network design decisions. However, their practical performance often remains unknown, as their implementation into the managerial decision process is largely neglected. Such theory-driven models usually focus on single aspects of the decision, without being able to accommodate the practical problem comprehensively. We employ the CIMO approach to resolve the issue and contribute by showing how an integration involving these methods can be useful for managers once the proper knowledge transfer has been effectuated. An innovative decision support framework, which combines mixed-integer linear programming, the Analytical Hierarchy Process, and the Pareto front is created and analysed during a case study in the med-tech industry. Results show that the framework accommodates managerial experience, integrates qualitative as well as quantitative criteria, and provides transparency over the entire range of efficient solutions. The framework and application results contribute towards the development of more flexible and easy-to-use decision support systems for GSCND.
1. Introduction and problem statement
Today’s economy is characterised by global supply chain networks that compete against each other (Christopher Citation2000). Exports accounted for 30% of global GDP in 2019 (World Bank Citation2020) and for almost 50% of GDP in advanced European economies (Lund et al. Citation2019). Global supply chain network design (GSCND) is derived from business strategy and environmental constraints (Melnyk, Narasimhan, and DeCampos Citation2014). It provides the framework for tactical and operational considerations (Meixell and Gargeya Citation2005; Meyr, Wagner, and Rohde Citation2015). It represents a complex managerial decision problem as decision-makers are required to deal with a high level of structural, as well as environmental complexity (Cohen and Lee Citation2020; MacCarthy and Atthirawong Citation2003). Structural complexity is driven by decision parameters related to facilities and transportation nodes and does not directly depend on whether a network is global or local. Environmental complexity however is driven by macro-institutional and infrastructural diversity – factors such as political stability and legislation are much more relevant in global supply networks than in domestic ones (Ivanov et al. Citation2015; Kinra and Kotzab Citation2008a). GSCND decisions usually require estimations and assumptions and are characterised by a planning horizon of several years, as well as by high uncertainty, especially regarding external factors (Vidal and Goetschalckx Citation1997), such as political risk (Hansen, Mena, and Skipworth Citation2017) or public safety (Tukamuhabwa et al. Citation2015). A survey by McKinsey & Company found that supply chain managers expect environmental complexity to increase in the future. They consider themselves poorly prepared for this, mainly due to a lack of data, as well as a disconnect between information and decision-making (Gyorey, Jochim, and Norton Citation2010).
Operations Management (OM) and Decision Support Systems (DSS) literature provide optimisation models to support GSCND. However, implementation into the managerial decision process is neglected (Meixell and Gargeya Citation2005; Olhager, Pashaei, and Sternberg Citation2015). Thus, their performance in practice, and how they aid to manage complexity in global supply chain decision-making, often remains unknown. The purpose of this study is to contribute towards developing a more effective and user-friendly decision analysis for GSCND. We employ the Context-Intervention-Mechanism-Outcome (CIMO) methodology (Denyer, Tranfield, and van Aken Citation2008) to understand the GSCND problem from a practitioner’s perspective, apply a solution to the relevant field problem, and therefore generate prescriptive, instrumental knowledge for better managerial decision-making.
Our research is motivated by the case of a multinational market leader in the med-tech industry. We helped redesign the company’s highly complex, poorly performing international distribution network. The decision involved selecting and locating distribution centres, as well as allocating inbound and outbound product flows. We devised the following research question together with the case company: How can managers be supported to better understand and solve complex global supply chain network design problems characterised by a large range of qualitative and quantitative data and trade-offs between conflicting goals?
We contribute to literature on hybrid AHP-MILP approaches (Irawan et al. Citation2018; Validi, Bhattacharya, and Byrne Citation2014) by showing that for optimisation methods from OM to be successfully implemented in practice, application-oriented specifications from the DSS domain (Power, Burstein, and Sharda Citation2011) should be considered in the solution design for the GSCND problem. Our findings show that managers benefited from utilising optimisation methods from OM in the way these were integrated by our novel decision support framework, which combines mixed-integer linear programming (MILP), the Analytical Hierarchy Process (AHP) and the Pareto front in an innovative way. Contrary to almost all existing literature, this study also describes how to deploy the managerial processes and routines as well as the corresponding know-how – from specification definition, over solution development, to implementation and testing.
The paper is structured as follows: the next section investigates literature on decision support for GSCND and identifies current issues and research needs. We lay out the methodology in section 3. Section 4 explains the development and application of the solution framework following the CIMO-logic. It begins by establishing an understanding of the problem and deriving specifications for an effective solution from both a theoretical and an empirical perspective. Based on these specifications a solution framework is designed, implemented, and tested. Section 5 discusses the theoretical and managerial implications of the research project, as well as its limitations, and points out avenues for future research. Section 6 concludes the paper.
2. State of the field
2.1. Global supply chain network design and decision support requirements
Supply chain network design is a decision problem encompassing the location of facilities, selection of transportation arches and modes, as well as allocation of capacity, considering multiple products, components, suppliers, and markets (Chopra and Meindl Citation2016). GSCND extends the scope of this decision to locations across the world, requiring decision-makers to consider additional environmental complexity factors (Kinra and Kotzab Citation2008a, Citation2008b).
Several reviews about GSCND methods have been published. Vidal and Goetschalckx (Citation1997) find that most tools are based on MILP. GSCND problems with their many quantitative and qualitative parameters are difficult to integrate into a standalone MILP. The authors suggest developing tools that consist of interrelated sub-models, each focusing on a specific set of factors – with MILP at their foundation. Schmidt and Wilhelm (Citation2000) point out that integrating all relevant factors into one process improves the outcome. The authors suggest research to combine qualitative information with mathematical programming. Meixell and Gargeya (Citation2005) find that while there exist sophisticated methods for most issues, there is no approach that covers the entire problem. More models are required that focus on multiple, conflicting goals and encompass a broader range of criteria. Mangiaracina, Song, and Perego (Citation2015) confirm the dominance of quantitative cost minimisation. They criticise that few models allow weighting criteria and factors. Most neither evaluate qualitative information. The authors suggest developing tools that integrate quantitative with qualitative factors. According to Olhager, Pashaei, and Sternberg (Citation2015) the challenge lies in tailoring models to specific problems. Mathematical models should be enhanced by qualitative parameters. More case studies are needed to merge structural issues with the ‘human factor’.
All reviews note that GSCND problems are characterised by heterogeneous data types describing environmental complexity. They stress the need to integrate qualitative information with quantitative optimisation models. In practice, however, managers tend to base their global design decisions on monetary considerations (Lampón, Lago-Peñas, and González-Benito Citation2015). In contrast, qualitative criteria are often ignored, even though they have been found to be usually more important to the outcome of GSCND decisions than quantitative ones (Kinkel and Maloca Citation2009), leading to costly mistakes, as described by the phenomenon of ‘reshoring’ (Srai and Ané Citation2016).
These issues imply that DSS for GSCND should evolve from single-target monetary optimisation towards calculating a range of efficient trade-offs with additional targets, such as quality (Flynn and Flynn Citation2005), resilience (Dolgui, Ivanov, and Sokolov Citation2018), reliability (Yildiz et al. Citation2016) and sustainability (Bhattacharya, Dey, and Ho Citation2015). To achieve this, quantitative optimisation such as MILP must be complemented with other methods that can handle diverse types of data. The AHP (Saaty Citation1980) is flexible to incorporate and process qualitative information, which makes it especially useful in assessing environmental complexity (Kinra and Kotzab Citation2008a). As AHP yields quantitative preference scores on a relative scale, it can be combined with quantitative optimisation models. MILP-AHP hybrids can potentially model complex distribution networks based on both quantitative and qualitative parameters. The next section gives an overview of such approaches in literature.
2.2. Existing hybrid MILP-AHP supply chain design methods
Ghodsypour and O’Brien (Citation1998) and Korpela, Lehmusvaara, and Tuominen (Citation2001) utilise MILP to design networks based on optimising AHP scores. AHP is used to assess supplier performance (Ghodsypour and O’Brien Citation1998) or preferences of clients and their utility to the focal company (Korpela, Lehmusvaara, and Tuominen Citation2001). A MILP target function designs the network under constraints to ensure the firm sources as much as possible from the best suppliers and sells to the most attractive customers. These two models are more flexible than standalone AHPs, as the MILP considers interdependencies and constraints. The downside is that all factors are represented by a dimensionless preference score in a zero to one interval.
Badri (Citation1999) developed a multi-objective model that uses results of an AHP as partial input for a MILP. It aims to find the best trade-off between cost and environmental factors. Using AHP scores as input, the MILP minimises the sum of deviations of all objective values from pre-defined target values. Badri’s (Citation1999) multi-objective model allows quantitative data to remain on its original scale while using the AHP scale for qualitative data. It calculates a trade-off between the two conflicting goals. However, the two different goals must be weighted against each other in the target function. The user needs to anticipate what weights will lead to the best trade-off before seeing a solution.
Ozgen and Gulsun (Citation2014) solve a multi-objective location problem by minimising the sum of relative distances between the best and worst possible outcomes for each objective. The outcome is measured in the interval of zero to one. However, normalising targets to an interval from worst to best, implies that 0.1 from the optimum and 0.9 from the worst is equally desirable for both. Such an assumption is questionable. The worst outcome might be perceived only as marginally worse than the optimum, or it might be infinite times worse.
Validi, Bhattacharya, and Byrne (Citation2014) combine MILP with AHP through a Pareto front to solve an operational distribution network design problem by selecting vehicles and routes. AHP is used to determine managerial preferences regarding vehicle types. A MILP then calculates alternative distribution network designs as trade-offs between emission and cost, displayed on a Pareto front. AHP is used to weigh the two conflicting goals, which themselves only consist of quantitative factors – cost and CO2 emission. The model is based on data from the Irish dairy industry, however, there is no implementation into the managerial decision process.
Irawan et al. (Citation2018) propose a model to select ports for offshore windfarms and design the distribution system for components. Ports are pre-selected by AHP. Subsequently, component flows are determined by linear programming. The paper uses real-life data but does not describe how the model was adopted by managers.
A common missing feature in existing research is that the practical implementation of the GSCND models is not demonstrated. While existing contributions revolve around the decision outcome, behavioural aspects, such as the effect on the managerial decision-process, are not described. It is assumed that the decision-maker is rational and possessing certain knowledge and skills, which in turn should translate into smooth implementation. This is an issue across supply chain network design literature. While design principles are well-researched, the decision-making process within organisations has been neglected (Asmussen, Kristensen, and Wæhrens Citation2018).
The literature presented above indicates that a combination of AHP and MILP can be helpful for solving GSCND problems. However, there are limitations to the practical effectiveness of existing models. To answer our research question, we deployed a solution framework involving the methods presented above in the context of a practical example, following the CIMO paradigm described below. The solution framework takes the above-mentioned limitations into consideration when combining the AHP, MILP, and the Pareto front in an innovative way. Table below summarises such limitations, as well as the features of this paper.
Table 1. Review of hybrid AHP-MILP approaches.
3. Methodology
3.1. CIMO-logic
We apply the CIMO-logic approach (Denyer, Tranfield, and van Aken Citation2008), which is also described in the related framework of design science research (DSR) [Van Aken Citation2007; Van Aken, Chandrasekaran, and Halman Citation2016; Holmström, Ketokivi, and Hameri Citation2009], to develop a new body of prescriptive knowledge for designing supply chain networks and demonstrate its usefulness in a practical case. In the next section, we start with the problem in-Context (the C in CIMO), which is the under-performance of the existing supply chain network and inadequacy of the managerial processes and routines to address it. We proceed to present the Intervention (I) by the scientific team counselling the managers, which is the design of the decision support framework combining three scientific methods. We subsequently develop a Mechanism (M) to support managers in their decision-making process concerning the transformation of the supply chain network, followed by describing the Outcome (O): the observable improvement of the decision process. Note that the emphasis here is on knowledge transfer and process transformation rather than the efficiencies achieved through the application of the scientific methods. Examples of similar papers in OM with practical applications and structure can be found in Brusset and Bertrand (Citation2018) and Kinra et al. (Citation2020).
3.2. Data
To understand the problem and solution requirements from the case company’s perspective, several interviews and workshops were conducted. Information describing product specifications, production quantities, sales, inventory capacities, handling processes, shipping fees, and transit times were collected and analysed to understand the network in detail. In close cooperation with analysts and experts from the case company, data from diverse sources was compiled and integrated, including internal IT systems for sales and accounting as well as from external providers. Transparency about product flows, costs, and capacity requirements was established, that was not available before. The company previously had no holistic visibility over the number, utilisation, and cost of distribution points. To understand the facilities, external data on the environment was collected, and interviews with experts were conducted. Interviewees included senior managers, internal consultants, and facility directors. An overview of the data is presented in Table below.
Table 2. Overview of data.
Following the CIMO-logic, the solution was validated and generalised as described by O’Keefe (Citation2014). Design specifications were derived from the relevant literature. The utility and validity of the presented approach were evaluated by constructing and testing the solution together with the problem owner and analysing the intervention. To validate and generalise the specifications and the usefulness of the solution framework in other contexts, interviews with five top managers in the supply chain areas of multinational companies from diverse industries were conducted. An overview of the interviews is presented in Table below.
Table 3. Overview of interviews outside the case company.
4. Deploying CIMO-logic and ensuing results
4.1. Context
After acquiring several competitors, the case company became the global market leader in its sector. It manufactures medical devices and consumables, including perishable and hazardous products, in factories across the world. Products are transported to distribution facilities and forwarded to customers. Some facilities are operated internally, others are outsourced. The company was recently acquired by an industrial conglomerate. Benchmarks showed that it had the worst-performing logistics network of all subsidiaries. Shipping and inventory were expensive, on-time delivery rates were low. Inventory was widespread, causing low on-site availability rates and high stock-keeping costs. Both fixed and variable costs were too high, also because small facilities sent out large numbers of small shipments. Unit availability and delivery times had to be improved, while at the same time costs had to be decreased. The problem was therefore characterised by multiple, potentially conflicting goals. Communication and flexibility were poor and know-how and technical capabilities were widely dispersed. There was friction with external providers. Management had little visibility over the network and severe difficulties in implementing processes and quality measures. Labour performance, infrastructure, and the macro-environment differed across facilities. Such factors could not be solely measured by quantitative data. The company was facing a GSCND problem characterised by high complexity, conflicting goals, and a wide range of quantitative and qualitative factors.
Based on semi-structured interviews with managers, as well as on internal analyses, reasons for the poor performance were uncovered. Low priority was given to supply chain management (SCM). The function only served as an enabler for the sales department. Decisions were made by local units focused on short-term local business opportunities, rather than on an efficient overall network. Implications for the system were not considered, cross-border synergy potential was neglected. The organisation lacked the means to deal with these challenges, resulting in a complex and poorly performing distribution network. Management had no clear structure to design the distribution network but used various tools, analyses, and committees, generating inconsistent and heterogeneous results. Data was of poor quality and widely dispersed. Information systems lacked analysis and optimisation capabilities. To improve the company’s decision process as well as the outcome, more sophisticated tools were needed that provide analytical capabilities, but at the same time remain transparent and usable.
4.2. Intervention
4.2.1. Design requirements from the case study
As part of the new leadership’s supply chain vision, our role was to build and implement a decision support procedure based on scientific methods, to re-design the European distribution network. The goal was to create a system in close alignment with the company that could be handed over and used after our involvement.
The main requirement from the company was for the framework being able to model their complex distribution network. It must accommodate all relevant quantitative information, such as demand, capacity, freight cost, processing cost, and delivery times. However, it was crucial to the case company that it also includes qualitative data about operational quality within the facilities as well as the surrounding environmental complexity (Kinra and Kotzab Citation2008b). To emphasise, one manager specifically explained their negative experience of a prior centralisation project, where decisions were based on quantitative information alone, while regional environmental differences and complexities were ignored. It was equally important to managers that the solution framework allows collaboration and discussion. It should help stakeholders understand their problems by providing visualisation. Because knowledge was widely dispersed, input from different experts had to be accommodated in a transparent manner. Lastly, it was important for managers to make the decision themselves, leveraging their experience and expertise. They preferred an approach that generates a range of clearly specified options, rather than a single solution.
4.2.2. Design specification and empirical justification
Our design specifications are made in accordance with considerations in OM and DSS. Both domains look at the same problem from different angles. OM has a modelling focus and provides insight on how to represent a real-life problem as closely as possible and provide an optimum solution. Tools should integrate qualitative and quantitative data to ensure that all relevant factors can be considered. They also should be multi-objective to provide trade-offs between conflicting goals. All factors and goals should be structured and integrated into a single process to consider interdependencies.
Researchers in DSS on the other hand put greater emphasis on the application. They provide insight on interfaces between tools and managers, as well as on how researchers should execute the application. Managers should be closely involved in the process. Results should be visualised to make them understandable. Researchers must ensure that there is room for discussion and human reasoning, that all relevant experts can contribute, and that the final decision is made by the managers themselves (Power, Burstein, and Sharda Citation2011).
To establish a broader empirical picture, we interviewed several supply chain executives. Their responses confirmed the three main challenges of GSCND, namely the high complexity of networks, heterogeneous data types, and conflicting goals. Subsequently, we inquired how their ideal tool for GSCND would look like.
A summary of design specifications from OM and DSS literature, as well as sample quotes from managers that validate these can be found in Table . These will serve as the theoretical underpinning for the development of the solution framework that is presented in the next section.
Table 4. Design specifications from OM and DSS.
4.3. Mechanism
4.3.1. Choice of methods
Our solution framework is comprised of three well-established methods combined and applied in an innovative way to suffice the design requirements stated above. The framework is based on a cost-minimising MILP, supplemented by an AHP. Results are visualised on a Pareto front as trade-offs between conflicting goals.
MILP serves as the base of the framework because it allows managing structural complexity by precisely modelling large distribution networks based on all relevant quantitative parameters.
AHP on the other hand was chosen for its suitability to manage environmental complexity (Kinra and Kotzab Citation2008a, Citation2008b). The AHP can accommodate qualitative as well as quantitative data, by translating verbal preference judgments into a numerical scale. Because of pairwise comparison as its underlying technique, AHP produces a quantitative preference score on a relative scale – contrary to simpler techniques, such as the Weighted Score method. This means that an AHP score of 0.4 is exactly twice as preferable as a score of 0.2. This makes AHP scores excellent input for mathematical programming methods, such as MILP.
While factors and criteria are infinite, AHP limits the number of decision alternatives to nine. Saaty (Citation1980) follows the theory of Miller (Citation1956), who defined a limit of seven pieces of information, ‘plus or minus two’, that humans can process simultaneously. This limit also applies to the range of comparison between the alternatives, rated on a nine-point scale which means that an item can be preferable by a factor of up to nine than another, but not greater. This is an artificial limitation based on the notion that the human brain cannot compare stimuli which differ too much (Saaty Citation2013). Promethee-I, another popular pairwise comparison-based method, avoids this limitation by using preference functions for all criteria. However, Promethee-I does not provide structure to the problem and is difficult to explain and replicate by non-specialists (Macharis et al. Citation2004). Contrary to Promethee-I and importantly for our case study, AHP is simple and easy to use for managers (Chan et al. Citation2008). AHP, therefore, satisfies the design specifications from both OM and DSS literature, as it provides flexibility as well as usability to the solution framework.
The AHP and MILP are integrated following the suggestion of Klose and Drexl (Citation2005) by using cost minimisation as the primary goal and other objectives as soft constraints, which are relaxed to generate alternative solutions. Trade-offs between goals are shown on a Pareto front, where all points are non-dominated compromises between targets (Pareto Citation1906). This allows us to integrate two methods to execute a multi-objective optimisation for a complex problem, one of our model-focused design considerations. Simultaneously it satisfies our application-focused considerations by providing clear visualisation to stakeholders. The Pareto front serves as a basis for discussing the range of efficient network configurations and eventually selecting the preferred solution.
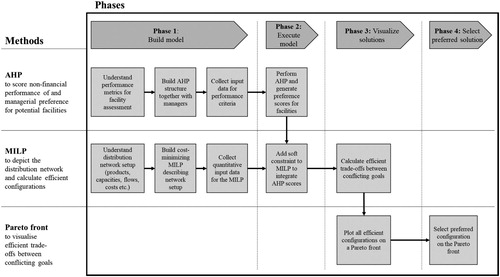
Figure summarises our solution approach, including the way the methods were applied.
Figure 1. Solution approach – step-by-step.
4.3.2. Model formulation
We begin with formulating the MILP. Terms 1–10 below describe a three-tier distribution network where multiple product types are transported via different routes and modes from factories to distribution centres (DCs), and from DCs to customers. The target function minimises the cost of the network.
(1)
(1) The first summand describes the total variable cost for shipping products from factories to DCs. Quantity S shipped of products p from factories f to DCs d via mode m is multiplied by the weights WT of products p, multiplied by variable cost VCSF of shipping one weight unit from factories f to DCs d, multiplied by the price factor ZP for shipping mode m. ZP describes how much more expensive alternative shipping modes are to the cheapest mode – in this case, air shipment versus ocean freight. Variable shipping cost includes rates of logistics providers, tariffs as well as possible additional costs. The term is summed up for all factories, DCs, products, and shipping modes. Summand two describes the total variable cost of shipping products from DCs to customers, similar to the previous term describing shipping from factories to DCs. Summand three describes the sum of fixed cost FIX for each DC d, including wages, maintenance, depreciation, and taxes, incurred by opening the facility. Summand four describes the handling cost of products in DCs. Quantity S of products p arriving in DCs d from factories f via modes m is multiplied by the variable handling cost VCH per unit of product p. This is summed up for all factories, DCs, and products.
There are three decision variables: S (p, f, d, m) determines quantity S of product p shipped from factory f to DC d via mode m. S (p, d, c, m) determines quantity S of product p shipped from DC d to customer c via mode m. Y (d) is a binary variable determining whether to use DC d.
(2)
(2)
(3)
(3)
(4)
(4)
(5)
(5)
(6)
(6)
(7)
(7)
(8)
(8)
(9)
(9)
(10)
(10)
Constraint (2) regulates that DC d can only be used when its binary constraint Y is set to one. ‘M’ represents a very large number that ensures the left part of the equation is below zero if Y is set to one. Constraint (3) ensures all production X of product p in factory f is shipped out to any of the DCs d using any of the modes m. Constraint (4) ensures the total weight of products p coming from any factory f does not exceed maximum capacity K of DC d. Constraint (5) requires that all products p shipped from factories f via mode m to a DC d must be shipped out of DC d to customer regions c. Constraint (6) requires quantity S of product p to customer region c coming from DCs d to equal demand R for product p in customer region c. Optional constraint (7) requires the sum of weighted average transit times for a product p between factory f and DC d and between DC d and customer c not to be higher than the desired transit time. Constraints (8) and (9) require variables S to be positive integers. Constraint (10) requires variable Y to be binary.
Quantitative factors regarding cost and delivery time are covered by the MILP presented above. However, other crucial aspects are qualitative and must be assessed differently. We use the AHP where location decision criteria are hierarchically structured. All alternatives, in this case, the potential distribution centres, are compared against each other in terms of performance regarding each criterion.
AHP criteria can be defined in cooperation with experts from the case company, following the considerations laid down by Saaty (Citation1980). The pairwise comparison in the AHP yields preference factors for each decision alternative. The AHP is integrated by adding a soft constraint (11) to the MILP which requires the network to yield a minimum overall AHP score weighted by throughput. Quantities shipped to open DCs are multiplied by the AHP score of respective DCs and divided by the sum of all items. The more product flows through the preferred facilities, the higher the overall score.
(11)
(11) To create the Pareto front, the user starts with the initial result without the AHP constraint. The AHP constraint is then introduced and its lower bound gradually increased. All combinations together form the Pareto front. An alternative approach to potentially decrease computation effort would be to integrate the AHP as a second objective function into the optimisation. The multi-objective linear programme would then calculate the entire Pareto front at once.
4.3.3. Application
After collecting the data described earlier, we proceeded to build the cost-minimising MILP using MS Excel. As the model was too complex for the built-in solver, we used two more powerful solvers: Gurobi and COIN-CBC.
The second step was to lay out and execute the AHP. Beforehand, management pre-selected seven DCs as possible candidates for the future setup. Pre-selection was done purely on size, as the company’s overall strategy was to concentrate distribution in fewer, larger facilities. Because the number of decision alternatives was not larger than nine, AHP could be used for both structuring the decision problem, as well as for assessing the alternatives. Had there been more than nine candidates, it would have been still possible for AHP to structure the decision, but another method not based on pairwise comparison, such as Weighted Scoring, would subsequently have been used to rate the alternatives.
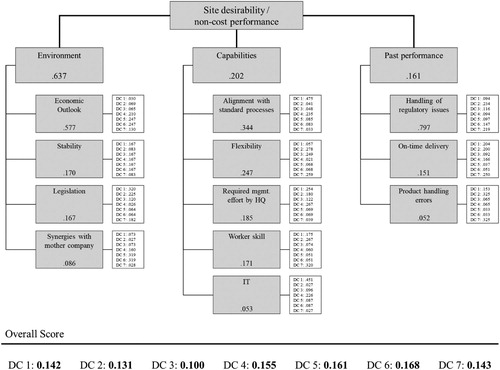
A workshop with management was conducted to define and structure AHP criteria describing non-financial performance and environmental complexity. Three first-level categories were defined: ‘Past Performance’, ‘Current Capabilities’ and ‘Environment’. Each had between three and five subcategories. Pairwise comparisons between all categories and subcategories were conducted to derive importance weights. Interestingly, managers considered the ‘environment’ criterion significantly more important than the other two main criteria, ‘capabilities’ and ‘past performance’. This confirms the importance of environmental complexity for the company’s decision problem and the use of AHP as part of the solution, as it can provide structure to an ill-structured problem and process qualitative data, both which are important for design problems characterised by high environmental complexity (Kinra and Kotzab Citation2008b).
After the AHP structure was ready, the decision alternatives had to be rated according to the defined criteria. The necessary knowledge was dispersed to such a high degree that a group AHP (Dyer and Forman Citation1992) was infeasible. Instead, data regarding the facilities collected earlier from IT systems and expert interviews was coded and compiled in a two-dimensional matrix, which summarised all information describing each facility along each sub-criterion of the AHP. The information matrix was presented to managers for review and discussion. Based on this, pairwise comparisons between all decision alternatives within all sub-criteria were conducted, producing scores that were aggregated into an overall preference score for each potential location. For executing the AHP we used the software ‘PriEsT’ (Siraj, Mikhailov, and Keane Citation2015). The AHP is visualised in Figure .
Figure 2. The AHP in the case application.
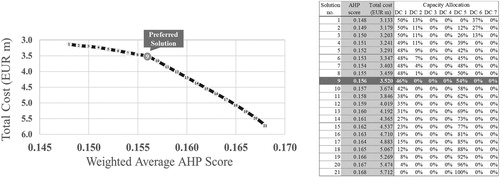
Subsequently, the AHP results were integrated into constraint (11) of the MILP, as described in the previous section. Now all variables could be solved, including seven variables Y (d) for selecting locations and 1,365 variables S (p,f,d,m) and S (p,d,c,m) for determining flows of all product types and shipping modes from factories to DCs and from DCs to customer regions. By gradually relaxing constraint (11), all efficient network configurations were calculated, creating the Pareto front as depicted in Figure .
Figure 3. The Pareto front in the case application.
4.3.4. Results from the solution approach application
The cheapest network under the given constraints costs 3.1 m EUR per year and yields a weighted AHP score of .148. It spreads the capacity over three distribution centres. The following two configurations on the Pareto front with AHP scores of .149 and .150 include a fourth facility. The network with the maximum weighted facility preference score of .168 costs 5.7 m EUR per year. In this configuration, all capacity is routed through the highest-scoring facility. We calculated a total of 21 network configurations, each representing a 0.01 interval in the efficient range of weighted AHP scores. Using a normal desktop computer, each solution took an average of 34 s to calculate with the COIN-CBC solver and 115 s with the Gurobi solver, using a branch-and-bound tolerance of 0.5%. Both solvers delivered identical results.
4.4. Outcome
The Pareto front provided transparency over the interplay between cost and performance. Managers could visualise trade-offs, change assumptions and calculations, discuss alternatives, and eventually select the design best suited to their strategy. The curve becomes steeper at the cost versus score combination of 3.5 m and .156, implying rising marginal cost for additional performance. The solution preferred by management was at this point. It represented a configuration where capacity was spread almost evenly between two large facilities – both located close to production sites in Western Europe. Once they were presented with the Pareto front and data depicting product flow for each of the 21 efficient configurations, managers required no further decision support to select a final solution. If requested, we could have conducted one or multiple AHPs to help select the preferred configuration on the Pareto front.
The problem owners received the framework positively as a method to structure information and create a set of options and expected outcomes. Table below summarises their feedback, as well as how the solution fulfils the design requirements and specifications. Managerial experience was accommodated by constructing and applying the solution in close cooperation. From the beginning, it was crucial to generate a common understanding of how processual and technical deficiencies led to poor decision-making in GSCND. The application demonstrated the benefits of good data and analytical capabilities and helped define action items to become a ‘data-strong’ organisation. The initial step taken by the company to ensure long-term implementation was to hire a data analytics specialist whom the researchers trained to take over the tool.
Table 5. Summary of case study feedback.
Following the CIMO-logic, the training and hand-over of the solution was the final phase of the researchers’ involvement with the company. It was conducted in several sessions. The analyst was introduced to the logic of the MILP and AHP and extensively trained in the use of the Excel-based calculation sheets and solvers, as well as the AHP tool. The analyst was also instructed to calculate the Pareto front and to interpret its results. Furthermore, the analyst was trained to conduct sensitivity analyses and consistency checks. After the solution was tested and implemented in the field, the final phase following the CIMO-logic is to generalise and discuss the intervention, which is done in the following section.
5. Discussion
Researchers note the lacking managerial acceptance of scientific decision support methods (Power, Burstein, and Sharda Citation2011). Our intervention-oriented research showed that managers can benefit from utilising design methods from theory as these can provide structure and objectivity. The data collected during the intervention (Tables and ) as well as from interviews with managers outside the case company (Table ), confirms that application-oriented specifications are as important to the successful implementation of GSCND decision analysis as model-focused specifications (Table ). First, decision support experts must work closely with managers to explain the underlying techniques and cooperate with them in tailoring the tools to the specific problems of their companies (Courtney Citation2007; Land Citation2008). Second, the results should be visualised to facilitate discussions (Wagner Citation2007; Watson Citation2007). Lastly, the final solution must be selected by experienced managers to ensure acceptance by stakeholders and commitment to its implementation (Land Citation2008; McCosh Citation2007). This study did so by employing the CIMO-logic (Denyer, Tranfield, and van Aken Citation2008) to develop and test within a practical context how prescriptive knowledge derived from theory can be successfully transferred to managers as practical knowledge.
Several managerial implications can be derived from our in-depth analysis of the case company. Firms facing a high degree of both environmental and structural complexity need a holistic view of their networks that includes all interdependencies. A strong SCM function should manage the network, continuously monitor its performance, and lead the decision-making and design process. Data provides transparency, but it is only useful in conjunction with information and decision support systems that combine analytical capability and usability (Gyorey, Jochim, and Norton Citation2010). These aspects were lacking and have been improved by our intervention.
The paper also adds to theory by contributing to the research issues and design requirements from OM, described in Section 2.1 and Table . Our solution considers conflicting objectives (Meixell and Gargeya Citation2005), processes unstructured and qualitative data (Mangiaracina, Song, and Perego Citation2015), and integrates all interdependencies into a single decision process (Schmidt and Wilhelm Citation2000) while being relatively simple to understand and apply. While most SCM research focuses on individual operational problems, the framework presented in this paper supports strategic decisions at the group level (Schorsch, Wallenburg, and Wieland Citation2017), by providing visibility for senior management to support long-term navigation of structural and environmental complexity in GSCND.
Table visualises how the solution is different from existing hybrid approaches that combine AHP with MILP. While there exist AHP-MILP hybrids that assess global environmental complexity (Badri Citation1999) and visualise trade-offs (Validi, Bhattacharya, and Byrne Citation2014), none of the papers combine both capabilities. Furthermore, contrary to existing AHP-MILP hybrid approaches (Badri Citation1999; Ghodsypour and O’Brien Citation1998; Irawan et al. Citation2018; Korpela, Lehmusvaara, and Tuominen Citation2001; Ozgen and Gulsun Citation2014; Validi, Bhattacharya, and Byrne Citation2014), we describe a real-life application to demonstrate how a solution framework for GSCND combining three optimisation methods can be successfully deployed, and its approach and results become accepted and utilised by managers.
However, there have also been some limitations. The methods used rely heavily on data. Missing information must be replaced by assumptions and estimations, which can be imprecise. The MILP is linear and static, representing ‘a sensible trade-off between realism, scope, complexity, and solvability’ (Melo, Nickel, and Saldanha-da-Gama Citation2009). The AHP limits the decision alternatives to 9 items to ensure consistency (Saaty Citation1980). As a strategic tool, it is unsuitable for operational decision-making with a short time horizon, because it simplifies or excludes several operational parameters. The model’s effectiveness cannot be proven by large datasets and multiple applications, as the employed methodology focussed on a specific field problem and the subsequent generalisation of findings. Nevertheless, the main contribution of the study is not the model itself, but to describe how a solution can be effectively constructed and implemented to support the managerial decision process for GSCND.
More research is needed to find out what application and problem areas the solution framework is best suited to. For example, if it could help manage long-term uncertainty and volatility to mitigate the ripple effect (Ivanov, Dolgui, and Sokolov Citation2019). Furthermore, a longitudinal study could describe the model’s usage after the researcher’s involvement ended, as well as its impact on supply chain performance. The framework can be developed further by integrating it with tactical and operational methods. Such integration can contribute to developing an integrated operations design framework. Research indicates that a fully integrated decision process can lead to better results than hierarchical planning, where different levels are addressed sequentially (Asmussen et al. Citation2018).
6. Conclusion
The purpose of the study was to develop more effective and user-friendly tools to manage the decision difficulties of complex GSCND problems. For this we developed and implemented a decision support framework, which combines MILP, AHP, and the Pareto front in an innovative way, using CIMO-logic. The designed approach could calculate the entire range of efficient network configurations and provide transparency over the interplay between cost and performance. It accommodated existing managerial experience and stimulated knowledge-transfer by providing visualisation. Managers could see trade-offs, discuss solutions, and select the network design best suited to their strategy.
Acknowledgements & disclaimer
An earlier version of this paper was presented at the MIM conference in August 2019 (Reich, Kinra, and Kotzab Citation2019). We thank the reviewers and the audience at the conference for providing constructive and useful feedback for improving the paper.
This project was not compensated by the case company. There is no conflict of interest.
Disclosure statement
No potential conflict of interest was reported by the authors.
Additional information
Notes on contributors

Juri Reich
Juri Reich is a PhD student at the Vienna University of Economics and Business, and at the University of Bremen. His research focuses on decision-making in global supply chain networks – more precisely, on how to integrate qualitative information with mathematical optimisation models and find trade-offs between conflicting goals. Before his doctoral studies, Juri graduated from the MSc Supply Chain Management programme and the CEMS Master’s in Management programme at Copenhagen Business School.

Aseem Kinra
Aseem Kinra heads the professorship in Global Supply Chain Management at the University of Bremen. Prof. Kinra received his bachelor at the Delhi University followed by a master’s degree in business administration. He went on to accomplish a MSc in Economics and Business Administration, followed by a PhD in Supply Chain Management at the Copenhagen Business School, where he graduated in 2009. He worked as an as an Assistant and later as an Associate Professor at the Copenhagen Business School, where he also led the Graduate Diploma programme in Supply Chain Management. His research has previously appeared in journals such as International Journal of Production Economics, International Journal of Production Research, International Journal of Physical Distribution and Logistics Management and the International Journal of Operations and Production Management.

Herbert Kotzab
Herbert Kotzab is a Professor at the Chair of Logistics Management at the University of Bremen and International Professor at Othman Yeop Abdullah Graduate School of Business, Universiti Utara Malaysia, Malaysia. He received his Master of Business Administration in Marketing and Management, PhD (1996) and Postdoctoral degree (Habilitation: 2002) from the Vienna University of Economics and Business Administration. Prior to his assignment at Bremen, he held a Professor position at Copenhagen Business School at the Department of Operations Management. His research focuses on Supply Chain Management, Service Operations and Consumer Driven Value Networks. Since 2013, he has been a member of the Editor-in-Chief-Board of Logistics Research.

Xavier Brusset
Xavier Brusset holds a doctorate in management science from the Université catholique de Louvain. He joined ESSCA School of Management as professor of logistics and supply chain management in 2009. After teaching also at the Toulouse Business School, he joined SKEMA Business School in 2016. His research focuses on the relationship between shippers and carriers and the influence of information on the behaviour of supply chain actors. He has published articles on these topics in academic journals such as the Journal of Operations Management, the European Journal of Operational Research, International Journal of Production Economics, Computers and Industrial Engineering, RAIRO Operations Research, Revue Française de Gestion Industrielle, In the past, he also worked in financial markets and created a company in Argentina on an information-sharing platform between shippers and carriers. Every two years he co-organizes the Colloquium in European Research in Retailing. He is also an expert with the European Union Commission and is the Director of the PRISM Research Centre at SKEMA.
References
- Asmussen, Jesper Normann, Jesper Kristensen, Kenn Steger-Jensen, and Brian Vejrum Wæhrens. 2018. “When to Integrate Strategic and Tactical Decisions? Introduction of an Asset/Inventory Ratio Guiding Fit for Purpose Production Planning.” International Journal of Physical Distribution & Logistics Management 48 (5): 545–568.
- Asmussen, Jesper Normann, Jesper Kristensen, and Brian Vejrum Wæhrens. 2018. “Cost Estimation Accuracy in Supply Chain Design.” International Journal of Physical Distribution & Logistics Management 48 (10): 995–1019.
- Badri, Masood A. 1999. “Combining the Analytic Hierarchy Process and Goal Programming for Global Facility Location-Allocation Problem.” International Journal of Production Economics 62 (3): 237–248.
- Bhattacharya, Arijit, Prasanta Kumar Dey, and William Ho. 2015. “Green Manufacturing Supply Chain Design and Operations Decision Support.” International Journal of Production Research 53 (21): 6339–6343.
- Brusset, Xavier, and Jean-Louis Bertrand. 2018. “Hedging Weather Risk and Coordinating Supply Chains.” Journal of Operations Management 64: 41–52.
- Chan, Felix T. S., N. Kumar, M. K. Tiwari, H. C. W. Lau, and K. L. Choy. 2008. “Global Supplier Selection: A Fuzzy-AHP Approach.” International Journal of Production Research 46 (14): 3825–3857.
- Chopra, Sunil, and Peter Meindl. 2016. Supply Chain Management – Strategy, Planning and Operation. 6th ed. Boston: Pearson.
- Christopher, Martin. 2000. “The Agile Supply Chain: Competing in Volatile Markets.” Industrial Marketing Management 29 (1): 37–44.
- Cohen, Morris A., and Hau L. Lee. 2020. “Designing the Right Global Supply Chain Network.” Manufacturing & Service Operations Management 22 (1): 15–24.
- Courtney, James F. 2007. “Reflections on Decision Support.” DSSResources.COM, May 21. Accessed May 7, 2020. http://dssresources.com/reflections/courtney/courtney05212007.html.
- Denyer, David, David Tranfield, and Joan Ernst van Aken. 2008. “Developing Design Propositions Through Research Synthesis.” Organization Studies 29 (3): 393–413.
- Dolgui, Alexandre, Dmitry Ivanov, and Boris Sokolov. 2018. “Ripple Effect in the Supply Chain: An Analysis and Recent Literature.” International Journal of Production Research 56 (1-2): 414–430.
- Dyer, Robert F., and Ernest H. Forman. 1992. “Group Decision Support with the Analytic Hierarchy Process.” Decision Support Systems 8 (2): 99–124.
- Flynn, B. B., and E. J. Flynn. 2005. “Synergies between Supply Chain Management and Quality Management: Emerging Implications.” International Journal of Production Research 43 (16): 3421–3436.
- Ghodsypour, S. H., and C. O’Brien. 1998. “A Decision Support System for Supplier Selection Using an Integrated Analytic Hierarchy Process and Linear Programming.” International Journal of Production Economics 56-57: 199–212.
- Gyorey, Trish, Matt Jochim, and Sabina Norton. 2010. “The Challenges Ahead for Supply Chains: McKinsey Global Survey Results.” McKinsey & Company, November 1. Accessed July 29, 2020. https://www.mckinsey.com/business-functions/operations/our-insights/the-challenges-ahead-for-supply-chains-mckinsey-global-survey-results.
- Hansen, Carsten, Carlos Mena, and Heather Skipworth. 2017. “Exploring Political Risk in Offshoring Engagements.” International Journal of Production Research 55 (7): 2051–2067.
- Holmström, Jan, Mikko Ketokivi, and Ari-Pekka Hameri. 2009. “Bridging Practice and Theory: A Design Science Approach.” Decision Sciences 40 (1): 65–87.
- Irawan, Chandra Ade, Negar Akbari, Dylan F. Jones, and David Menachof. 2018. “A Combined Supply Chain Optimisation Model for the Installation Phase of Offshore Wind Projects.” International Journal of Production Research 56 (3): 1189–1207.
- Ivanov, Dmitry, Alexandre Dolgui, and Boris Sokolov. 2019. Handbook of Ripple Effects in the Supply Chain. New York: Springer.
- Ivanov, Dmitry, Richard Hartl, Alexandre Dolgui, Alexander Pavlov, and Boris Sokolov. 2015. “Integration of Aggregate Distribution and Dynamic Transportation Planning in a Supply Chain with Capacity Disruptions and the Ripple Effect Consideration.” International Journal of Production Research 53 (23): 6963–6979.
- Kinkel, Steffen, and Spomenka Maloca. 2009. “Drivers and Antecedents of Manufacturing Offshoring and Backshoring – A German Perspective.” Journal of Purchasing and Supply Management 15 (3): 154–165.
- Kinra, Aseem, Kim S. Hald, Raghava R. Mukkamala, and Ravi Vatrapu. 2020. “An Unstructured Textual Big Data Analytics Approach for Country Logistics Performance Assessment in Global Supply Chains.” International Journal of Operations and Production Management 40 (4): 439–458. doi:10.1108/IJOPM-07-2019-0544.
- Kinra, Aseem, and Herbert Kotzab. 2008a. “A Macro-Institutional Perspective on Supply Chain Environmental Complexity.” International Journal of Production Economics 115 (2): 283–295.
- Kinra, Aseem, and Herbert Kotzab. 2008b. “Understanding and Measuring Macro-Institutional Complexity of Logistics Systems Environment.” Journal of Business Logistics 29 (1): 327–346.
- Klose, Andreas, and Andreas Drexl. 2005. “Facility Location Models for Distribution System Design.” European Journal of Operational Research 162 (1): 4–29.
- Korpela, Jukka, Antti Lehmusvaara, and Markku Tuominen. 2001. “Customer Service Based Design of the Supply Chain.” International Journal of Production Economics 69 (2): 193–204.
- Lampón, Jesús F., Santiago Lago-Peñas, and Javier González-Benito. 2015. “International Relocation and Production Geography in the European Automobile Components Sector: The Case of Spain.” International Journal of Production Research 53 (5): 1409–1424.
- Land, Frank F. 2008. “Reflections on Decision Support.” DSSResources.COM, March 16. Accessed May 7, 2020. http://dssresources.com/reflections/land/land03162008.html.
- Lund, Susan, James Manyika, Jonathan Woetzel, Jacques Bughin, Mekala Krishnan, Jeongmin Seong, and Mac Muir. 2019. “Globalization in Transition: The Future of Trade and Value Chains.” McKinsey & Company, January 16. Accessed July 29, 2020. https://www.mckinsey.com/featured-insights/innovation-and-growth/globalization-in-transition-the-future-of-trade-and-value-chains.
- MacCarthy, B. L., and W. Atthirawong. 2003. “Factors Affecting Location Decisions in International Operations – a Delphi Study.” International Journal of Operations and Production Management 23 (7): 794–818.
- Macharis, Cathy, Johan Springael, Klaas De Brucker, and Alain Verbeke. 2004. “PROMETHEE and AHP: The Design of Operational Synergies in Multicriteria Analysis: Strengthening PROMETHEE with Ideas of AHP.” European Journal of Operational Research 153 (2): 307–317.
- Mangiaracina, Riccardo, Guang Song, and Alessandro Perego. 2015. “Distribution Network Design: A Literature Review and a Research Agenda.” International Journal of Physical Distribution & Logistics Management 45 (5): 506–531.
- McCosh, Andrew M. 2007. “Reflections on Decision Support.” DSSResources.COM, December 19. Accessed May 7, 2020. http://dssresources.com/reflections/mccosh/mccosh12192007.html.
- Meixell, Mary J., and Vidyaranya B. Gargeya. 2005. “Global Supply Chain Design: A Literature Review and Critique.” Transportation Research Part E: Logistics and Transportation Review 41 (6): 531–550.
- Melnyk, Steven A., Ram Narasimhan, and Hugo A. DeCampos. 2014. “Supply Chain Design: Issues, Challenges, Frameworks and Solutions.” International Journal of Production Research 52 (7): 1887–1896.
- Melo, M. T., S. Nickel, and F. Saldanha-da-Gama. 2009. “Facility Location and Supply Chain Management – A Review.” European Journal of Operational Research 196 (2): 401–412.
- Meyr, Herbert, Michael Wagner, and Jens Rohde. 2015. “Structure of Advanced Planning Systems.” In Supply Chain Management and Advanced Planning: Concepts, Models, Software, and Case Studies, edited by Hartmut Stadtler, Christoph Kilger, and Herbert Meyr, 99–106. Berlin, Heidelberg: Springer.
- Miller, G. A. 1956. “The Magical Number Seven Plus or Minus Two: Some Limits on Our Capacity for Processing Information.” Psychological Review 63 (2): 81–97.
- O’Keefe, R. 2014. “Design Science, the Design of Systems and Operational Research: Back to the Future?” The Journal of the Operational Research Society 65 (5): 673–684.
- Olhager, Jan, Sebastian Pashaei, and Henrik Sternberg. 2015. “Design of Global Production and Distribution Networks: A Literature Review and Research Agenda.” International Journal of Physical Distribution & Logistics Management 45 (1–2): 138–158.
- Ozgen, Dogan, and Bahadir Gulsun. 2014. “Combining Possibilistic Linear Programming and Fuzzy AHP for Solving the Multi-Objective Capacitated Multi-Facility Location Problem.” Information Sciences 268: 185–201.
- Pareto, Vilfredo. 1906. Manuale di economia politica. Vol. 13. Milan: Societa Editrice.
- Power, Daniel J., Frada Burstein, and Ramesh Sharda. 2011. “Reflections on the Past and Future of Decision Support Systems: Perspective of Eleven Pioneers.” In Decision Support, edited by David Schuff, David Paradice, Frada Burstein, Daniel J. Power, and Ramesh Sharda, 25–48. New York: Springer.
- Reich, Juri, Aseem Kinra, and Herbert Kotzab. 2019. “Strategic Decision-Making in Global Supply Chain Network Design – How a Decision Support System Combining MILP and AHP on a Pareto Front Can Alleviate Decision-Making.” IFAC-PapersOnLine 52 (13): 2285–2290.
- Saaty, Thomas L. 1980. The Analytic Hierarchy Process: Planning, Priority Setting, Resource Allocation. New York: McGraw Hill.
- Saaty, Thomas L. 2013. Decision Making For Leaders: The Analytical Hierarchy Process for Decision in a Complex World. 3rd ed. Pittsburgh: RWS Publications.
- Schmidt, Günter, and Wilbert E. Wilhelm. 2000. “Strategic, Tactical and Operational Decisions in Multi-National Logistics Networks: A Review and Discussion of Modelling Issues.” International Journal of Production Research 38 (7): 1501–1523.
- Schorsch, Timm, Carl Marcus Wallenburg, and Andreas Wieland. 2017. “The Human Factor in SCM.” International Journal of Physical Distribution & Logistics Management 47 (4): 238–262.
- Siraj, Sajid, Ludmil Mikhailov, and John A. Keane. 2015. “PriEsT: An Interactive Decision Support Tool to Estimate Priorities from Pairwise Comparison Judgments.” International Transactions in Operational Research 22 (2): 217–235.
- Srai, Jagjit Singh, and Camille Ané. 2016. “Institutional and Strategic Operations Perspectives on Manufacturing Reshoring.” International Journal of Production Research 54 (23): 7193–7211.
- Tukamuhabwa, Benjamin R., Mark Stevenson, Jerry Busby, and Marta Zorzini. 2015. “Supply Chain Resilience: Definition, Review and Theoretical Foundations for Further Study.” International Journal of Production Research 53 (18): 5592–5623.
- Validi, Sahar, Arijit Bhattacharya, and P. J. Byrne. 2014. “A Case Analysis of a Sustainable Food Supply Chain Distribution System—A Multi-Objective Approach.” International Journal of Production Economics 152: 71–87.
- Van Aken, Joan Ernst. 2007. “Design Science and Organization Development Interventions: Aligning Business and Humanistic Values.” The Journal of Applied Behavioral Science 43 (1): 67–88.
- Van Aken, Joan Ernst, Aravind Chandrasekaran, and Joop Halman. 2016. “Conducting and Publishing Design Science Research: Inaugural Essay of the Design Science Department of the Journal of Operations Management.” Journal of Operations Management 47-48 (1): 1–8.
- Vidal, Carlos J., and Marc Goetschalckx. 1997. “Strategic Production-Distribution Models: A Critical Review with Emphasis on Global Supply Chain Models.” European Journal of Operational Research 98 (1): 1–18.
- Wagner, Gerald R. 2007. “Reflections on Decision Support.” DSSResources.COM, July 22. Accessed May 7, 2020. http://dssresources.com/reflections/gwagner/wagner07222007.html.
- Watson, Hugh J. 2007. “Reflections on Decision Support.” DSSResources.COM, July 6. Accessed May 7, 2020. http://dssresources.com/reflections/hwatson/hwatson07062007.html.
- World Bank. 2020. “Exports of Goods and Services (% of GDP).” World Bank National Accounts Data, and OECD National Accounts Data Files, July 29. Accessed July 29, 2020. https://data.worldbank.org/indicator/NE.EXP.GNFS.ZS.
- Yildiz, Hakan, Jiho Yoon, Srinivas Talluri, and William Ho. 2016. “Reliable Supply Chain Network Design.” Decision Sciences 47 (4): 661–698.