
 ?Mathematical formulae have been encoded as MathML and are displayed in this HTML version using MathJax in order to improve their display. Uncheck the box to turn MathJax off. This feature requires Javascript. Click on a formula to zoom.
ABSTRACT
For manual picking processes in warehouses and assembly line feeding, collaborative robots – cobots – hold a potential to support operators and, thereby, enhance performance. However, studies focused on the economic aspects of cobot applications have been scarce. The present paper aims at modelling a new picking system, in which human operators collaborate with cobots during picking (or kitting) activities. It is considered the case of having a cobot on board of the picking trolley or cart, working in parallel with the picker by performing sorting of the picked items. The paper focuses on the economic aspects of this application and presents a model of the relative cost difference between a manual and a cobot-supported process, accounting for the costs associated with operators, equipment, and quality. The relative cost difference is analysed in a numerical example. The findings suggest that the decision to use a cobot sorting mode is robust when there is considerable sorting work to carry out, for example, when there are higher yearly order volumes to handle, and when higher order commonality among orders processed as a batch can be achieved. Future research should focus on implementation challenges and safety issues associated with cobot-supported picking processes.
1. Introduction
In many production systems, there are some activities that are still operated mainly manually, like the picking activities performed in warehouses or for assembly line feeding. In these cases, human operators walk or travel within a storage area to retrieve the items that are requested by a customer order or by the production demand. A picking tour can refer to a single order (as in the case of the so-called order picking) or to a set of different orders (as in the case of batch picking), that subsequently must be sorted (De Koster, Le-Duc, and Roodbergen Citation2007). Although Tompkins et al. (Citation2010) estimated that picking represents 55 percent of the total costs in a warehouse, the employ of human operators usually represents the most economical alternative, above all in comparison with automated solutions. However, many studies have already pointed out that manual systems can present criticalities and hidden costs, for example, related to musculoskeletal disorders and absenteeism of the operators (Battini et al. Citation2017), or to the impact of the picking errors (Fager, Johansson, and Medbo Citation2014). For the first issue, recent researches propose to integrate human factors and ergonomics in production systems design and decision models (Grosse et al. Citation2017), in order to increase the efficiency and the effectiveness of the operators (Grosse et al. Citation2015). On the other side, warranting an adequate process quality, thanks to the avoidance of picking errors, can be reached through the adoption of proper technologies and devices, able to guide the pickers during their work (Battini et al. Citation2015a).
Thanks also to the recent technological developments, many solutions have been introduced with different levels of automation (Azadeh, De Koster, and Roy Citation2019). Fully automated solutions are characterised by higher investments and impacts on the whole system where they are implemented. On the other side, partial automated solutions provide relatively cheaper alternatives, with high flexibility and scalability. They are based on the use of mobile robots (mobots), mainly for transportation, or collaborative robots (cobots), for picking and sorting (Dubey and Veeramani Citation2017). In fully automated solutions, mobots are widely used to transport racks in robotic mobile fulfilment systems or in puzzle-based storage systems, or sorting products in grid areas. Very few applications of automated picking solutions have been developed, but two examples are the TORU™ picking robot by Magazino (Sgarbossa et al. Citation2020), or the one developed in Boudella, Sahin, and Dallery (Citation2018). In collaborative and interactive applications, mobots are mainly used to transport the items, picked by the operators in the picking zones, to the packaging area. There are also other solutions where cobots support the pickers with sorting activities which have been partially studied. It represents an interesting new application area for cobots due to productivity and quality increasing (Fager, Calzavara, and Sgarbossa Citation2020). However, such a scenario must be carefully evaluated both from a performance and a cost perspective, since a cobot requires a high investment that, hence, needs to be justified by important benefits. Therefore, this paper aims at modelling a new picking system, in which human operators collaborate with cobots during picking (or kitting) activities. In particular, it is considered the case of having a cobot on board of an AGV that represents the picking trolley or cart, working in parallel with the picker by performing sorting of the picked items. Some previous papers have already considered a similar configuration (Boudella, Sahin, and Dallery Citation2018; Coelho, Relvas, and Barbosa-Póvoa Citation2018; Fager, Calzavara, and Sgarbossa Citation2019; Sgarbossa et al. Citation2020); however, none of them focused on the economic aspects of this application, which is the main target of this paper. This paper uses a modelling approach to analyse and compare economic aspects associated with a manual sorting mode and a cobot sorting mode in a picking system. Previous studies that have dealt with applications that involve robot-supported picking and sorting activities have typically focused on operational aspects and rarely on the economic aspects. For example, how items should be assigned to storage locations in serial kitting workflow between an operator and a robot (Boudella, Sahin, and Dallery Citation2018, Citation2016), or time-efficiency associated with cobot sorting in a kitting application (Fager, Calzavara, and Sgarbossa Citation2019, Citation2020). In this light, this paper expands on the previously available knowledge by taking into account the costs associated with operators, equipment, and quality associated with cobot sorting when contrasted with its manual ditto. The cost model can be used by managers to decide whether a cobot setup would be profitable in their own businesses.
The remainder of the paper is structured as follows. In the next section, a literature review about cost modelling of picking and kitting systems, especially focused on time efficiency and quality, is reported. In Section 3, the cost model for the comparison between manual and cobot supported picking is presented. Section 4 shows the application of the proposed model to understand its main and interaction effects and the possible fields of application of the two scenarios. Finally, Section 5 reports the conclusions and suggestions for future research.
2. Literature review
Order picking is a frequently used activity in distribution and manufacturing settings, whereby various items are collected in accordance with customer orders. In production systems, manual order picking and kitting systems deal with different fields of application and are typically characterised by different warehouse dimensions. In fact, in case of warehouse order picking, the operators have to collect the items requested by the customers’ orders by travelling within a large warehouse. On the other side, in a kitting system, the operators prepare the kits used during the assembly process, picking the items in a small warehouse, called supermarket. However, although their fields of application are different, both systems have in common the employ of human operators to perform the retrieval of the needed items from the warehouse shelves. It derives that they can also share some of their criticalities, such as the need of warranting high performances in terms of time or process quality. The existing literature provides several interesting contributions related to these scopes, by analysing them from different points of view.
2.1. Performance of order picking and kitting systems
The main purpose of the papers related to time efficiency of order picking and kitting systems usually concerns the modelling of the activities and the proposal of strategies to reduce the time needed to process a picking or a kitting tour. Brynzér and Johansson (Citation1995) analysed various case studies concerning materials kitting systems, by comparing different approaches for deciding the location of the picking activity, the work organisation, the picking method, the used information system and the operators’ equipment. Their results show that kitting efficiency and accuracy can be improved by taking into account the product structure both for the information system design and for the storage assignment policy, or by applying orders batching. Also starting from empirical studies, Hanson and Medbo (Citation2019) proposed a methodology to assess how the man-hour efficiency of kit preparation is affected by the design and the context of the kit preparation. They found that a high picking density leads to shorter kitting times, and, therefore, they suggested to take it into account during the dimensioning and the layout of the kitting area, in the design of the storage racks, and in the choice of the batch size. Battini et al. (Citation2018) compared two different order picking strategies, i.e. carton picking from pallets and carton picking from racks, by a time perspective. The introduced Carton Pick from rack Convenience Condition allowed to establish which items should be stored on pallets and which on racks, with positive impacts on space and time savings, thanks to the reduced travelled distances. In their research, Grosse and Glock (Citation2015) stated that the modelling of worker learning in order picking could improve the predictability of order throughput times, and that it could be useful to properly allocate the available human resources.
As far as process quality is concerned, the existing literature shows a particular focus on the description of the possible arising errors. Fager, Johansson, and Medbo (Citation2014) focused on quality issues of materials kit preparation, through the proposal of a framework including the types, the causes and the determinants of quality in kitting. The highlighted quality problems were associated, for example, to the pick of the wrong component, to the miss or to the surplus of pieces, to the wrong items of kits positioning. Caputo, Pelagagge, and Salini (Citation2017a, Citation2017b) investigated the impact of human errors and other quality problems that could arise during kitting activities. Starting from the estimation of errors probability and errors correction costs, they defined their impact on the overall quality costs of a kitting system. It turned out that the main sources of error costs are: assembly of a non-conforming product from a wrong kit, delivering replacement kits, end of line correction of errors from assembly of kits having undetected parts errors.
For order picking systems, pick errors can lead to the delivery of an order that does not correspond to what the customer wants, since it contains wrong items or it lacks some products. The impact of such errors can vary according to the moment in which the error is detected, as described by Battini et al. (Citation2015a). Here, the authors suggested to adopt paperless picking technologies to prevent some of the possible picking errors and, then, to limit their economic impact.
2.2. Cost modelling of order picking and kitting systems
A possible approach for evaluating a production system is the definition of a mathematical model that considers its arising costs. In this case, it is important to describe the activities that are considered significant for the final outcomes, as well as the involved resources (operators, devices, hardware, etc.).
For assembly systems, some of the existing researches have the aim of comparing line stocking and kitting. In this direction, the cost model by Limère et al. (Citation2012) showed that the best feeding policy is a hybrid one, with some parts kitted while others line stocked, according to the characteristics of the parts. Battini et al. (Citation2009), Caputo and Pelagagge (Citation2011) and Caputo, Pelagagge, and Salini (Citation2015) provide similar findings. In the first paper, the cost model is applied to compare three strategies: pallet to workstation, trolley to workstation and kit to assembly line, with the aim of minimising total storage costs. The second and third strategies consider kitting and just in time kanban-based continuous supply and line storage. Subsequently, Limère, Van Landeghem, and Goetschalckx (Citation2015) added the consideration of variable assembly operator walking distances, which are influenced exactly by how the parts are fed to the assembly line. Caputo, Pelagagge, and Salini (Citation2018) proposed an economic mathematical model to map convenience areas of each feeding policy, in order to quickly derive the best feeding policy for each assembly part on an economic basis.
Battini et al. (Citation2015a) focused on the description of the warehouse picking process by a cost perspective to justify the adoption of paperless picking technologies. On the other side, Frazelle, Hackman, and Platzman (Citation1989), Frazelle et al. (Citation1994) and Bartholdi and Hackman (Citation2008) preferred to consider the costs related to forward area dimensioning, items allocation, and replenishment impact. Another perspective considered that the most important costs of a picking warehouse are related to the time needed for processing a picking order (De Koster, Le-Duc, and Roodbergen Citation2007; Gu, Goetschalckx, and McGinnis Citation2010). Therefore, research on this topic mainly propose to reduce costs by decreasing the picking time and, particularly, the travel time (Daniels, Rummel, and Schantz Citation1998; Tompkins et al. Citation2010; Battini et al. Citation2015b).
2.3. Automation of order picking and kitting systems
Other contributions on picking and kitting systems suggest automation as an alternative to the employ of human operators. Already in Citation1989, Sellers and Nof discussed the problem of selecting the proper design of a robotic kitting system based on desired performance criteria. They compared different robotic configurations from a performance point of view, deriving that, for their cases, the miniload onboard robot/automated storage-retrieval kitting system was the best one. Subsequently, many papers have studied the possibility of employing automated solutions for substituting or for supporting human operators during picking and kitting operations (Tamaki and Nof Citation1991; Comand et al. Citation2019).
Recently, Boudella, Sahin, and Dallery (Citation2016, Citation2018) considered the use of a collaborative robot together with the operator for kitting operations of mixed-model assembly lines. Their analyses suggest that such a system can be applied only in certain settings, according to the items characteristics, the throughput and the available space. Coelho, Relvas, and Barbosa-Póvoa (Citation2018) developed a simulation tool for analysing the employ of robots for assembly kitting activities. The outcomes showed that, even if robots have a more stable productivity, the system performance is often higher with human operators. Fager, Calzavara, and Sgarbossa (Citation2019, Citation2020) studied the potential of cobots to support kit preparation with order batching, with the pick task performed manually and the sort task performed by a cobot. The findings report that cobot-supported kitting provides less variability of the outcome and it performs better with smaller quantities per picked item. These studies represented the first contributions focused on the employ of cobots for supporting kitting activities, while, to the best of our knowledge, no contributions are available so far regarding the use of cobots for warehouse order picking. Moreover, Fager, Calzavara, and Sgarbossa (Citation2019, Citation2020) focus only on an operational evaluation, by comparing the time performances of the operator and of the cobot for each picked and sorted item, with a higher detail on the performed activities. On the other side, this paper aims at keeping a tactical perspective, in which the system is evaluated and modelled as a whole, from an economic point of view, considering operator, equipment and quality costs. Although the behaviour of the investigated systems is the same, here the attention is on comparing their emerging costs to derive the economic sustainability of both configurations.
The literature review reported above shows that order picking and kitting systems have inspired various studies, some of them focused on improving time efficiency and process quality. Continuing on this line of research, this paper intends to cover an existing research gap, by considering the employ of cobots for supporting human operators during sorting activities, through the relative cost model introduced in the next sections.
3. Cost modelling of manual and cobot sorting
This section presents a description of the picking process considered in the paper. Furthermore, the section presents mathematical models of two different modes by which the process is operated: A manual sorting mode (mode 1) and a cobot sorting mode (mode 2).
The notations used in the models, and example values used in the model application (see Section 4), are shown in Table . The example values in Table have been adopted with respect to values used in the relevant literature, as highlighted in Section 2, including publications that the authors previously have been involved with. Specific values for factor levels were selected by using the relevant literature as a point of reference for identifying realistic factor levels.
Table 1. Notations and example values.
3.1. Descriptions of manual and cobot sorting modes
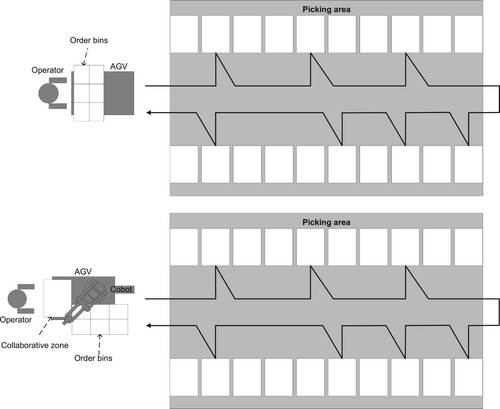
The picking process under consideration involves collecting items to order bins in a picking area. Each order bin represents one order and contains a collection of items for one customer, for example, an assembly process. The process makes use of an order batching approach, meaning that several orders are prepared during each picking tour. There is no requirement on the orientation and position of items in the order bins. Here, a manual sorting mode, mode 1, and a cobot sorting mode, mode 2, are considered. An overview of the two modes is shown in Figure .
Figure 1. Overview of the manual sorting mode (top) and the cobot sorting mode (bottom).
The two modes are considered with respect to a set of assumptions. In the following, important assumptions are highlighted.
Effects of learning rates and ergonomic loads on the operator’s performance are not considered, since they would only slightly influence the cobot sorting mode, but largely be the same for the two modes.
The cobot is assumed to always be able to successfully pick components on its first try, since components in the collaborative zone are presented to the cobot on a flat surface (El Zaatari et al. Citation2019).
The cobot is assumed to always be able to successfully place components into order bins on its first try, since the order bins are assumed to be large enough so that components already present in an order bin never interfere with the placement activity.
The length of the picking tour is assumed to be the same for each work cycle, since a return policy with S-shape routing is used inside the picking area. In any case, the results can be generalised dividing the total travel length by the number of stops, calculating the average distance per line
, as shown in the following.
The vision system analysis of the components in the collaborative zone is considered to take place in parallel with the cobot’s other activities, why it does not add to the cobot’s time expenditure (Coelho, Relvas, and Barbosa-Póvoa Citation2018).
The AGV-trolley is assumed to never interfere with the operator’s movement, since the AGV-trolley moves in pace with the operator based on the operator’s activities.
The space occupancy of the cobot on the AGV-trolley is assumed to not affect efficiency, since the picking aisle is assumed to be wide enough to not interfere with movement, and since the AGV-trolley is assumed to be large enough that the order bins can be positioned on the AGV-trolley so that the cobot can operate at full efficiency.
3.1.1. Manual sorting mode
In the manual sorting mode, the operator picks items from shelves and sorts the items into order bins, as shown in the top part of Figure . A picking information system provides information about which items to pick and in which order bins to sort them. The picking information system allows the operator to receive the pick list as instructions and to confirm activities and, thereby, get feedback that items are picked and sorted correctly. The instructions include information about which SKU to pick items from, the quantity to pick, which order bins to place components in and how many items to place in each order bin. The order bins are carried by an AGV that moves along the picking aisle from shelf to shelf, moving as the operator confirms the activities associated with each order line. Here, the term ‘order line’ refers to a row on a pick list, indicating the quantity to pick of an SKU and the order bins into which the items should be sorted.
3.1.2. Cobot sorting mode
In the cobot sorting mode, a cobot assists the operator (bottom part of Figure ). Here, the operator picks items from the shelves in the same manner as in the manual sorting mode, but then puts the full quantity in a container presented on the AGV – called the collaborative zone. A cobot, which is mounted on the AGV, then sorts the items in the collaborative zone into order bins. A vision system guides the cobot to perform its task correctly. The camera is mounted above the collaborative zone and continually analyses the zone’s contents so that the cobot never has to wait for the analysis to complete.
3.2. Modelling cost of the manual and cobot sorting modes
A multitude of factors play a role for the cost associated with picking activities. With respect to this paper’s purpose, the differences between manual and cobot-supported picking are of interest, and the costs associated with operators, equipment, and quality are considered.
The relative cost difference between the two modes, , of manual picking,
, when compared with cobot-supported picking,
, can be expressed as:
(1)
(1)
The yearly total cost associated with each mode
is the sum of costs associated with the yearly cost of operators
, equipment
, and quality
. Accordingly:
(2)
(2)
3.2.1. Operator cost in the manual sorting mode
Yearly operator cost of mode
corresponds to the product of the number of working hours per day
, the number of working days per year
, the number of operators required with mode
,
, and the hourly operator cost
:
(3)
(3) Here,
,
and
are fixed, while
depends on the productivity in mode
. The number of operators required to fulfill a yearly order requirement
is:
(4)
(4) where
is the yearly order volume,
is the number of order lines per order, and
is the productivity of mode
in order lines per year and operator. To estimate the operator cost, it is necessary to know the operator’s productivity in terms of the number of order lines completed per year.
Manual picking has been modelled before, see for example Fager, Calzavara, and Sgarbossa (Citation2019, Citation2020), Caputo, Pelagagge, and Salini (Citation2018), Battini et al. (Citation2015a) and Battini et al. (Citation2009). Time expenditure in picking operations generally consists of setup time, travelling time and picking time. Setup time, , is the time required in between picking tours to, for example, unload full order bins, load empty order bins, and return to the starting position of the picking tour. Travelling time,
, occurs during the picking tour, so does picking time,
, and sorting time,
.
With a batch picking approach, multiple pick lists for individual orders can be combined into a batch pick list. Here, a pick list for an individual order on average consists of order lines, where on average
items are picked per order line, see Table .
Table 2. Example of a pick list for one order.
When orders are combined into a batch pick list, see Table , order commonality can make it possible to combine individual order lines from different pick lists.
Table 3. Example of a batch pick list for a setup with , .
As can be seen from Tables and , order commonality affects the number of items of the same SKU that can be picked during a single stop during the picking tour. Here, the number of order lines on the batch pick list, , are always fewer than the sum of order lines of the individual pick lists that make up the batch of size
. Similarly, order commonality affects the average quantity of items to pick per order line. As it is of interest to estimate the operator’s productivity in terms of order lines completed per year and operator, order commonality is important to account for as it plays a different role for the various time requirements. In fact, the time requirement of setup and travelling depend on the number of order lines performed, while the time requirement of picking and sorting depends on the quantity of items handled.
The relationship between the number of order lines of a pick list for an individual order, , and the number of order lines of a pick list for a batch of orders with batch size
,
, can be expressed as:
(5)
(5) where
is the commonality among the orders in the batch.
Here, works as a compression factor when combining pick lists of multiple orders into a batch pick list. When
= 0 and there is no commonality, then
. Conversely, if
there is full commonality, then
. Hence, it can be shown that:
(6)
(6)
The relationship between the average quantity of items per order line of a pick list for a batch of orders of batch size ,
, and the average quantity of items per order line on the pick lists for the individual orders within the batch can be expressed as:
(7)
(7) where
is the inverse commonality among order lines within the batch.
Here, if = 0 there is full commonality among the orders so that all orders in the batch require the same SKUs and
. Conversely, if
there is no commonality among the orders so that only one order requires each SKU and
. Accordingly:
(8)
(8)
Since the total number of items to pick during each picking tour is the same regardless of the order commonality, fewer order lines as a result of effective batching that achieves high order commonality means more items to pick per order line. Hence, there is a relationship between and
. The total number of items to pick each picking tour with a batch size
is:
(9)
(9) where
is the number of order lines associated to a pick list representing a single order. The number of items to pick per order line in the batch pick list
can be calculated as:
(10)
(10) With (4), (6) and (9), it can be shown that:
(11)
(11)
For the manual sorting mode, the time for completing an order line on a batch pick list can now by help of (5) to (11) be expressed as:
(12)
(12) Here,
is the number of order lines completed during a picking tour,
is the distance travelled during the picking tour at speed
, such that
is the total travelling time,
is the number of items per order line,
is picking time per item, and
is the sorting time for the operator.
For the manual sorting mode, productivity in order lines per year for one operator can now be estimated as:
(13)
(13) where
is the number of seconds in a work day, and
is the number of workdays per year. The term
in (13) normalises the effect of combining orders into a batch, so that the productivity estimate
corresponds to the number of completed order lines of individual orders.
With (4) and (13), the operator cost in the manual sorting mode can now be estimated from (3).
3.2.2. Operator cost in the cobot sorting mode
With the cobot sorting mode, productivity can be calculated based on Fager, Calzavara, and Sgarbossa (Citation2019, Citation2020). Here, time expenditure associated with cobot sorting depends on how well the collaboration works between the operator and the cobot, order line by order line. Accordingly, the time expenditure of collaboration is here modelled by means of the collaboration factor , and the productivity associated with cobot sorting can be expressed as:
(14)
(14)
To set , it is necessary to estimate how well the collaboration between the operator and cobot works, and this is represented by
:
(15)
(15)
For , when assuming deterministic time and constant values of all parameters yield:
(16)
(16) Here,
means that the operator on average is slower than the cobot, so
. Conversely,
means that the cobot on average is slower than operator, so
. However, since the process is stochastic, it is appropriate to assume that:
(17)
(17)
By assuming linearity from 1 to 0 when goes from 0.8 to 1.2, it can be shown that
.
3.2.3. Equipment cost in the manual and cobot sorting modes
The yearly cost of equipment associated with either mode is:
(18)
(18)
The differences between the two modes are of interest. Important equipment related costs associated with the two modes are shown in Table .
Table 4. Equipment related costs associated with the two modes.
3.2.4. Quality costs in the manual and cobot sorting modes
Quality costs of picking activities are a consequence of errors that arise during the order picking process. When an error occurs, it has to be corrected either during the picking process, at the internal customer, e.g. an assembly line, or at a final quality inspection (Caputo, Pelagagge, and Salini Citation2017a, Citation2017b). The costs associated with manual errors in kitting processes have been modelled before by Caputo, Pelagagge, and Salini (Citation2017a, Citation2017b); here, these models have been adopted to estimate quality costs associated with the two modes.
Errors that are related to delivery and assembly are not directly linked to picking activities in the kit preparation process and are hence not considered here. This means that, in the Caputo, Pelagagge, and Salini (Citation2017a, Citation2017b) frameworks, quality problems of type 1 and type 2 are not considered, and that quality problems of type 3 and type 4 are considered. In addition, errors that are detected and corrected at the kit preparation process are considered, which result in a time addition to the kit preparation cycle time. Different costs arise depending on where in the materials flow the error is corrected, and it is more costly to correct errors later in the materials flow. In Table , the three types of error corrections considered are shown, along with example values of correction costs as adopted from Caputo, Pelagagge, and Salini (Citation2017a, Citation2017b).
Table 5. Types and example values of error correction costs.
As explained by Caputo, Pelagagge, and Salini (Citation2017a, Citation2017b), there is a chance that errors are detected and corrected already at the picking process, , or that errors are detected and corrected at the assembly work station,
, thereby avoiding correction at end of line inspection. With respect to the two modes, there is a difference in probability of detecting errors at the picking process,
, as the cobot in mode 2 analyses all components that are sorted, while the probability to detect errors at the assembly process is identical for the two modes.
Various error types can occur in picking processes. Here, five error types and their probabilities of occurring in accordance with the frameworks of Caputo, Pelagagge, and Salini (Citation2017a, Citation2017b) and Fager, Johansson, and Medbo (Citation2014) are considered, as shown in Table .
Table 6. Example values for error probabilities.
The quality costs associated with mode can now be estimated as:
(19)
(19)
4. Model application
This paper focuses on the economic aspects of picking systems. This section presents an economic analysis and comparison of the manual and cobot sorting modes.
The model application is carried out for all permutations of the factor levels presented in Table , using (1) through (19). Of interest is the relative cost difference cost in accordance with (1). The analysis consists of three parts, (1) identifying the main effects in the model; (2) identifying interaction effects among the factors, and (3) analysing the relative cost difference between the two modes. The analysis results are presented with respect to the factors identified to have the greatest impact.
The example values used in the model application, as shown in Tables , , , were adopted from the available literature on the topic, as described in Section 2. This includes studies that the authors have been involved with, for example previous case research and experiments, that have focused on contexts of both order picking and kitting. Specific values were selected by using the relevant literature as a point of reference for identifying realistic factor levels.
4.1. Main cost components
This paper considers the relative cost difference between a manual and cobot sorting mode in a picking system with respect to three main cost components: cost of operators, equipment, and quality. Figure shows a comparison between the costs for the two sorting modes with respect to the main cost components.
Figure 2. Main cost components in €/year (logarithmic scale) of the two modes with respect to operator cost (left), equipment cost (middle), and quality cost (right). Boxes represent average cost and standard deviation. Bracketed lines represent maximum and minimum cost.
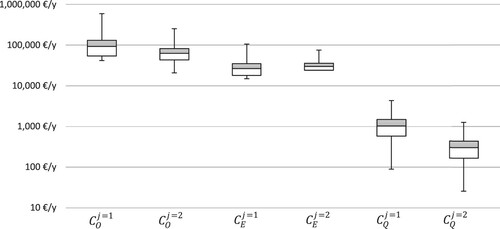
Figure shows that the cobot-sorting mode is beneficial with respect to both operator and quality cost, but on average more costly with respect to equipment cost. The benefits of mode 2 with respect to operator cost comes from the improved productivity associated with mode 2, whereby fewer operators, or picking units, are required. With equipment cost, as mode 2 reduces the number of picking units required by improving productivity, as can be seen from the operator cost in Figure , the differences in equipment cost in comparison with the manual sorting mode are small, as fewer operators and, thereby, fewer picking units are needed to achieve the productivity requirement with mode 2. Figure also shows that the quality cost is smaller than the equipment cost by roughly a factor of ten, and smaller than the operator cost by roughly a factor of a hundred, making quality cost inconsequential for the relative cost difference between the two modes. The relative cost comparison between the two modes hence largely depends on the differences with respect to operator and equipment cost.
4.2. Main effects
Before considering the relative cost difference between the two modes, , it is important to first identify which are the factors that play the more important role.
Figure shows the main effects with respect to the relative cost difference associated with varying levels of yearly order volume, , number of order lines per order,
number of items per order line,
, order commonality,
, batch size,
, hourly operator cost,
, and picking tour length,
. Additionally, the effect of average distance per line,
, defined as the length of the picking tour,
, divided by the number of order lines per order,
, is also considered.
quantifies the average travel distance, and, indirectly also the time, available from one pick location to another.
Figure 3. Main effect plot of , showing effect size (vertical axis) and factor levels (horizontal axis) for the considered factors.
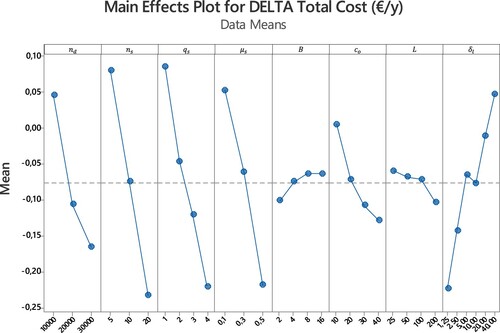
As shown in Figure , the yearly order volume, , the number of order lines per order,
, and the number of items per order line,
, all play a major role for the relative cost difference. Noteworthy with respect to
is that the lowest level of 10,000 orders per year gives mode 1 a cost advantage, while mode 2 is more beneficial for higher yearly order volumes. Here, the effect of
stems from scaling, as small differences between the modes in terms of operator, equipment and quality costs become more important with larger order volumes. With
and
, both factors are related to the number of items involved in each work cycle, and higher levels implies more items to pick and sort. As both modes rely on handling items one at a time, it is natural that they play a major role for the relative cost difference, affecting both operator and equipment costs. Furthermore, more items to handle also increase the risk of errors in the picking process, thereby affecting the quality costs.
Figure also shows the order commonality, , to also have a major impact, as does hourly operator cost,
. With
, the number of order lines on the batch pick list are affected, and, in turn, affects how many items must be sorted during the work cycle. This affects productivity and hence the operator costs. With hourly operator costs, it is clear from Figure that cobot-sorting is the costlier option when the hourly operator cost is low, but also that it becomes a more cost-efficient option when the hourly operator costs is higher.
With respect to the batch size, , and the travel distance,
, Figure shows that the factors barely affect the relative cost difference. The batch size has little effect on its own, as
largely determines the effect on how many items should be sorted at each order line on the batch pick list,
. A similar effect can be observed with respect to the travel distance,
, where both modes are affected similarly, resulting in a small effect on the relative cost difference. These factor interactions are discussed more in Section 4.3.
Finally, Figure shows that the effect from the average distance per order line, , on the relative cost difference is substantial, but somewhat irregular. Here, mode 2 is the more cost-efficient option with low
because items are picked more frequently and there is more sorting-work to carry out, leading to that most of the cobot’s capacity can be utilised. With high
, however, the cobot’s capacity utilisation drops and the operator starts controlling the work pace. This mechanism becomes clear when
goes from 5 m/order line to 10 m/order line, as indicated by the sudden drop in
between these points. Here, the collaboration factor
switch value from 1 to its’ linear approximation in accordance with (17), depending on several other factors, in accordance with (15).
4.3. Interaction effects
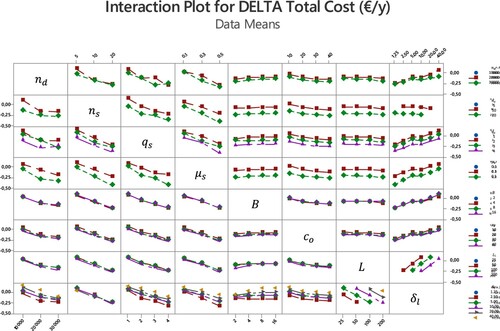
While main effects indicate the importance of individual parameters, interaction effects can reveal relationships among parameters that play an important role for the relative cost difference between the two modes.
Interaction effects among the model parameters are shown in Figure . Here, there is substantial interaction among ,
,
and
. With batch size,
, the interaction is small with the other factors, except for the interaction with the average distance per order line,
. Here, it is clear that a larger batch size benefits mode 2 with longer
by giving the cobot more sorting-work to perform.
interacts with the other parameters by linearly moderating the effects of the other factors. While the travel distance,
, barely interacts at all with the other factors, as indicated by the almost parallel and overlapping lines in its associated rows and columns, its interaction becomes more prominent when considered together with
, as in the average travel distance per order line,
. Here, several significant interactions appear with respect to the other factors, for example with
and
.
Figure 4. Interaction plot with respect to , showing size of interaction effects (vertical axis) and the factor levels used for each parameter (horizontal axis).
From looking at the main effects and interactions among the factors, the parameters and
show substantial main effects when considered individually, but also show considerable interaction effects both with respect to each other, and with respect to the other factors. This is because
and
both affect the number of items picked and sorted during each work cycle. As both mode 1 and 2 operate by handling a single item at a time, the productivity is strongly affected by
and
, and, consequently, so is the relative cost difference associated with the two modes. Additionally, this effect is accentuated by
which affects how many items are associated with each order line, in accordance with (10).
accentuates the effects of other factors by increasing the amount of work that has to be carried out each year. However, as can be noted from the interaction plots between
and
,
and
– by how the effects diverge for higher levels of
– is that the effect associated with
depends on when
change from 1 to its linear approximation, in accordance with (17). This means that if sufficient capacity utlisation can not be achieved with the cobot-sorting in mode 2, for example when
,
,
, and
are too low for there to be a sufficient number of items for the cobot to sort, the cost benefits of mode 2 become less prominent also for higher yearly order volumes. Finally, the interaction effects associated with average distance per order line,
, shows to be strong with respect to the other factors, apart from the lower levels of
.
4.4. Relative cost difference between manual and cobot sorting modes
Based on the analysis of main- and interaction effects in Subsections 4.2 and 4.3, Figure shows the relative cost difference between the two modes with respect to the most influential parameters ,
,
, and
.
Figure 5. Relative cost difference between the manual sorting mode and the cobot sorting mode with respect to (vertical axis) and
(horizontal axis) under different levels of
and
. Grey areas indicate a more profitable manual sorting mode and white areas indicate a more profitable cobot sorting mode.
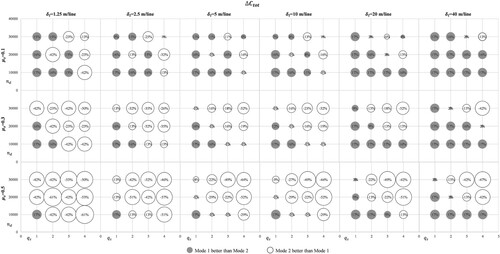
Figure provides several indications as to which settings affect the relative cost difference between the two modes. To begin with, Figure indicates that higher improves the robustness of choosing mode 2 over mode 1. Here, it is only for longer average distances per order line, e.g. 20–40 m per order line, that the cost-benefits become less prominent when
is high, but high levels of
and
still make mode 2 the better option. Mode 2 should, however, be avoided when there are very few items and longer average distance per order line, even for high
.
Figure also shows that lower levels of makes the benefit of mode 2 questionable. If mode 2 should be considered in a low
setting, it is crucial that
and
are high, so that the cobot’s capacity can be utilised. However, even if a sufficient capacity utilisation can be achieved, the decision to use mode 2 with low
would still be sensitive to volume fluctuations, where changes to both higher and lower volume could, more or less, nullify the benefits, or make manual mode the more cost-efficient option. This becomes more problematic when
is long, where mode 1 generally is more cost-efficient, except when
and
are high.
Finally, as can be noticed in Figure , the cost-benefit of the decision to use mode 2 appears to be unpredictable with increasing levels of and
. For example, the cost-benefit associated with
of 30,000 and
of 4 is, under most settings, less than with
of 20,000 and
of 3. This is because of the number of picking units (
) required with each mode, as additional picking units are required to handle the larger volumes and sorting requirements.
4.5. Number of picking units
As was pointed out in the analysis of the main cost components, the costs associated with operators and equipment make up most of the effects with respect to the relative cost difference. These costs are strongly linked to the number of picking units each mode requires. The number of picking units (i.e. corresponding to the number of operators, ) required in each of the modes is shown in Figure .
Figure 6. The average number of picking units required in mode 1 and 2 with respect to (vertical axis) and
(horizontal axis) under different levels of
and
. Grey circle without border indicate the average number of picking units required with mode 1, and hollow circle with border indicate the average number of picking units required with mode 2.
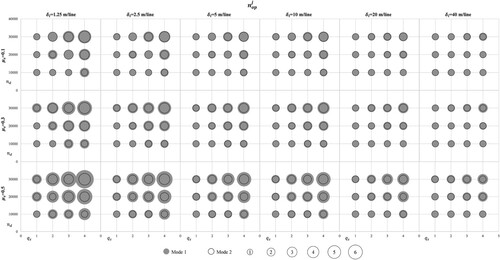
From comparing Figures and , it is clear that since each new picking unit is more expensive with mode 2 than with mode 1, the effect on the relative cost difference is substantial whenever an additional picking unit is necessary to use due to, for example, an increase in yearly volume or a change in order mix. This makes choosing mode 2 on grounds of cost-benefits a more sensitive decision when is low and
is long, as mode 1 may well be the more cost-efficient option depending on the values of other factors in the system. When the decision is this sensitive, a picking system that makes use of both modes could instead be a better option, where some picking units sort manually, and others by help of a cobot. For higher
and shorter
, the decision to use mode 2 is more robust, and the need for an additional picking unit with mode 2 is, more or less, always associated with a cost-benefit.
5. Conclusions
This paper has modelled and compared the costs associated with operators, quality and equipment in a picking process when the sorting task is performed manually or by a cobot. A manual and a cobot sorting modes were compared based on the relative cost differences and main and interaction effects were identified. The paper advances the analysis of an application of cobots in kit preparation that was presented in Fager, Calzavara, and Sgarbossa (Citation2019) by considering how the cost associated with the application compares with its manual alternative under various settings of important factors of the picking system. The comparison was made with respect to relative cost difference, which is central when robot applications are considered for use in practice.
The findings suggest that the use of a cobot sorting mode is a profitable alternative over a manual sorting mode for picking systems where there is a more extensive sorting task to be carried out. This is often the case when there are many order lines per order, many items per order line, order batching is used, and where different orders have more items in common. These characteristics can often be found in picking systems associated with assembly operations where there is a product structure available, but may also be common characteristics in distributions settings, for example, in spare parts supply or at logistics service providers that deal with some level of order commonality. The findings illustrate that a cobot sorting mode is a more beneficial option over a manual mode when the average distance per order line is shorter and a higher order commonality within each order batch can be achieved. These aspects can be affected by, for example, selection of storage policy, routing policy, and batching policy, for which there are rich amounts of literature available (see e.g. De Koster, Le-Duc, and Roodbergen Citation2007). Cost-benefits of cobot-sorting stems partly from increased productivity that can be achieved when a cobot relieves the operator from sorting activities during the picking process, and, to an extent, from an improved ability to detect errors already during the picking process, thereby reducing the quality costs, which is important in industrial picking systems (Caputo, Pelagagge, and Salini Citation2017a, Citation2017b; Fager, Johansson, and Medbo Citation2014). The paper also shows under what circumstances the additional equipment cost associated with a cobot-sorting mode is motivated by increased productivity and reduced quality costs.
The paper acknowledged that economic aspects of cobots applied in picking systems rarely have been dealt with in the literature, although operational aspects have been studied recently by Fager, Calzavara, and Sgarbossa (Citation2019, Citation2020), Boudella, Sahin, and Dallery (Citation2016, Citation2018) and Coelho, Relvas, and Barbosa-Póvoa (Citation2018). The available literature did, however, present relevant input such that the paper could expand on the available knowledge by considering new settings where the cobot-application can be considered for use. For example, the findings illustrate that to use cobot-sorting generally is an economically beneficial decision if considerable order commonality can be achieved, but also that it can be a worthwhile option with less order commonality if the cobot’s capacity utilisation can be ensured, for example, by reducing the average distance per order line or by adjusting the yearly order volume that is assigned to cobot-supported picking units. Similarly, the paper also demonstrates that a manual sorting mode is preferable, for example, when there are long average distance per order line, such as in many warehouses with a multitude of SKU’s and few order lines per order, and where orders have few items in common. Furthermore, the paper also demonstrates the robustness of the decision to use either a manual or a cobot-supported mode by considering the relative cost across a considerable range of settings. In this way, this paper extends the previously available knowledge by demonstrating the costs of cobot sorting compared with a manual alternative across a range of typical warehouse settings, accounting for costs related to operators, equipment and quality, something which is new in literature.
Some assumptions used in the model lack empirical grounding, for example concerning quality in terms of error probabilities, both with respect to manual picking, as noted by Caputo, Pelagagge, and Salini (Citation2017a, Citation2017b), and with respect to cobot sorting. It is reasonable to assume that an application of a cobot to support the sorting task with a batch picking approach is beneficial for quality, as it removes risks of human errors when sorting components among order bins. However, incomplete or unskilled implementation of cobots in picking systems could result in new types of potential error sources, for example, dropped items due to the robot unsuccessfully gripping the items, or outdated data in the warehouse management system that causes the robot to pick and sort the wrong items. Some researchers have pointed out that manual picking systems are apt at dealing with ambiguity and problems in the picking systems design (Glock et al. Citation2017), but this is likely not the case with robot-supported systems, which instead require an unambiguous and precisely designed system. Empirical studies that address quality are encouraged to this end, and the model in this paper is readily applicable when such empirical data becomes available. Moreover, the model could be expanded in future studies by also considering, for example, ergonomic aspects or flexibility. It is likely that cobots can support these other performance areas as well.
The model presented in the paper makes up an effective yet comprehensive approach for assessing relative cost between manual and cobot sorting. This can be used by managers to assess potential cost benefits in their own picking systems, but it can also be used as input when planning the number of picking units required to handle, for example, a yearly order volume of a certain order mix. The model relies on data that is readily available in most warehouse management systems and thereby promotes straightforward application.
Empirical studies concerning robotics in picking systems are still scarce in the research literature (Azadeh, De Koster, and Roy Citation2019). In future research, empirical studies in laboratory settings or in industrial pilots are an important next step that could shed light on the challenges that come with implementation of robotic picking applications. For example, there may be unsuitable component characteristics for cobot picking (see e.g. Boudella, Sahin, and Dallery Citation2016, Citation2018), or safety regulations that interfere with how the application is intended to work, since other people than the operator may be present at the picking area. While the model presented in this paper is helpful for assessing the economic impact, a comprehensive analysis must be carried out before implementation is considered and more knowledge of implementations and use of robotics in picking applications would help practitioners to a more complete assessment whether robot applications are suitable given their unique requirements. Such studies would also provide valuable empirical data that can be used together with the model presented in this paper.
Disclosure statement
No potential conflict of interest was reported by the author(s).
Additional information
Notes on contributors

Patrik Fager
Patrik Fager, PhD, is a Researcher in Production Logistics and Materials Handling at the Department of Industrial and Materials Science (IMS) at Chalmers University of Technology (Sweden) from October 2019. He received his PhD in October 2019 from Chalmers University of Technology. He is currently involved in several European and National research projects focusing on design, digitalization, and automation of logistics activities in supply chains and manufacturing systems.

Fabio Sgarbossa
Fabio Sgarbossa is Full Professor of Industrial Logistics at the Department of Mechanical and Industrial Engineering (MTP) at NTNU (Norway) from October 2018. He was Associate Professor at University of Padova (Italy) where he also received his PhD in Industrial Engineering in 2010. He is leader of the Production Management Group at MTP and he is responsible of the Logistics 4.0 Lab at NTNU. He has been and he is involved in several European and National Projects. He is author and co-author of about 100 publications in relevant international journals, about industrial logistics, material handling, materials management, supply chain. He is member of Organizing and Scientific Committees of several International Conferences, and he is member of editorial boards in relevant International Journals.

Martina Calzavara
Martina Calzavara, PhD, is an assistant professor in the Department of Management and Engineering at the University of Padua. She is currently teaching in courses, lectures and workshops, at the University of Padua and in other Italian institutes. Her researches are mainly related to industrial and logistics systems design, management and modelling. In particular, these often focus on the design and on the improvement of warehousing and assembly systems, through the mathematical modelling of both economic and ergonomics aspects. She is usually also involved in various practical interdisciplinary research projects with important Italian companies.
References
- Azadeh, K., R. De Koster, and D. Roy. 2019. “Robotized and Automated Warehouse Systems: Review and Recent Developments.” Transportation Science 53 (4): 917–945. doi: 10.1287/trsc.2018.0873
- Bartholdi, J. J., and S. T. Hackman. 2008. Warehouse & Distribution Science: Release 0.89. Atlanta: Supply Chain and Logistics Institute.
- Battini, D., M. Calzavara, A. Persona, and F. Sgarbossa. 2015a. “A Comparative Analysis of Different Paperless Picking Systems.” Industrial Management & Data Systems 115 (3): 483–503. doi: 10.1108/IMDS-10-2014-0314
- Battini, D., M. Calzavara, A. Persona, and F. Sgarbossa. 2015b. “Order Picking System Design: The Storage Assignment and Travel Distance Estimation (SA&TDE) Joint Method.” International Journal of Production Research 53 (4): 1077–1093. doi: 10.1080/00207543.2014.944282
- Battini, D., M. Calzavara, A. Persona, and F. Sgarbossa. 2017. “Additional Effort Estimation Due to Ergonomic Conditions in Order Picking Systems.” International Journal of Production Research 55 (10): 2764–2774. doi: 10.1080/00207543.2016.1190879
- Battini, D., M. Calzavara, A. Persona, and F. Sgarbossa. 2018. “A Method to Choose Between Carton from Rack Picking or Carton from Pallet Picking.” Computers & Industrial Engineering 126: 88–98. doi: 10.1016/j.cie.2018.09.017
- Battini, D., M. Faccio, A. Persona, and F. Sgarbossa. 2009. “Design of the Optimal Feeding Policy in an Assembly System.” International Journal of Production Economics 121 (1): 233–254. doi: 10.1016/j.ijpe.2009.05.016
- Boudella, M. E. A., E. Sahin, and Y. Dallery. 2016. “A Mathematical Model to Assess the Performance of a Robotic Kitting System in an Assembly Plant.” 11th International Conference on Modeling, Optimization and simulation – MOSIM’16, Montréal, Canada, Aug 2016.
- Boudella, M. E. A., E. Sahin, and Y. Dallery. 2018. “Kitting Optimisation in Just-in-Time Mixed-Model Assembly Lines: Assigning Parts to Pickers in a Hybrid Robot–Operator Kitting System.” International Journal of Production Research 56 (16): 5475–5494. doi: 10.1080/00207543.2017.1418988
- Brynzér, H., and M. I. Johansson. 1995. “Design and Performance of Kitting and Order Picking Systems.” International Journal of Production Economics 41 (1–3): 115–125. doi: 10.1016/0925-5273(95)00083-6
- Caputo, A. C., and P. M. Pelagagge. 2011. “A Methodology for Selecting Assembly Systems Feeding Policy.” Industrial Management & Data Systems 111 (1): 84–112. doi: 10.1108/02635571111099749
- Caputo, A. C., P. M. Pelagagge, and P. Salini. 2015. “A Decision Model for Selecting Parts Feeding Policies in Assembly Lines.” Industrial Management & Data Systems 115 (6): 974–1003. doi: 10.1108/IMDS-02-2015-0054
- Caputo, A. C., P. M. Pelagagge, and P. Salini. 2017a. “Modelling Human Errors and Quality Issues in Kitting Processes for Assembly Lines Feeding.” Computers & Industrial Engineering 111: 492–506. doi: 10.1016/j.cie.2017.04.004
- Caputo, A. C., P. M. Pelagagge, and P. Salini. 2017b. “Modeling Errors in Parts Supply Processes for Assembly Lines Feeding.” Industrial Management & Data Systems 117 (6): 1263–1294. doi: 10.1108/IMDS-08-2016-0333
- Caputo, A. C., P. M. Pelagagge, and P. Salini. 2018. “Selection of Assembly Lines Feeding Policies Based on Parts Features and Scenario Conditions.” International Journal of Production Research 56 (3): 1208–1232. doi: 10.1080/00207543.2017.1407882
- Coelho, F., S. Relvas, and A. P. F. Barbosa-Póvoa. 2018. “Simulation of an Order Picking System in a Manufacturing Supermarket Using Collaborative Robots.” In ECMS, 83–88.
- Comand, N., R. Minto, G. Boschetti, M. Faccio, and G. Rosati. 2019. “Optimization of a Kitting Line: A Case Study.” Robotics 8 (3): 70. doi: 10.3390/robotics8030070
- Daniels, R. L., J. L. Rummel, and R. Schantz. 1998. “A Model for Warehouse Order Picking.” European Journal of Operational Research 105 (1): 1–17. doi: 10.1016/S0377-2217(97)00043-X
- De Koster, R., T. Le-Duc, and K. J. Roodbergen. 2007. “Design and Control of Warehouse Order Picking: A Literature Review.” European Journal of Operational Research 182 (2): 481–501. doi: 10.1016/j.ejor.2006.07.009
- Dubey, V. K., and D. Veeramani. 2017. “A Framework for Sizing an Automated Distribution Center in a Retail Supply Chain.” Simulation Modelling Practice and Theory 75: 113–126. doi: 10.1016/j.simpat.2017.03.014
- El Zaatari, S., M. Marei, W. Li, and Z. Usman. 2019. “Cobot Programming for Collaborative Industrial Tasks: An Overview.” Robotics and Autonomous Systems 116: 162–180. doi: 10.1016/j.robot.2019.03.003
- Fager, P., M. Calzavara, and F. Sgarbossa. 2019. “Kit Preparation with Cobot-Supported Sorting in Mixed Model Assembly.” IFAC-PapersOnLine 52 (13): 1878–1883. doi: 10.1016/j.ifacol.2019.11.476
- Fager, P., M. Calzavara, and F. Sgarbossa. 2020. “Modelling Time Efficiency of Cobot-Supported Kit Preparation.” The International Journal of Advanced Manufacturing Technology 106 (5): 2227–2241. doi: 10.1007/s00170-019-04679-x
- Fager, P., M. I. Johansson, and L. Medbo. 2014. “Quality Problems in Materials Kit Preparation.” In Proceedings of the 6th Swedish Production Symposium.
- Frazelle, E. H., S. T. Hackman, U. Passy, and L. K. Platzman. 1994. The forward-reserve problem, 43–61. New York: John Wiley & Sons, Inc.
- Frazelle, E. H., S. T. Hackman, and L. K. Platzman. 1989. “Improving Order Picking Productivity Through Intelligent Stock Assignment Planning.” In Proceedings of the council of logistics management annual conference, St. Louis, MO, 353–371.
- Glock, C. H., E. H. Grosse, R. M. Elbert, and T. Franzke. 2017. “Maverick Picking: The Impact of Modifications in Work Schedules on Manual Order Picking Processes.” International Journal of Production Research 55 (21): 6344–6360. doi: 10.1080/00207543.2016.1252862
- Grosse, E. H., M. Calzavara, C. H. Glock, and F. Sgarbossa. 2017. “Incorporating Human Factors into Decision Support Models for Production and Logistics: Current State of Research.” IFAC-PapersOnLine 50 (1): 6900–6905. doi: 10.1016/j.ifacol.2017.08.1214
- Grosse, E. H., and C. H. Glock. 2015. “The Effect of Worker Learning on Manual Order Picking Processes.” International Journal of Production Economics 170: 882–890. doi: 10.1016/j.ijpe.2014.12.018
- Grosse, E. H., C. H. Glock, M. Y. Jaber, and W. P. Neumann. 2015. “Incorporating Human Factors in Order Picking Planning Models: Framework and Research Opportunities.” International Journal of Production Research 53 (3): 695–717. doi: 10.1080/00207543.2014.919424
- Gu, J., M. Goetschalckx, and L. F. McGinnis. 2010. “Research on Warehouse Design and Performance Evaluation: A Comprehensive Review.” European Journal of Operational Research 203 (3): 539–549. doi: 10.1016/j.ejor.2009.07.031
- Hanson, R., and L. Medbo. 2019. “Man-Hour Efficiency of Manual Kit Preparation in the Materials Supply to Mass-Customised Assembly.” International Journal of Production Research 57 (11): 3735–3747. doi: 10.1080/00207543.2019.1566653
- Limère, V., H. V. Landeghem, M. Goetschalckx, E. H. Aghezzaf, and L. F. McGinnis. 2012. “Optimising Part Feeding in the Automotive Assembly Industry: Deciding Between Kitting and Line Stocking.” International Journal of Production Research 50 (15): 4046–4060. doi: 10.1080/00207543.2011.588625
- Limère, V., H. Van Landeghem, and M. Goetschalckx. 2015. “A Decision Model for Kitting and Line Stocking with Variable Operator Walking Distances.” Assembly Automation 35 (1): 47–56. doi: 10.1108/AA-05-2014-043
- Sellers, C. J., and S. Y. Nof. 1989. “Performance Analysis of Robotic Kitting Systems.” Robotics and Computer-Integrated Manufacturing 6 (1): 15–24. doi: 10.1016/0736-5845(89)90081-1
- Sgarbossa, F., A. Romsdal, F. Johannson, and T. Krogen. 2020. “Robot Picker Solution in Order Picking Systems: an Ergo-zoning Approach.” IFAC 2020 World Conference.
- Tamaki, K., and S. Y. Nof. 1991. “Design Method of Robot Kitting Sytem for Flexible Assemble.” Robotics and Autonomous Systems 8 (4): 255–273. doi: 10.1016/0921-8890(91)90048-P
- Tompkins, J. A., J. A. White, Y. A. Bozer, and J. M. A. Tanchoco. 2010. Facilities Planning. New Jersey: John Wiley & Sons.