
 ?Mathematical formulae have been encoded as MathML and are displayed in this HTML version using MathJax in order to improve their display. Uncheck the box to turn MathJax off. This feature requires Javascript. Click on a formula to zoom.
ABSTRACT
This paper proposes a data-driven procedure to improve productivity in make-to-stock manufacturing. By leveraging recent developments in information systems research, the paper addresses manufacturing systems with high process complexity and variety. Specifically, the proposed procedure draws upon process mining to dynamically map and analyse manufacturing processes in an automated manner. This way, manufacturers can leverage data to overcome the limitations of existing process mapping methods, which only provide static snapshots of process flows. By bridging data and process science, process mining can exploit hitherto untapped potential for productivity improvement. The proposed procedure is empirically validated at a leading manufacturer of sanitary products. The field test leads to three concrete improvement suggestions for the company. This research contributes to the literature on production research by demonstrating a novel use of process mining in manufacturing and by guiding practitioners in its implementation.
1. Introduction
A central objective of productivity improvement in make-to-stock manufacturing is to increase the rate at which parts flow through a manufacturing system (Hopp and Spearman Citation2008; Schmenner Citation2015; Schmenner and Swink Citation1998). Improving system flow can be achieved by reducing three fundamental roadblocks: (i) bottlenecks, (ii) process variation and (iii) non-value-adding activities (Schmenner Citation2012). Therefore, manufacturers need tools to identify these three issues in their value streams. Creating such transparency in complex manufacturing systems is, however, an arduous task. As a consequence, opportunities for productivity improvement often remain unnoticed.
Manufacturers use process mapping methods to understand the current state of their operations. Many existing methods, such as value stream mapping, seek to identify improvement potentials by first visualising the processes (Rother and Shook Citation2003; Sunk et al. Citation2017). This provides a snapshot of the process flow, based on which manufacturers can analyse inefficiencies at a given point in time. However, because such process mapping tools are static, they are less effective when the process flows dynamically change over time. Moreover, existing manual methods are resource intensive, which limits their applicability in situations with high process complexity. At the same time, the increasing amount of data that is captured in the era of Industry 4.0 offers new opportunities to explore actual process flows in reality (Knoll, Reinhart, and Prüglmeier Citation2019a; Schuh et al. Citation2020a). This motivates the use of data-driven methods to exploit hitherto untapped potential for productivity improvements.
This paper overcomes the limitations of existing methods for process mapping in manufacturing by proposing the use of process mining. Process mining is a recent development in information systems research that models process flows based on event log data (van der Aalst Citation2016). In contrast to manual process mapping, process mining allows analysing process flows dynamically and identifying non-value-adding activities in an automated manner (Schuh et al. Citation2020b). For this reason, process mining is particularly suitable for discovering process deviations and identifying factors that negatively affect productivity. Despite the promising opportunities process mining offers, there is scarce research addressing productivity improvement in manufacturing. This paper addresses this gap in the literature by proposing and validating a procedure for using process mining in make-to-stock manufacturing.
The proposed procedure consists of three phases. The first phase specifies the planned process model (as-designed) and uses process mining to derive the actual process model of a given timeframe (as-realised). The second phase compares the as-designed process model with the as-realised process flows to identify process conformance and factors that limit overall productivity. The third phase derives suitable improvement actions and updates the as-designed master data if needed. To test the proposed procedure and identify the potential of process mining in improving processes in manufacturing, the authors engaged in a field test. The operational value of process mining was validated in one of the factories of Geberit AG (hereafter, Geberit), a leading manufacturer of sanitary products headquartered in Switzerland.
The contribution of this research is threefold. First, it adds a data-driven procedure to the literature on process mapping in manufacturing. Second, it provides empirical evidence that process mining is effective for identifying improvement potential in high-volume, high-mix production lines. Third, by addressing a practice-inspired problem with an innovative procedure, it contributes actionable insights to the emerging literature on Industry 4.0 (e.g. Ivanov et al. Citation2020; Ivanov, Dolgui, and Sokolov Citation2019; Kusiak Citation2018; Xu, Xu, and Li Citation2018).
This paper is structured as follows. Section 2 provides the theoretical background of this paper and reveals the scarcity of process mapping methods designed for manufacturing settings with high process complexity. Section 3 proposes a three-phase procedure to improve productivity in make-to-stock manufacturing via process mining. Section 4 reports the results from a real-world industrial case at Geberit. Section 5 compares the proposed procedure against existing process mapping methods and discusses the implications of this research. Finally, Section 6 concludes the paper.
2. Theoretical background
Industry 4.0 offers promising opportunities for improving manufacturing operations (Ivanov, Dolgui, and Sokolov Citation2019; Kipper et al. Citation2020; Moeuf et al. Citation2018; Xu, Xu, and Li Citation2018). Starting as a state policy to innovate manufacturing in Germany, Industry 4.0 has become an important field for both research and practice (Kagermann, Wahlster, and Helbig Citation2013). The term bundles various emerging technologies that turn factories into cyber-physical systems generating large amounts of data (Kusiak Citation2018; Liao et al. Citation2017; Schumacher, Erol, and Sihn Citation2016). In order to take full advantage of these data assets, they must be ‘mined’ and analysed. However, many manufacturers still struggle to leverage their data for improvements (Kusiak Citation2017). Xu, Xu, and Li (Citation2018) propose four key challenges to firm-level Industry 4.0 deployment, namely technology, collaboration, management and implementation. This research primarily focuses on the last of these, thereby guiding manufacturers with a concrete procedure for improving their productivity through process mining. Two streams of literature are particularly relevant: the rich literature on process productivity and the emerging literature on process mining, as summarised in the following.
2.1. Process productivity
In make-to-stock manufacturing, productivity can be defined by the rate at which units flow through a system (Colledani et al. Citation2014; Ellis et al. Citation2010; Stricker et al. Citation2016) – its throughput rate. Improving the flow through a manufacturing system requires the identification and reduction of bottlenecks, process variation and non-value-adding activities (Schmenner Citation2012).
The bottleneck is the process that constrains the throughput the most (Wiendahl and Hegenscheidt Citation2002). Several bottleneck detection methods have been proposed. For instance, Roser, Lorentzen, and Deuse (Citation2015) perform a ‘bottleneck walk’ to identify the bottleneck by shop floor observations of inventory and process starvation. Other methods include the statistical computation of mean process cycle times or waiting times (Betterton and Silver Citation2012; Hopp and Spearman Citation2008; Scholz-Reiter, Hildebrandt, and Tan Citation2013). A limitation of traditional bottleneck detection methods is their inability to cope with dynamic high-mix production environments.
Process variation is the second concept that affects the productivity of a system. Queuing theory shows mathematically that increased variation reduces the productivity of a process (Hopp and Spearman Citation2008). Processes can vary in many different attributes, such as process cycle times, processed materials, operator decisions, operator movements or machine parameters, among others (Colledani, Matta, and Tolio Citation2010).
Finally, the concept of non-value-adding activities, so-called waste, is central to productivity. The more waste is inherent in a system, the less productive it will be. Waste reduces both the swiftness and evenness of processes. Examples of waste are unnecessary transportation, inventory, motion or waiting, overproduction, over-processing and the production of defects (Gottmann, Pfeffer, and Sihn Citation2013). Lean management sets a focus on reducing the different types of waste from a process. However, these attempts to reduce waste are often limited to single processes and do not consider the whole value stream. A popular procedure to map and analyse waste in a system is Value Stream Mapping (VSM; Rother and Shook Citation2003). However, VSM is a static snapshot method that requires extensive effort to create and maintain (Schuh et al. Citation2020a; Winkler and Lugert Citation2017).
2.2. Process mining
By enabling a low-effort automatic mapping of actual process flows, process mining offers the potential to overcome the challenges mentioned above (cf. van der Aalst Citation2016). The goal of process mining is to discover the actual process flows that were observed within a system (van der Aalst Citation2012). Essentially, it bridges the gap between data science and process science (Garcia et al. Citation2019; van der Aalst Citation2016). In contrast to traditional management tools such as business process management, process mining allows for the dynamic analysis of the actual process flows that were executed.
Process mining utilises event log data that is recorded when executing a process (van der Aalst Citation2016). These event logs can consist of different features describing the context of the events recorded. The minimum required features include a case ID, the description of an activity and a timestamp. The case ID is a unique identifier referring to a single instance, such as a booking number for a flight. The activity describes an action that has been performed, such as check-in or boarding. The timestamp describes the specific time the activity has been performed. Based on this input, process mining generates a process model that reproduces the observed process flows. Note that the above features only represent the minimum information required. More information can be mined, such as the resource with which the process was performed or the cost of the process.
Several algorithms for extracting a process model from an event log exist. The underlying principle of such an algorithm γ is to map event log data L onto a Petri net γ(L). Thereby, the net represents the different traces observed in the event log (van der Aalst Citation2016). One of the first process mining algorithms was the alpha miner, but it is vulnerable to missing data. To date, common process mining algorithms are the heuristic miner, the inductive miner, the fuzzy miner and variations of the alpha miner (Garcia et al. Citation2019; Knoll, Reinhart, and Prüglmeier Citation2019a).
Process mining also offers the opportunity to analyse the conformance of the observed processes by comparing the as-realised process flows with the as-designed process model. The as-designed processes can be modelled, for instance, by applying the standards provided by Petri nets or business process model notation (BPMN). Here, replay fitness is a common measure to quantify the conformance (Rozinat and van der Aalst Citation2008; van der Aalst Citation2016). It evaluates how well the as-designed process model can reproduce the actual cases in the event log (i.e. as-realised). Other measures include precision (examines underfitting of the model) and generalisation (examines overfitting of the model).
There are several generic methods for the implementation of process mining. One example is the L* lifecycle model, which consists of the following five stages: plan and justify, extract, create a control-flow model, create an integrated process model and operational support (van der Aalst Citation2012). Knoll, Reinhart, and Prüglmeier (Citation2019a) propose a four-step methodology for multi-dimensional process mining. This methodology is based on the Process Mining Project Methodology (PM2), which provides a generic method for a process mining project (van Eck et al. Citation2015). However, to date, there is limited evidence for the utility of the proposed methods for productivity improvement within manufacturing.
In recent years, the amount of data collected in manufacturing has increased exponentially (Monostori et al. Citation2016). Consequently, many manufacturing companies already collect relevant process data in their information systems (e.g. enterprise resource planning, manufacturing execution system, warehouse management system). Process mining can help exploit these data assets by creating transparency about the real-world processes and allowing for subsequent analysis. However, much of the research on process mining has focused on the service industry (e.g. insurance, banking, healthcare), and studies in manufacturing settings are rare (e.g. Farooqui et al. Citation2020; Park, Lee, and Zhu Citation2014; Rozinat et al. Citation2009).
Evaluating the potential of process mining in manufacturing can benefit from an intervention in a real-world factory. This paper provides a holistic overview of how process mining can improve productivity in make-to-stock manufacturing.
3. Proposed procedure
This section presents a three-phase procedure for using process mining to improve productivity in make-to-stock manufacturing. Following Schmenner (Citation2012), the procedure addresses the three components that affect the flow of a manufacturing system, namely bottlenecks, process variation and non-value-adding activities. The proposed procedure utilises event logs typically stored in manufacturing information systems to map the actual process flows in a factory. Unlike manual process mapping, the proposed procedure allows analysing process flows dynamically and discovering non-value-adding activities in an automated manner. This way, processes that constrain productivity can be identified both effectively and efficiently.
3.1. Problem statement
The goal of this research is to improve the productivity of manufacturing systems by maximising throughput. Following Little's law, the throughput rate is inversely proportional to the average time a part spends in a system (Little Citation1961). Therefore, to optimise the throughput of a manufacturing system, it is necessary to minimise the average throughput time. Formally, let denote the throughput time of part
and
the total number of parts a factory produces. Then, the objective is to operate a manufacturing system such that
(1)
(1) As discussed, the throughput time in a manufacturing system is affected by bottlenecks, process variation and non-value-adding activities (Schmenner Citation2012). Reducing throughput times requires an understanding of how single parts actually flow through a manufacturing system. Traditional methods for process mapping are mostly manual and lack the ability to model the actual process flows dynamically; that is, they cannot map how the process flows change over time. The proposed procedure based on process mining addresses these limitations by automatically extracting an as-realised process model from event log data.
3.2. Formalisation of procedure
The proposed procedure consists of three phases: (i) map, (ii) analyse and (iii) improve (Figure ). In the first phase, the user defines the as-designed process model and applies a process mining algorithm to extract the as-realised process model from an event log. The as-designed process model describes the intended flow through a manufacturing system, whereas the as-realised process model reproduces the actual flow through a manufacturing system. In the second phase, the user analyses wasteful activities through the as-realised process model and compares the actual process flows with the as-designed process model. In the third phase, the user determines improvement actions based on the previous phase and updates existing deviations in the master data. The three phases should be repeated routinely.
Figure 1. Process mining procedure for productivity improvement in manufacturing.
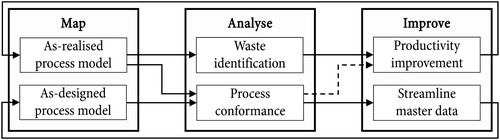
Phase 1: map. The proposed procedure utilises the standard Business Process Model Notation (BPMN) to derive the as-designed process model. This process model is based on existing work plans with master data and shop floor observations. The data input for the as-realised process model is given by case IDs, activities and timestamps. In a manufacturing context, the case ID can describe a unique identifier for a specific part produced in the factory. The activity variable indicates which specific process was performed on the part. The timestamp indicates when a process started, finished or both. This information is typically stored in manufacturing information systems and must be pre-processed according to the format required for process mining (see Table ). The resulting event log specifies what process has been performed on which part at a given time. Based on this input, the as-realised process model is constructed automatically by applying a process mining algorithm. The output provides a dynamic representation of as-realised process flows. Both the as-designed and as-realised process models serve as a basis for the subsequent analysis phase.
Table 1. Format of exemplary event log for process mining.
Phase 2: analyse. The as-realised process model provides insights into how single parts flow through a manufacturing system. This allows identifying bottlenecks, excess inventory and unnecessary material movement. Bottlenecks can be located by assessing the cycle times of processes. Formally, a bottleneck is located at the process for which the cycle time
is maximised.
Unlike manual process mapping, process mining enables the investigation of cycle times dynamically over time. This way, the proposed procedure also takes shifting or variant-specific bottlenecks into account. Excess inventory can be uncovered by analysing the reconstructed flows to and from single processes, whereas unnecessary material movements are inferred via deviations from the intended process flow.
To evaluate how well the intended process flow conforms to the actual sequence of activities, the proposed procedure estimates the replay fitness of the as-designed process model. Let describe a trace in the event log L (i.e. a sequence of activities) and
define the as-designed process model. Then, the trace-level replay fitness can be computed via
(2)
(2) where
corresponds to missing,
to consumed,
to remaining and
to produced tokens in the model (van der Aalst Citation2016). Tokens are basic elements of the process model indicating whether an activity was recorded in the sequence defined (van der Aalst Citation2016). To obtain a conformance measure for all observed traces, the replay fitness is computed at the event log level. A replay fitness of 1 (i.e. no missing or remaining tokens) suggests that the actual process flow entirely conforms to the as-designed process model. In contrast, a replay fitness of 0 (i.e. all tokens are missing or remaining) indicates the as-designed process model cannot describe the actual process behaviour at all. For more details on conformance checking, see van der Aalst (Citation2016).
Phase 3: improve. Based on the previous phase, two different types of actions can be taken. First, the process conformance provides information that streamlines the as-designed master data. Second, the findings derived by the waste analysis are used to enhance the productivity of the real manufacturing system. Ultimately, both actions inform the first phase of the proposed procedure by updating the as-designed and as-realised processes.
4. Validation in an industrial case
This section presents the results from a real-world implementation in an industrial case. First, the empirical setting is described before each step of the proposed procedure is demonstrated using production data from the case company.
4.1. Empirical setting
This research was carried out at Geberit, a Swiss producer of sanitary products. Geberit has an annual turnover of around USD 3.4 billion (2019) and employs 12,000 people in 50 countries (Geberit AG Citation2020). Geberit is a European leader in the market for sanitary products. The product portfolio of the company includes sanitary systems, piping systems and bathroom ceramics, which are produced in 29 factories. The empirical validation of the proposed procedure was carried out in a factory located in Rapperswil-Jona, Switzerland.
The factory operates multiple semi-automated manufacturing lines producing products to stock based on forecasts. The product considered in this research is a plastic actuator plate that is fabricated in 18 different variants. These parts are produced in five sequential processes j: (1) Moulding, (2) Assembly 1, (3) Assembly 2, (4) Sorting and (5) Packaging. Depending on the process, there is a varying number of machines that can carry out a process. Geberit has equipped these machines with data matrix code readers
that automatically scan the part identification number and record a timestamp when a part is processed. The aim of this research is to suggest improvement actions for increasing the throughput of production lines – that is, minimising the average time between moulding and packaging.
To identify factors limiting the overall throughput, Geberit provided a dataset containing the event logs for more than 700,000 events that were logged in spring 2019. The dataset is pre-processed according to the requirements for process mining. The case instances are defined by part IDs that are unique for each plastic actuator plate produced by the company. The activities are specified by the data matrix code readers installed at different machines in the manufacturing system. The timestamps are given by the scan time indicating when an actuator plate is processed at a specific machine. The event log is generated by mapping the unique part IDs and the reader information with the corresponding timestamps recorded in the factory (Table ). In the following, each phase of the proposed procedure is demonstrated separately.
Table 2. Event log for process mining at Geberit.
4.2. Empirical results
4.2.1. Phase 1: map
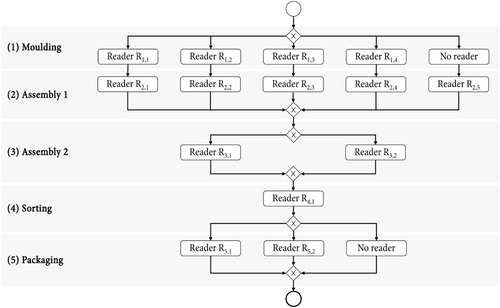
In the first step, the as-designed process model is constructed using BPMN (Figure ). The as-designed process model specifies the intended material flow through the manufacturing system. The first area of the manufacturing system is given by five parallel lines performing the first two processes (i.e. Moulding and Assembly 1). A conveyor system then transports the parts to the second assembly process, where the parts are finalised on two lines (i.e. Assembly 2). Then, a robot batches the parts according to different variants and places the parts into a rack (i.e. Sorting). Finally, the parts are manually loaded into three automated lines for packaging (i.e. Packaging).
Figure 2. As-designed process model.
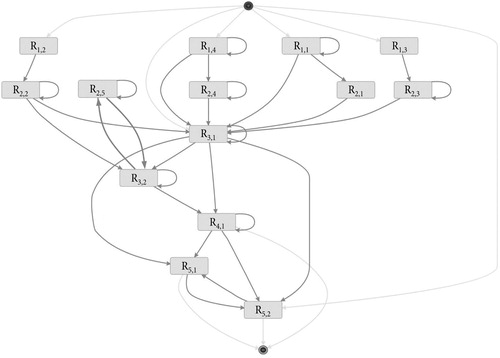
The event log from the production lines is mined through process mining to derive the as-realised process model (Figure ). The as-realised process model automatically visualises the traces the parts took during the observed time frame. To improve readability, only the paths that were recorded the most often (first quartile) are shown. Note that due to two missing readers in the moulding and packaging processes, two machine locations are not visualised.
Figure 3. As-realised process model.
4.2.2. Phase 2: analyse
The as-realised process model reveals that not all traces conform to the intended process flow. This is indicated by loops within the processes or flows in the wrong direction (see Figure ). The process conformance is evaluated by comparing the actual process flow of each part with the as-designed process model. For this, the replay fitness of the as-designed process model is computed. Since all the variants flow through the same processes, multi-dimensional process mining is not required. The results of the conformance analysis yield an average fitness of 0.76. The nonconformities in the event log can be explained as follows. First, some of the unplanned process behaviour is related to rework. Second, data quality can be a driver of deviations.
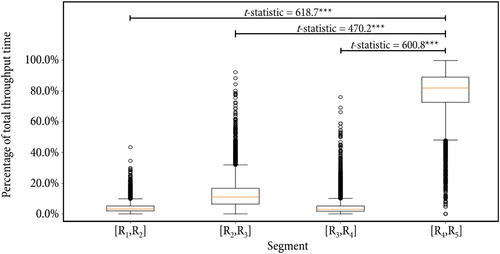
The as-realised process model is now used to determine the time intervals between different readers. Henceforward, these time intervals are referred to as segments. Figure shows the durations of the segments relative to the total throughput time. The segment with the highest average duration (i.e. ) points towards a bottleneck. Three separate Welch's t-tests confirm that the duration of segment
is significantly higher compared to all other segments. In the following, the critical segment is dynamically analysed to identify potential improvement areas.
Figure 4. Percentage of total throughput time per segment.
Notes: The figure only contains complete cases. The whisker length is the 1.5 interquartile range and the median is highlighted as yellow line. Significance level: *** p < 0.001, **p < 0.01, *p < 0.05.
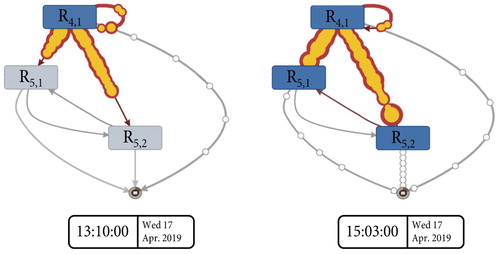
In segment , the parts are automatically sorted by product variants and then batched into mobile racks. The packaging lines are then manually loaded by an operator. Once a part enters a packaging line, it is scanned by the readers
or
(note that one of the three available packaging lines is not equipped with a reader). Figure compares the process flows at two different points in time. In the left-hand visualisation, the dynamic analysis of the process flows reveals that the packaging line is unnecessarily idle (59 min in total). This is unexpected since enough parts that could be packaged have already passed reader
at the sorting process at this time. This can be considered as waste because the bottleneck is not exploited efficiently. Several similar cases, where the packaging line runs unnecessarily idle, were observed in the dataset. In contrast, the right-hand visualisation shows efficient reloading of the packaging line with an almost constant flow. Overall, the visualisations highlight the need for analysing process flows dynamically.
Figure 5. Visualisation of historical process flows at capacity constraint.
Three potential reasons for the idle packaging lines were identified together with domain experts at Geberit. First, the shift change at 13:00 h can lead to material waiting times. Second, although there are no additional setup times reported by the company, inefficiencies can also occur when there is a change of the product variant. Third, full racks can go unnoticed. Next, three specific improvement actions are proposed to improve the productivity of the manufacturing system.
4.2.3. Phase 3: improve
The previous analysis revealed that the capacity constraint is located between sorting and packaging. Therefore, the following three improvement actions were proposed to Geberit.
The packaging lines should be loaded directly before a shift change to minimise idle time.
The production scheduling should be optimised according to the actual changeover times between product variants. This includes the update of the as-designed master data with the changeover matrix retrieved from the as-realised process model.
The sorting process for high-volume product variants should be removed, and the loading of the packaging lines should be automated.
For the future, Geberit decided to move ahead with considering these options, having already started implementing the third action.
5. Discussion
Applying the proposed procedure for using process mining in manufacturing has resulted in useful insights for research and tangible benefits for the case company. Next the proposed procedure is discussed in light of existing methods for process mapping, challenges related to its implementation and its applicability beyond the case presented in this research.
5.1. Comparison to existing methods
The field test at Geberit demonstrated the potential of process mining to overcome limitations of traditional methods for process mapping. Two challenges considerably impede the usability of alternative, traditional methods; they can neither analyse process flows dynamically, nor trace the paths of single parts in the value chain. Hence, traditional methods could not have captured the complexity or the dynamics within the empirical setting at Geberit. In the following, we provide a qualitative comparison between traditional methods and the extended functionalities of the presented procedure.
Modelling the process flow through VSM – one of the most popular process mapping tools – would only capture the average cycle times of processes. However, it would not have been possible to directly analyse when and why specific problems occur. Furthermore, in the case that the cycle time measurements are performed directly on the shop floor with human observations, as originally proposed by Rother and Shook (Citation2003), the data collection is restricted to a limited observation period. Provided the VSM is conducted during a timeframe where certain time-dependent phenomena were not observed (e.g. material waiting times due to shift changes), outlier events would have gone unnoticed. Similar limitations also apply to other static mapping methods, such as bottleneck walks (Roser, Lorentzen, and Deuse Citation2015).
The proposed procedure also allows for analysing all the different routes that all parts have taken through the manufacturing system. Again, traditional process mapping techniques do not capture the holistic and dynamic material routings. Process mining enables to identify and follow the paths of specific parts that reduce throughput. Note that the actual process flows could also not have been mapped by available business intelligence solutions, which focus on reporting and visualisation of performance measures rather than the analysis of flows (cf. van der Aalst Citation2016).
5.2. Challenges related to implementation
The presented work promises widespread applicability in manufacturing settings with highly automated data capture and unknown or moving capacity constraints. However, although the potential of the proposed procedure has been demonstrated, there are several challenges related to its implementation.
One general challenge is related to the identification of suitable business cases. This challenge is omnipresent in the literature on digitalisation of manufacturing. In Geberit, the presented procedure was used on a single make-to-stock setting with capacity problems. Moreover, the production lines had already been retro-fitted with data matrix readers and hence incurred no extra setup costs. For other companies, the establishment of data capture technologies can be a major inhibitor. In addition, process mining software must be acquired, often at a considerable cost. Identifying a positive business case before investments may be difficult in settings other than the one presented.
A second challenge is that data in manufacturing are often incomplete and stored in different formats and locations. The accuracy of the extracted process models strongly depends on the completeness of event logs. Too many missing observations can lead to incorrect conclusions because the modelled process flows do not match the actual process flows. For this reason, process mining is more suitable for manufacturing settings with a high degree of automation. Although the amount of data that is generated in manufacturing is increasing drastically (Monostori et al. Citation2016), it is often not readily available in a suitable format (Xu, Xu, and Li Citation2018). Therefore, pre-processing data for analyses can involve considerable manual effort. Furthermore, the required data might not yet be captured from the physical process. In manufacturing, it is costly to replace older machines having limited sensory abilities. Hence, many manufacturers, like Geberit, have incrementally introduced automated data capture by retrofitting existing production lines. However, despite the highly automated nature of the empirical setting, the authors encountered lines that did not yet have readers to track the entire flow of the material. This might limit the scope of analysis and improvement actions that can be derived from process mining.
A third challenge arises when one aims to analyse the flow of several products that are assembled together, which requires merging case IDs. This is non-trivial and a current field of research for the further development of process mining algorithms (cf. Raichelson, Soffer, and Verbeek Citation2017; Schuh et al. Citation2020b; van der Aalst Citation2019). This is particularly challenging for manufacturing processes, where the level of the analysed entity changes – for instance, when a manufacturing order consists of multiple assembly orders for multiple products, or when parts are looping back to previous processes. As shown in the case study, mining data on the serial number of the product already reveals valuable insights for productivity improvement within manufacturing.
A fourth challenge is that process mining can require an extensive coordination effort between process owners. This is particularly the case for long value streams. Process understanding is necessary to suggest suitable improvement actions (cf. Calvanese et al. Citation2016; Knoll, Waldmann, and Reinhart Citation2019b). Although the process mining algorithm extracts the process model automatically from the event logs, the proposed procedure involves manual analyses. Notably, the third phase of the proposed procedure may require profound domain expertise to address the underlying reasons for existing deviations.
A fifth challenge is maintaining data management discipline. When collecting and storing data in centralised systems, communication about which data to store in what way is crucial. Process mining supports manufacturers with this issue by providing simple and clear data requirements. It becomes evident for the process owners which data is relevant but missing. These instructions are important to guide data acquisition on the shop floor.
5.3. Generalisation and future work
Although the proposed procedure was validated in a single case study, it should generalise to similar make-to-stock production settings. The empirical setting is representative for a typical manufacturer with high degrees of data capture and the need to improve throughput by identifying and reducing constraints, variability and waste. Whenever an activity can be linked to a specific product unit with a timestamp, process mining can be employed. Especially in discrete manufacturing the procedure applies, because discrete products can often be uniquely identified. In process industries, batch numbers may be a viable alternative as the case ID before the discretisation point.
Besides productivity improvement in the factory, there is a wide range of other promising applications for process mining within the manufacturing domain. For instance, in the value chain, one can include the suppliers’ processes for end-to-end process mining. Specific challenges (in addition to the five mentioned before) arise here in regard to adapting the algorithms to merge event logs of different abstraction levels (e.g. manufacturing order and part number).
There exist promising opportunities for future research in this area. In production management, further use cases can be identified and studied. For instance, process mining can be used in quality management to compare the operators’ actions with standard operating procedures (Dasani et al. Citation2015). Future research can examine the effect of deviations from the intended behaviour in manufacturing and evaluate the results. Further, operational cost optimisation by estimating the manufacturing cost of different traces provides an interesting research avenue (Tu and Song Citation2016). Finally, considering the recent trend in the literature on sustainability in manufacturing, there is potential for the intersection of process mining and sustainable operations (Garcia et al. Citation2019).
6. Conclusion
Traditional process mapping requires extensive manual effort and provides only a static overview of a manufacturing system. This paper proposed a procedure based on process mining that overcomes the limitations of traditional mapping methods. The dynamic discovery of actual process flows in factories enables the identification of capacity constraints, process variability and waste. For this purpose, a three-phase procedure was proposed. The procedure was validated in a real-world manufacturing setting at Geberit. A field test showed that process mining is effective in revealing the conformance of processes and opportunities for productivity improvement.
This paper provides insights into how process mining can be used in manufacturing, what benefits it can provide and what specific challenges arise. Evidently, manufacturing applications of process mining have great potential, which also leaves rich opportunities for further research. For practitioners, the paper offers an actionable procedure on how to use process mining in manufacturing and discusses which challenges must be overcome.
Acknowledgements
The authors are indebted to Geberit and Dr. Philip Roh for supporting and enabling the field research in this paper. The authors also thank Disco and ProM for providing their software for academic purposes.
Disclosure statement
No potential conflict of interest was reported by the authors.
Additional information
Notes on contributors

Rafael Lorenz
Rafael Lorenz is a Research Associate at the Chair of Production and Operations Management at ETH Zurich (www.pom.ethz.ch). His research is concerned with the effective use of data in manufacturing systems and appears in journals such as the International Journal of Operations and Production Management (IJOPM). For his research, he received several academic awards for young researchers such as the Young Author Award from the International Federation of Automation and Control (IFAC).

Julian Senoner
Julian Senoner is a Research Associate at the Chair of Production and Operations Management (www.pom.ethz.ch) at ETH Zurich, Switzerland. In his research, he collaborates with leading industrial companies to explore how manufacturers can use Artificial Intelligence to improve productivity. His research has received multiple academic awards for young researchers, including the ETH Medal and the Harry Boer Best Paper Award by the European Operations Management Association (EurOMA).

Wilfried Sihn
Wilfried Sihn joined the TU Wien in 2004 as a Professor for Industrial and System Engineering at the Institute of Management Sciences. He was also head of the institute between 2009 and 2010, as well as 2016 and 2017. He has been active in the field of applied research for more than 30 years now, participating in more than 300 industrial projects, with partners from all over the world. His areas of expertise include production management, factory planning, order management, life-cycle management and maintenance. In 2008, he was appointed Managing Director of the newly founded Fraunhofer Austria Research GmbH.

Torbjørn Netland
Torbjørn Netland is the Head of Chair of Production and Operations Management (www.pom.ethz.ch) and Assistant Professor at ETH Zurich, Switzerland. He is a Member of the World Economic Forum's Global Future Council on Advanced Manufacturing and Production. His research appears in leading scientific journals, including the Journal of Operations Management, Production and Operations Management, MIT Sloan Management Review, International Journal of Production Research, and others. He is the recipient of two Shingo Research Awards and several teaching awards.
References
- Betterton, C. E., and S. J. Silver. 2012. “Detecting Bottlenecks in Serial Production Lines – A Focus on Interdeparture Time Variance.” International Journal of Production Research 50 (15): 4158–4174. doi:10.1080/00207543.2011.596847. doi: 10.1080/00207543.2011.596847
- Calvanese, D., M. Montali, A. Syamsiyah, and W. M. P. van der Aalst. 2016. “Ontology-Driven Extraction of Event Logs from Relational Databases.” In Business Process Management Workshops: BPM 2015, 13th International Workshops, Innsbruck, Austria, August 31-September 3, 2015: Revised Papers. Vol. 256, edited by Manfred Reichert, and Hajo A. Reijers, 140–153. Lecture Notes in Business Information Processing 256. Switzerland [Cham]: Springer.
- Colledani, M., A. Matta, and T. Tolio. 2010. “Analysis of the Production Variability in Multi-Stage Manufacturing Systems.” CIRP Annals 59 (1): 449–452. doi:10.1016/j.cirp.2010 .03.142. doi: 10.1016/j.cirp.2010.03.142
- Colledani, M., T. Tolio, A. Fischer, B. Iung, G. Lanza, R. Schmitt, and J. Váncza. 2014. “Design and Management of Manufacturing Systems for Production Quality.” CIRP Annals 63 (2): 773–796. doi:10.1016/j.cirp.2014.05.002. doi: 10.1016/j.cirp.2014.05.002
- Dasani, S., S. L. Shah, T. Chen, J. Funnell, and R. W. Pollard. 2015. “Monitoring Safety of Process Operations Using Industrial Workflows.” IFAC-PapersOnLine 48 (8): 451–456. doi:10.1016/j.ifacol.2015.09.009. doi: 10.1016/j.ifacol.2015.09.009
- Ellis, K. P., R. D. Meller, J. H. Wilck, P. J. Parikh, and F. Marchand. 2010. “Effective Material Flow at an Assembly Facility.” International Journal of Production Research 48 (23): 7195–7217. doi:10.1080/00207540903186266. doi: 10.1080/00207540903186266
- Farooqui, A., K. Bengtsson, P. Falkman, and M. Fabian. 2020. “Towards Data-Driven Approaches in Manufacturing: An Architecture to Collect Sequences of Operations.” International Journal of Production Research 57: 1–17.
- Garcia, C. d. S., A. Meincheim, E. R. Faria Junior, M. R. Dallagassa, D. M. V. Sato, D. R. Carvalho, E. A. P. Santos, and E. E. Scalabrin. 2019. “Process Mining Techniques and Applications – A Systematic Mapping Study.” Expert Systems with Applications 133: 260–295. doi: 10.1016/j.eswa.2019.05.003
- Geberit AG. 2020. “Geberit Annual Report 2019.” Accessed November 24, 2020. https://www.geberit.com/medien/reporting-center/medienmitteilungen/.
- Gottmann, J., M. Pfeffer, and W. Sihn. 2013. “Process Oriented Production Evaluation.” Procedia CIRP 12: 336–341. doi: 10.1016/j.procir.2013.09.058
- Hopp, W. J., and M. L. Spearman. 2008. Factory Physics. 3rd ed., internat. ed. The McGraw-Hill/Irwin series. Boston: McGraw-Hill/Irwin.
- Ivanov, D., A. Dolgui, and B. Sokolov. 2019. “The Impact of Digital Technology and Industry 4.0 on the Ripple Effect and Supply Chain Risk Analytics.” International Journal of Production Research 57 (3): 829–846. doi:10.1080/00207543.2018.1488086. doi: 10.1080/00207543.2018.1488086
- Ivanov, D., C. S. Tang, A. Dolgui, D. Battini, and A. Das. 2020. “Researchers’ Perspectives on Industry 4.0: Multi-Disciplinary Analysis and Opportunities for Operations Management.” International Journal of Production Research, 1–24. doi:10.1080/00207543.2020.1798035.
- Kagermann, H., W. Wahlster, and J. Helbig. 2013. “Securing the future of German manufacturing industry: Recommendations for implementing the strategic initiative industrie 4.0.” Final report of the Industrie, 4.0.
- Kipper, L. M., L. B. Furstenau, D. Hoppe, R. Frozza, and S. Iepsen. 2020. “Scopus Scientific Mapping Production in Industry 4.0 (2011–2018): A Bibliometric Analysis.” International Journal of Production Research 58 (6): 1605–1627. doi:10.1080/00207543.2019.1671625. doi: 10.1080/00207543.2019.1671625
- Knoll, D., G. Reinhart, and M. Prüglmeier. 2019a. “Enabling Value Stream Mapping for Internal Logistics Using Multidimensional Process Mining.” Expert Systems with Applications 124: 130–142. doi: 10.1016/j.eswa.2019.01.026
- Knoll, D., J. Waldmann, and G. Reinhart. 2019b. “Developing an Internal Logistics Ontology for Process Mining.” Procedia CIRP 79: 427–432. doi: 10.1016/j.procir.2019.02.116
- Kusiak, A. 2017. “Smart Manufacturing Must Embrace Big Data.” Nature 544 (7648): 23–25. doi:10.1038/544023a. doi: 10.1038/544023a
- Kusiak, A. 2018. “Smart Manufacturing.” International Journal of Production Research 56 (1-2): 508–517. doi:10.1080/00207 543.2017.1351644. doi: 10.1080/00207543.2017.1351644
- Liao, Y., F. Deschamps, E. d, F. R. Loures, and L. F. P. Ramos. 2017. “Past, Present and Future of Industry 4.0 - a Systematic Literature Review and Research Agenda Proposal.” International Journal of Production Research 55 (12): 3609–3629. doi:10.1080/00207543.2017.1308576. doi: 10.1080/00207543.2017.1308576
- Little, J. D. C. 1961. “A Proof for the Queuing Formula: L= λ W.” Operations Research 9 (3): 383–387. http://www.jstor.org/stable/167570. doi: 10.1287/opre.9.3.383
- Moeuf, A., R. Pellerin, S. Lamouri, S. Tamayo-Giraldo, and R. Barbaray. 2018. “The Industrial Management of SMEs in the Era of Industry 4.0.” International Journal of Production Research 56 (3): 1118–1136. doi:10.1080/00207543.2017 .1372647. doi: 10.1080/00207543.2017.1372647
- Monostori, L., B. Kádár, T. Bauernhansl, S. Kondoh, S. Kumara, G. Reinhart, O. Sauer, G. Schuh, W. Sihn, and K. Ueda. 2016. “Cyber-physical Systems in Manufacturing.” CIRP Annals 65 (2): 621–641. doi:10.1016/j.cirp.2016.06.005. doi: 10.1016/j.cirp.2016.06.005
- Park, J., D. Lee, and J. Zhu. 2014. “An Integrated Approach for Ship Block Manufacturing Process Performance Evaluation: Case from a Korean Shipbuilding Company.” International Journal of Production Economics 156: 214–222. doi: 10.1016/j.ijpe.2014.06.012
- Raichelson, L., P. Soffer, and E. Verbeek. 2017. “Merging Event Logs: Combining Granularity Levels for Process Flow Analysis.” Information Systems 71: 211–227. doi: 10.1016/j.is.2017.08.010
- Roser, C., K. Lorentzen, and J. Deuse. 2015. “Reliable Shop Floor Bottleneck Detection for Flow Lines Through Process and Inventory Observations: The Bottleneck Walk.” Logistics Research 8 (1): 443. doi:10.1007/s12159-015-0127-2.
- Rother, M., and J. Shook. 2003. Learning to See: Value Stream Mapping to add Value and Eliminate Muda. Version 1.3. Cambridge, Mass: Lean Enterprise Institute.
- Rozinat, A., I. S. M. de Jong, C. W. Gunther, and W. M. P. van der Aalst. 2009. “Process Mining Applied to the Test Process of Wafer Scanners in ASML.” IEEE Transactions on Systems, Man, and Cybernetics, Part C (Applications and Reviews) 39 (4): 474–479. doi:10.1109/TSMCC.2009.2014169.
- Rozinat, A., and W. M. P. van der Aalst. 2008. “Conformance Checking of Processes Based on Monitoring Real Behavior.” Information Systems 33 (1): 64–95. doi:10.1016/j.is.2007 .07.001. doi: 10.1016/j.is.2007.07.001
- Schmenner, R. W. 2012. Getting and Staying Productive: Applying Swift, Even Flow to Practice. Cambridge: Cambridge University Press.
- Schmenner, R. W. 2015. “The Pursuit of Productivity.” Production and Operations Management 24 (2): 341–350. doi:10.1111/poms.12230. doi: 10.1111/poms.12230
- Schmenner, R. W., and M. L. Swink. 1998. “On Theory in Operations Management.” Journal of Operations Management 17 (1): 97–113. doi:10.1016/S0272-6963(98)00028-X. doi: 10.1016/S0272-6963(98)00028-X
- Scholz-Reiter, B., T. Hildebrandt, and Y. Tan. 2013. “Effective and Efficient Scheduling of Dynamic job Shops–Combining the Shifting Bottleneck Procedure with Variable Neighbourhood Search.” CIRP Annals 62 (1): 423–426. doi:10.1016/j .cirp.2013.03.047. doi: 10.1016/j.cirp.2013.03.047
- Schuh, G., A. Gützlaff, S. Cremer, and M. Schopen. 2020a. “Understanding Process Mining for Data-Driven Optimization of Order Processing.” Procedia Manufacturing 45: 417–422. doi: 10.1016/j.promfg.2020.04.046
- Schuh, G., A. Gützlaff, S. Schmitz, and W. M. P. van der Aalst. 2020b. “Data-based Description of Process Performance in end-to-end Order Processing.” CIRP Annals, doi:10.1016/j.cirp.2020.03.013.
- Schumacher, A., S. Erol, and W. Sihn. 2016. “A Maturity Model for Assessing Industry 4.0 Readiness and Maturity of Manufacturing Enterprises.” Procedia CIRP 52: 161–166. doi: 10.1016/j.procir.2016.07.040
- Stricker, N., A. Pfeiffer, E. Moser, B. Kádár, and G. Lanza. 2016. “Performance Measurement in Flow Lines – Key to Performance Improvement.” CIRP Annals 65 (1): 463–466. doi:10.1016/j.cirp.2016.04.031. doi: 10.1016/j.cirp.2016.04.031
- Sunk, A., P. Kuhlang, T. Edtmayr, and W. Sihn. 2017. “Developments of Traditional Value Stream Mapping to Enhance Personal and Organisational System and Methods Competencies.” International Journal of Production Research 55 (13): 3732–3746. doi:10.1080/00207543.2016.1272764. doi: 10.1080/00207543.2016.1272764
- Tu, T. B. H., and M. Song. 2016. “Analysis and Prediction Cost of Manufacturing Process Based on Process Mining.” In ICIMSA 2016: 2016 International Conference on Industrial Engineering, Management Science and Applications: May 23rd-May 26th 2016, Jeju Island, Korea, edited by ICIMSA, 1–5. Piscataway, NJ: IEEE.
- van der Aalst, W., et al. 2012. “Process Mining Manifesto.” In Business Process Management Workshop 2011 99: 169–194. doi: 10.1007/978-3-642-28108-2_19
- van der Aalst, Wil, ed. 2016. Process Mining: Data Science in Action. 2nd ed. New York, NY: Springer Berlin Heidelberg.
- van der Aalst, W. M. P. 2019. “Object-Centric Process Mining: Dealing with Divergence and Convergence in Event Data.” In Software Engineering and Formal Methods: 17th International Conference, SEFM 2019, Oslo, Norway, September 18-20, 2019, Proceedings / Peter Csaba Ölveczky, Gwen Salaün (eds.). Vol. 11724, edited by Peter C. Ölveczky, and G. Salaün, 3–25. LNCS Sublibrary: SL1 - Theoretical computer science and general issues 11724. Cham, Switzerland: Springer.
- van Eck, M. L., X. Lu, S. J. Leemans, and W. van der Aalst. 2015. “PM2: A Process Mining Project Methodology.” In Lecture Notes in Computer Science. Vol. 9097, edited by J. Zdravkovic, M. Kirikova, and P. Johannesson, 9097 vols, 297–313. LNCS sublibrary. SL 3, Information systems and applications, incl. Internet/Web and HCI 9097. Cham: Springer.
- Wiendahl, H.-P., and M. Hegenscheidt. 2002. “Bottleneck Analysis of Assembly Lines with Characteristic Curves.” CIRP Annals 51 (1): 15–19. doi:10.1016/S0007-8506(07)61456-5. doi: 10.1016/S0007-8506(07)61456-5
- Winkler, H., and A. Lugert. 2017. Die Wertstrommethode im Zeitalter von Industrie 4.0 - Studienreport. Cottbus: BTU Cottbus - Senftenberg. http://nbn-resolving.de/urn:nbn:de:kobv:co1-opus4-41205.
- Xu, L. D., E. L. Xu, and L. Li. 2018. “Industry 4.0: State of the art and Future Trends.” International Journal of Production Research 56 (8): 2941–2962. doi:10.1080/00207543.2018 .1444806. doi: 10.1080/00207543.2018.1444806