
 ?Mathematical formulae have been encoded as MathML and are displayed in this HTML version using MathJax in order to improve their display. Uncheck the box to turn MathJax off. This feature requires Javascript. Click on a formula to zoom.
ABSTRACT
In both manual and automated warehouses, a combination of efficient zoning and picker routing plays an important role in improving travel time, congestion, and system throughput. This paper considers the order picker routing problem in a dynamic and synchronised zoning environment, where the items corresponding to each customer order are picked simultaneously in multiple zones, and zones may change between different orders. The objective is to minimise the maximum time of completing the picking activities in any zone. Using a min–max type of objective not only minimises the makespan of an order picking wave, but it also helps balance the workload of the order pickers more effectively. We present a mathematical model for the optimal solution of this problem, as well as a dynamic programming approach to find the optimal solution for the case where a zone is a set of adjacent aisles. Computational experiments on randomly generated instances show that the dynamic programming approach is able to find optimal solutions in negligible computational times.
1. Introduction
In order picking operations, items must be collected from the warehouse to satisfy the customer demand while aiming to optimise a cost or/and service-related objective (e.g. De Koster, Le-Duc, and Roodbergen Citation2007; Scholz et al. Citation2016; Van Gils et al. Citation2018; Çelik and Süral Citation2019; Masae, Glock, and Grosse Citation2020). In the last decades, a growing competition with limited time windows has put extra pressure on order picking operations. Furthermore, the increasing demands from online retailing have resulted in many relatively small-size orders with promised time windows, which make effective order picking and workload balancing necessary (Ardjmand et al. Citation2018; Vanheusden et al. Citation2020). Consequently, warehouse managers are under increased pressure to make use of their order picking resources in an efficient manner.
One way of ensuring a more efficient order picking process in terms of response time is the use of zone-picking. Zone-picking is a method of order picking where the picking area is divided into a number of zones so that the picking activity is being conducted at each zone by a different picker, sequentially or synchronously. Zone-picking also has other advantages including reduction of the travel time, achieving better workload balance, avoiding congestion within aisles, and ensuring familiarity of pick locations.
Although zone-picking and batch-picking are the two main factors influencing the performance of order picking processes at tactical and operational levels, zone-picking has received less attention in the literature among all order picking operations (Yu and de Koster Citation2009). Synchronised zone-picking refers to the zone-picking process where all pickers work on the same order simultaneously, thus creating a picking wave, whereas dynamic zone-picking refers to the zone-picking decisions made at the operational level, since it is possible to arrange the zone sizes and re-assign the pickers to zones at each picking wave. A dynamic zoning environment is especially important when synchronised zone-picking is considered, as fixed zones would lead to significant idle times where the pickers wait until all the pickers complete the picking activity. Hence, as opposed to static zoning, dynamic zoning is considered as an operational level decision problem and can be simultaneously addressed with other operational level problems, including picker routing and workload balancing.
In most picker routing problems, the main objective is to minimise the total travel time of the order pickers, as it constitutes more than half of the order picking time (Bartholdi and Hackman Citation2019). Since travel time is a function of distance, keeping the walking speed fixed and minimising the walking distance is proposed by many authors as the main factor to optimise the total picking time (e.g. Hall Citation1993; Vaughan and Petersen Citation1999; Roodbergen and de Koster Citation2001a; De Santis et al. Citation2018; Çelik and Süral Citation2019). On the other hand, in synchronised zone-picking, the lead time of an order picking is determined by the longest time taken by any of the order pickers in each zone. For this end, in this paper, we make use of a min–max objective for the order picking problem (OPP) in a parallel-aisle warehouse with a synchronised dynamic zone-picking system. Such zone-picking systems with a makespan minimisation objective dynamically balance the workload among pickers without the need of additional operational control. To the best of our knowledge, this is the first study that defines the OPP in a synchronised zone-picking system with a min–max objective, while also simultaneously considering the picker routing, zone assignment, and workload balancing decisions. The findings of this research should be helpful in warehouses where multiple pickers are employed, and lead time requirements are stringent.
Throughout this paper, we first present the min–max OPP without zoning and give the VRP min–max formulation. Afterwards, we discuss the OPP with dynamic zoning under the assumption that each zone of adjacent aisles is assigned to a single picker. For the min–max VRP without zoning, we propose a heuristic approach for the two-picker case based on the exact picker routing algorithm and the knapsack problem. This approach also constitutes a baseline for our exact approach for the min–max VRP with zoning, which runs in polynomial time. Finally, we work on randomly generated order picking instances where the pick locations in a picking list are independently and uniformly distributed over the order picking area to illustrate the algorithms and compare the performance of the solution methodologies in various computational experiments.
The remainder of this paper is organised as follows. Section 2 describes the warehouse corresponding to the OPP and provides a summary of the literature on picker routing, zone-picking, and integrated warehouse operations. In Section 3, we develop the min–max VRP formulations for multi-picker OPP without and with zoning constraints. In Section 4, we present the heuristic approach for the two-picker OPP without zoning. In Section 5, we develop an exact approach for the min–max OPP under synchronised dynamic zone-picking. Computational experiments are presented in Section 6, and the paper is concluded in Section 7.
2. Problem description and related literature
The parallel aisle warehouse considered in this paper is given in Figure . It contains cross-aisles at front and back of the picking-aisles as in Figure (a) and may contain middle cross-aisles, which perpendicularly divide the warehouse into blocks, and thereby divide the aisles into sub-aisles, as shown on Figure (b).
Figure 1. Two OPP instances. (a) A single-block warehouse with 6 aisles each with 16 time-unit length and 11 picking locations. (b) A three-block warehouse with 8 aisles each with 16 time-unit length and 25 picking locations (Çelik and Süral Citation2019).
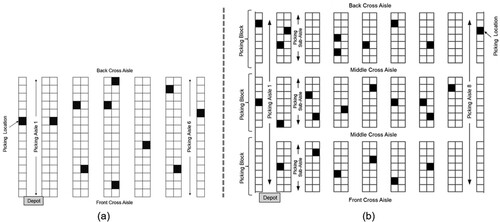
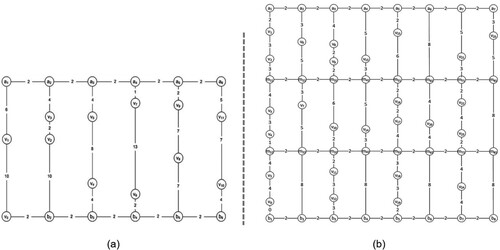
Figure shows the graph representations of the warehouses in Figure where each pick location is represented by node while
represents the depot, and the edge
represents the path providing direct access between node
and
. The nodes
and
represent the back and front intersection points of picking-aisle
, respectively. Nodes
represent the intersection point of picking-aisles
and middle cross-aisle
. A back cross-aisle of a block is the front cross-aisle of the next block. A picker starts a feasible picking route from the depot, collects all the items in the picking list and returns to the depot. The OPP is to find such a feasible route that can be completed in the minimum time.
Figure 2. The graph representations of Figure (a) and (b) (Çelik and Süral Citation2019).
There exists an extensive literature on warehouse management problems. Reviews classifying warehouse problems include Rouwenhorst et al. (Citation2000), De Koster, Le-Duc, and Roodbergen (Citation2007), Gu, Goetschalckx, and McGinnis (Citation2007), Van Gils et al. (Citation2018), and Masae, Glock, and Grosse (Citation2020). Particularly, Gu, Goetschalckx, and McGinnis (Citation2007) conclude that zoning accounts for less than 6% in the surveyed literature. Van Gils et al. (Citation2018) note that zoning and workforce-related problems are the ones that have drawn the least attention.
Due to the importance of order picking on the overall warehouse performance, the OPP is widely studied. Exact approaches for various versions of the problem include Ratliff and Rosenthal (Citation1983), Roodbergen and de Koster (Citation2001b), Scholz et al. (Citation2016) and Pansart, Catusse, and Cambazard (Citation2018), whereas heuristics are proposed by, among others, Hall (Citation1993), Vaughan and Petersen (Citation1999), Roodbergen and de Koster (Citation2001a), Theys et al. (Citation2010), De Santis et al. (Citation2018), and Çelik and Süral (Citation2019).
The zone-picking literature can be classified as (i) sequential zone-picking, where the pickers pick the items in a zone and pass to the picker in the next zone, and (ii) synchronised zone-picking, where the pickers pick the items simultaneously in different zones.
The literature regarding sequential zone-picking systems mostly consists of queuing network studies. De Koster (Citation1994) analyses such a system as a Jackson queuing network where the order inter-arrival times and the zone service times are exponentially distributed. Yu and de Koster (Citation2008) generalise the distribution of order inter-arrival and zone service times, and Yu and de Koster (Citation2009) consider the general queuing network to analyse the impact of batching and zone-picking on throughput times. Melacini, Perotti, and Tumino (Citation2011) extend the above-mentioned queuing literature by considering the number of zones and the number of pickers for each zone as variables. Van der Gaast et al. (Citation2020) estimate the performance of such systems by also including the buffers capacities at each zone.
In the literature regarding synchronised zone-picking systems, Jane and Laih (Citation2005) present a heuristic algorithm balancing the workloads of pickers at different zones to increase the utilisation of a picking wave. De Koster, Le-Duc, and Zaerpour (Citation2012) focus on determining the optimal zone size at the tactical level while also considering sorting/consolidation time. Roy et al. (Citation2012) develop a queuing network model and investigate the impact of the number of zones on response time and total travel time. Roy et al. (Citation2019) model a queuing network of movable storage systems and investigate the performance zone-picker assignment strategies.
The main difference of our work from the above-mentioned zoning studies is that while these consider a static zoning environment, our paper focuses on dynamic zoning systems. To the best of our knowledge, there are very few studies considering dynamic zoning strategy. Bartholdi and Eisenstein (Citation1996) and Bartholdi, Eisenstein, and Foley (Citation2001) introduce the ‘bucket brigades’ concept where they model a sequential zone-picking process in a dynamic way where there are no fixed zones. Similarly, Ho and Liao (Citation2009) propose a dynamic zoning strategy where an initial zone partition is designed by distance and flow relationships, then a metaheuristic is developed to help achieving better workload balance and finally a dynamic zone control method is applied for observation. Azadeh, Roy, and de Koster (Citation2020) study an order picking process where robots are used instead of conveyor-like fixed systems to reduce pickers’ non-value-added travel times. The picker focuses only on picking process while accompanying robot travels between the picker and the depot. Azadeh, Roy, and de Koster (Citation2020) also conclude that it would be significant to examine the optimal dynamic zone sizes to increase the system throughput which is another contribution of our study.
Van Gils et al. (Citation2018) review and classify the most recent literature regarding the integration and interaction of the tactical and operational warehouse problems. Integrated OPP refers to jointly formulate and solve more than one operational warehouse problem (Van Gils et al. Citation2018; Scholz, Schubert, and Wäscher Citation2017). To the best of our knowledge, zone-picking operations have received no attention in integrated order picking literature.
The main contributions of this paper are two-fold. First, we define and solve an integrated zone-picking, picker routing and workload balancing problem by minimising the lead time of the picking wave and applying the policy of synchronised dynamic zone-picking where each picker is assigned to a zone of aisles at each picking wave. For this end, we present an exact polynomial-time DP algorithm, which may be implemented in many real-world warehousing environments and significantly improve performance. Second, for the first time in the literature, the zone-picking approach is studied at the operational level under a synchronised dynamic zone-picking policy. This paper is also one of the few studies which investigate the multi-picker multi-block OPP.
3. Min–max OPP with dynamic and synchronised zone-picking
In this section, we propose a min–max VRP formulation to minimise the lead time of the multi-picker wave-picking process, after which we introduce zoning constraints into the formulation. The following assumptions are made to model the problem:
A zone is a set of contiguous identical aisles. An aisle cannot belong to more than one zone. The aisles are narrow enough so that order picking can be performed simultaneously from both sides of an aisle in negligible time.
The warehouse performs wave-picking with a min–max type objective, and we focus on one wave at a time by applying synchronised dynamic zone-picking policy to operationally control the zone sizes and therefore picker workloads.
Each order picking tour starts and ends at the same point (the depot), and all the items in the wave are picked in one picking tour (of each picker).
3.1. VRP formulation for the min–max OPP
Minimum total time travelled in a multi-picker OPP can be obtained by applying a two-index VRP variant of commodity flow formulation by Gavish and Graves (Citation1978) (VRP-MINSUM). To consider balancing, we require a three-index formulation, where the additional index k is introduced for pickers to clarify which picker traverses edge (p, q):
Let us define by as the set of all pick locations including the depot
and
as the set of all pickers. Also let
be the distance of edge
and
be the number of units of the commodity passed onto pick location
directly from pick location
by picker
. The following commodity flow formulation aims to minimise the maximum distance travelled by any one of the pickers (VRP-MINMAX).
(1)
(1)
(2)
(2)
(3)
(3)
(4)
(4)
(5)
(5)
(6)
(6)
(7)
(7)
(8)
(8)
(9)
(9)
(10)
(10)
In this formulation, the objective is to minimise the distance travelled by the latest picker. Constraints (1) and (2) state that each pick location should be visited exactly once by a picker. Constraints (3) and (4) state that exactly pickers should leave and return to the depot. Constraint (5) guarantees a tour for each picker. Constraint (6) ensures that exactly one unit of commodity is left to each pick location and constraint (7) states that no commodity is passed through the arcs that are not included in the picker tour. The main constraint leading to weakness of the formulation is the big-M constraint (7).
is used as the big-M, since there are
pick locations including the depot, and there are
pickers, each of whom requires visiting at least one pick location. So, each picker can deliver at most
units of the commodity. Constraint (8) ensures that the time travelled by each picker cannot be more than the longest tour, L, which is to be minimised in the objective function.
3.2. VRP-MINMAX formulation with zone-picking constraints
To incorporate zone-picking constraints into the formulation in the preceding section, we assume the warehouse follows a synchronised zone-picking policy where all pickers start simultaneously to better control throughput times. When pickers complete the picking tour, they wait for the completion of the overall picking wave at the depot. A zone is defined as a set of adjacent aisles and zones do not necessarily have the same number of aisles. A picker can be assigned at most one zone and an aisle cannot belong to more than one zone. We focus on minimising the lead time of a picking wave; hence, workload balancing is also achieved.
Let be the set of all aisles and parameter
be the aisle on which the item
is located. Then define:
The following formulation (called VRP-Z) aims to minimise the maximum travel time subject to zoning constraints.
(11)
(11)
(12)
(12)
(13)
(13)
(14)
(14)
(15)
(15)
(16)
(16)
(17)
(17)
Constraint (11) guarantees that the first picker is assigned to the first aisle and the last picker is assigned to the last aisle. Constraint (12) ensures that each aisle is assigned to exactly one picker. Constraint (13) guarantees that each picker is assigned to at least one aisle. Constraint (14) is the linking constraint and guarantees that if picker is traversing the edge
, then the aisles, in which items
and
are located, are assigned to picker
. Constraints (15) and (16) ensure that a zone is a set of adjacent identical aisles such that if picker
is assigned to aisle
, then the next aisle is assigned either to picker
or picker
and no further aisle can be assigned to the previous pickers.
4. A dynamic programming-based heuristic for the min–max OPP with two pickers
The integer programming formulations in Section 3.1 are computationally challenging to solve for larger instances, as will become apparent in Section 6. We first consider the case with two pickers and propose a heuristic approach for VRP-MINMAX, which also serves as the baseline for the exact approach for VRP-Z with a general number of pickers. The heuristic introduces a simple but effective DP algorithm by assigning pickers to aisles, which may be considered as constituting temporary zones. This is followed by an improvement scheme (the travel time balancing algorithm) derived from the knapsack problem, to reduce the optimality gap at the expense of aisle-zone integrity.
For the single-picker OPP, Ratliff and Rosenthal (Citation1983) provide an exact algorithm consisting of stages where
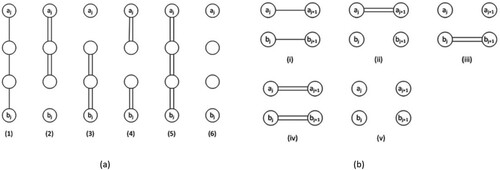
is the number of aisles. In their algorithm, there are two sub-stages for each aisle. Each stage has a number of states called equivalence classes represented by: (i) degree parity at the back of an aisle, (ii) degree parity at the front of an aisle, and (iii) number of connected components. Degree parities can be zero (0), even (E) or odd (U), while connectivity can be 0C, 1C or 2C. A partial tour can be represented by one of the six equivalence classes. These states are updated along the stages using two classes of connection types: intra-aisle and inter-aisle, as shown in Figure . At each stage, minimum tour lengths for each state are found by adding the related possible connection types to the minimum tour lengths of the previous sub-stage. At the last aisle, the partial tour with the minimum length sum is determined, which yields the optimal solution for the single-picker OPP.
Figure 3. (a) Possible intra-aisle connection types, (b) Possible inter-aisle connection types.
Before developing the proposed algorithms at this and following sections, we primarily summarise the notation.
Table
4.1. Construction of temporary zones
In the first stage of the heuristic, we apply repeatedly for each picker after assigning their starting and ending aisles. Initially, the first aisle is assigned to picker 1 and the last
aisles are assigned to picker 2, thus aisle
is set as the stopping aisle. Then, minimum tour lengths are calculated for
and
, and called
and
. Subsequently, aisle
is set as the stopping aisle and minimum tour lengths are calculated again
. The stopping aisle
is increased in this manner until the minimum tour length for picker 1 exceeds the one for picker 2, i.e.
. At this final stage, the first
aisles are assigned to picker 1 and the remaining
aisles are assigned to picker 2 where picker 1 travels at least as many time units as picker 2. Note that, at
th stopping aisle stage,
. At this previous stage, the first
aisles are assigned to picker 1 and the remaining
aisles are assigned to picker 2 where picker 1 travels at most as many time units as picker 2.
The aim of the proposed algorithm is to return a smaller wave time, i.e. smaller maximum time travelled, at the final and the previous stages. In the next section, we present an improvement algorithm that further reduces the wave time by minimising the absolute travel time difference between the two pickers.
4.2. Travel time balancing algorithm
In the first phase of the heuristic, one picker will travel more than the other. Reassignment of moves from one picker to the other is likely to improve the workload balance at the expense of zone integrity. For this end, we develop a DP algorithm called travel time balancing algorithm.
The problem stated here can be described as a variant of the knapsack problem to minimise the travel time difference between two pickers. Suppose we solve a knapsack problem having capacity
with
items each with weight
and value
with the following notation:
Table
The optimal subset of movements,, is the one which minimises the difference
A pseudocode of the algorithm is depicted in Algorithm 1.
Finally, the maximum time travelled at the final stage and the previous stage are compared and the smaller of these two maximums is found.
This heuristic returns the best split between two pickers that has the smallest wave time. Here, we find a near optimal min–max solution for the two-picker min–max OPP while balancing the workload of the pickers and forcing them to use the minimum-time routes. The pseudocode of the two-picker min–max OPP algorithm is depicted in Algorithm 2.
4.3. Numerical example
For the example given in Figure (a), we demonstrate the solutions of MINSUM, initial phase of the heuristic, and MINMAX in Figure (a–c), respectively.
Figure 4. The minimum time solutions for the example in Figure (a). (a) VRP-MINSUM, (b) VRP-MINMAX and two-picker OPP algorithm, (c) initial phase of the two-picker dynamic zone-picking heuristic.
Table
Table
In the following section, we extend the temporary zoning idea in this section to develop an exact approach for the min–max OPP under dynamic zoning and a general number of pickers.
5. An exact algorithm for the min–max OPP under synchronised dynamic zone-picking
Contrary to tactical level zone-picking policy, there are no dedicated zones assigned to pickers at the operational level. Zones are assigned to pickers at each picking wave. Thus, the zone-picking problem is reduced to an operational level decision integrated with routing and workload balancing problems. In this way, we solve an integrated zone-picking, picker routing and workload balancing problem where each zone consists of a certain number of aisles.
In this proposed algorithm, we first determine all minimum tour lengths for each possible zone configuration. Based on this information, we recursively look at the optimal combination of zone assignments that minimises the longest-time tour length for a given number of pickers.
Proposition 1 states the required number of minimum tour length information prior to zone assignment. Proofs of the propositions can be found in the Appendix.
Proposition 5.1:
R&R algorithm can be calculated for different zone configurations for an
-aisle picking area in polynomial time.
Proposition 2 states the number of possible zones for picker and implies that zone-assignment problem can be studied using combinational calculations.
Proposition 5.2:
There are different zone configurations to assign k pickers to
aisles in an
-aisle picking area.
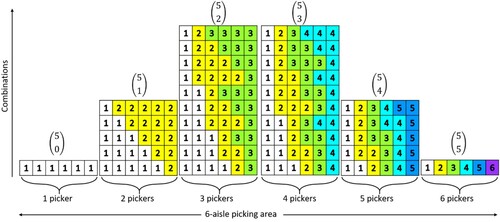
As an example, a visual representation on which k pickers are assigned to 6 aisles where is shown in Figure .
Figure 5. Visual representation of 6-aisle picking area zone-assignment.
Next, we present two corollaries to better define the later DP recursion.
Corollary 5.1:
The possible zone configurations can be represented in a Binomial Expansion where each row represents the number of aisles and each ‘top-right to bottom-left diagonal line’ represents the number of pickers as shown in Figure . This can be coded down where each row represents the number of aisles and each column represents the number of pickers.
Figure 6. Binomial expansion of 6-aisle picking area zone-assignment.
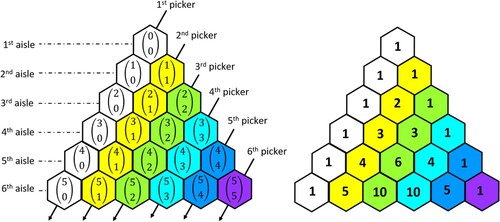
The coefficients in the Binomial Expansion also correspond to the entries of Pascal’s Triangle such that the th coefficient in the Binomial expansion is equal to the entry at aisle
, picker
in the Pascal’s Triangle.
Corollary 5.2:
We can track the pathways of possible zone configurations to assign
pickers to
aisles using Pascal’s Triangle graph representation.
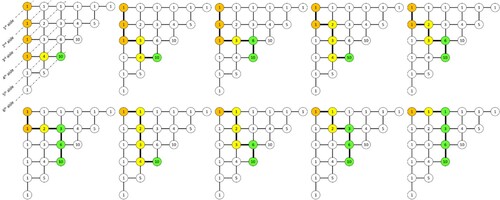
For example, there are different pathways to go to the entry at aisle
, picker
in the Pascal’s Triangle as shown in Figure .
Figure 7. The pathways of 10 possible zone configurations for 6 aisles and 3 pickers.
We can now state the main theorem of this study and Algorithm 3. With this algorithm, we can track the optimal combination of zone assignments that minimises the longest-time tour length for a given number of pickers.
Theorem 5.1:
The min–max OPP in synchronised dynamic zone-picking systems can be solved in polynomial time using DP.
Proof:
is the cost-to-go function which is equal to the lead time of the picking wave that optimally assigns
pickers to
aisles, where
;
. As the initial step, for the single picker case where
it is clear that
. Moreover, when the number of pickers equals to the number of aisles where
the cost-to-go function returns
. Then, the general DP recursion can be formalised as follows:
Here, the problem of finding the optimal combination of zone assignment for
aisles and
pickers is broken down into the subproblem of introducing the
picker and combining it with memorised optimal zone assignment subproblem solutions for
pickers. In total, we have
subproblems to assign k pickers to |M| aisles where each of them has a constant running time thanks to the memorisation. This implies that the recursion has an overall computational complexity of
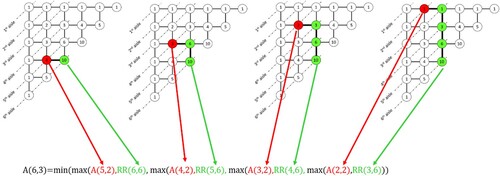
As an example, Figure depicts a visual representation of Algorithm 3 to find the minimum lead time of a picking wave among possible zone configurations with 3 pickers and 6 aisles, i.e.
.
Figure 8. Visual representation of Algorithm 3.
A pseudocode of the algorithm is given in Algorithm 3.
Table
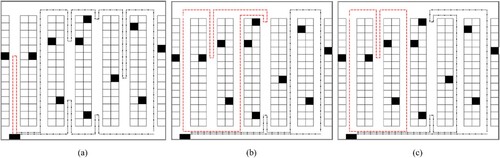
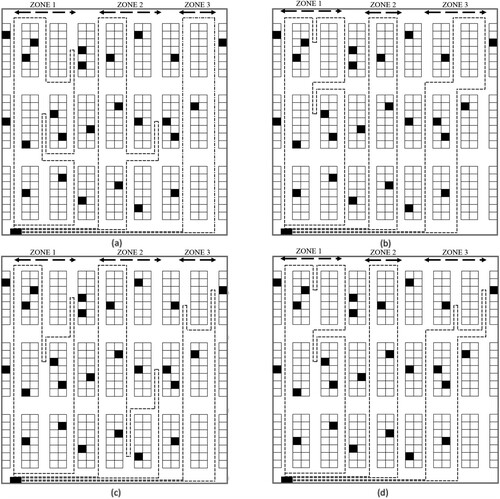
Proposition 1 allows us to calculate the minimum tour length for each possible zone configuration. Given that there are multiple blocks, heuristic approaches (e.g. S-shape, largest gap, aisle-by-aisle, or combined) can be applied to calculate the routes for each possible zone configuration instead of the R&R algorithm. In this way, the multi-picker dynamic zone-picking algorithm can be heuristically solved for a multi-block layout. For the multi-block OPP instance in Figure (b), Figure shows the resulting 3-picker routes for S-shape, largest gap, aisle-by-aisle, and combined heuristic solutions, with minimum wave-picking lead times of 78, 76, 88, and 76 time units, respectively.
Figure 9. Resulting 3-picker heuristic solutions for the instance in Figure (b). (a) S-shape heuristic solution. (b) Largest gap heuristic solution. (c) Aisle-by-aisle heuristic solution. (d) Combined heuristic solution.
6. Computational experiments
In this section, we present the computational experiments conducted in line with those in the literature (Roodbergen and de Koster Citation2001a; Scholz et al. Citation2016). First, we test the performance of the two-picker min–max OPP algorithm by analysing the optimality gaps and computational times. Secondly, we aim to observe the impact of the number of pickers on lead time savings. Thirdly, we study the impact of zone-picking on the lead time by comparing the results of zone-picking and no zone-picking policies. Lastly, we test the performance of the algorithm on multi-block layouts by considering four well-known routing heuristics.
Following Roodbergen and de Koster (Citation2001a), we use a set of 2,000 instances for each combination. We implement the models in AMPL modelling language and the algorithms in C++ in Microsoft Visual Studio 2019. Average run times of algorithms are below 0.1 s, and hence are not reported. In all settings, the horizontal length between two adjacent aisles set to 2 time units. The end of a sub-aisle (length) of a block also refers to the centre of the back cross-aisle of that block and the front cross-aisle of the next block.
6.1. Performance of the algorithms
In the first experiments, the performance of the two-picker min–max OPP algorithm is analysed using optimality gaps. We use the first set of instances where there are 7 or 15 aisles, each with a length of 10 or 30 time units, and 10 or 15 pick items in the picking list. The summary of the results is given in Table .
Table 1. Summary of the computational experiments.
In Table , Optimal % refers to the percentage of the number of optimal instances out of 2000 instances for each setting. For each instance, the gap is calculated as where
, represents the optimal travel time for VRP-MINMAX problem and
, represents the travel time of the latest picker calculated by the two-picker OPP algorithm. The results in Table show that the algorithm leads to either optimal solutions or very small gaps from the VRP-MINMAX model. Overall settings, a maximum of 92.2% and an average of 77.1% of the solutions are optimal, and the average gap remains below 1.7%. Average Savings represent the average percent time savings when two pickers are used instead of a single picker. We can conclude that using two pickers reduces the order picking time at least about one-third with the best improvement of 44% for the VRP-MINMAX model and 43% for the heuristic. Furthermore, it can be inferred from Table that the larger the number of items and the longer the length of an aisle, the more significant is the assigning of a second picker.
For each instance or picking wave, both pickers start collecting the orders together. When a picker arrives back to the depot earlier, s/he is assigned to the longer route for the next picking wave to keep the workload balanced in the long run. The average time difference between the pickers is shown on the next column of Table . On average, the average time difference between the two pickers is just 5.5 units, which shows that the algorithm can balance the workload substantially.
In the last two columns of Table , we present the average computational times of the VRP-Z formulation to compare its performance with one of the proposed exact algorithms for the min–max OPP under synchronised dynamic zone-picking. We test the VRP-Z formulation using the same instance set with up to 6 pickers by setting a time limit of 60 s. VRP-Z formulation results in significantly large number of unsolved instances when the number of pick locations and the number of aisles is even slightly larger. The results show that there are a maximum of 45% unsolved instances when the number of pick locations is increased from 10 to 15 and the number of aisles is increased from 7 to 15. Hence, we can conclude that the proposed VRP-Z formulation leads to large computing times when the number of pick locations the number of aisles is large. On the other hand, the proposed algorithm solves all instances in this set almost instantly (<0.01 s). Even, using the second set of instances (Scholz et al. Citation2016), as the number of pick locations is increased to 90 and the number of aisles is set as 30, the maximum computation time remains below 0.1 s.
6.2. Impact of multiple pickers on lead time of the picking wave for single block layout
To analyse the impact of the multiple pickers on lead time savings, we use the exact algorithm presented in Section 5 on two different sets of randomly generated instances. The first is the same as the one presented in Section 6.1, whereas the second set of instances is the subset of the instance set designed by Scholz et al. (Citation2016), where we set the number of aisles as 10, 20 or 30, aisle length as 10, 30 or 50 time units, and number of pick items as 30, 60 or 90.
Figure shows the averages of percentage reductions on the travel time gained by introducing each additional picker for 7-aisle and 15-aisle cases. As a baseline, we set the value of single-picker lead time as 100%. Figure shows that assigning additional pickers significantly decreases the lead time of a picking wave, but to a certain extent and in a decreasing rate. In other words, the law of diminishing marginal returns applies.
Figure 10. Impact of number of pickers on lead time reduction.
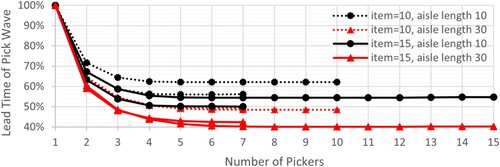
According to the findings from the first set, there is an average of 35% reduction with the introduction of the second picker. However, the impact of reduction decreases to 9% with the 3rd and to 3% with the 4th picker. Although there is still some decrease with the introduction of a new picker, this difference reduces to below 1% for the 6th picker. As Figure also shows, relatively larger aisle lengths (triangle markers on the plot) result in more savings with each additional picker. The results also suggest that if the number of pick locations is relatively larger, additional pickers yield more savings. The last important finding from Figure is that an additional picker brings slightly more benefits if the number of aisles is relatively smaller.
We gain the same insights with the second set. The findings are depicted in Figure , which shows the averages of reductions gained by introducing a new picker for the 10-aisle, 20-aisle, and 30-aisle cases.
Figure 11. Impact of number of pickers on lead time reduction with Scholz et al. (Citation2016) instances.
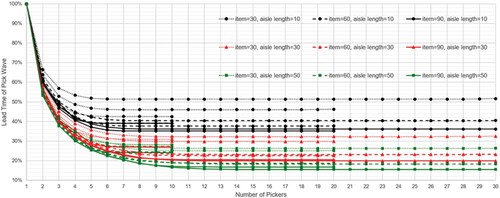
From Figure , there is an average of 43% reduction with the introduction of the second picker. The impact of reduction decreases to 13.5% with the 3rd and to 6.5% with the 4th picker. This difference drops below 1% after the 9th picker for the most extreme test instance. We also notice that assigning 9 pickers yields 82% savings in the most extreme case. Moreover, larger aisle length results in more savings with each additional picker. Figure also shows that the most significant impact factors are the aisle length and the number of pick items. Another interesting result is that although the size of the instance set is more than doubled in the most extreme case when it is compared to the most extreme case of the previous instance set, the threshold number of pickers, beyond which no more significant saving is gained, is only increased by half.
In terms of finding a balanced configuration between the warehouse size and number of pickers, we observe that the number of aisles is not a significant factor. However, the length of aisle is significant in the sense that the deeper the aisles, the more significant is the assigning of an additional picker. Consequently, managers should consider assigning each additional picker more carefully due to decreasing pace in the lead time reduction. As a rule of thumb, managers can keep in my that, for relatively large aisles, assigning the 2nd picker results in about 45% reduction in lead time of a pick wave, independent of the warehouse size. A 3rd picker would lead to 15% reduction in average beyond which it will never reach 10% under synchronised zone-picking systems.
6.3. Comparison of zone-picking and no zone-picking cases
Next, we aim to assess the impact of zone-picking on travel time by comparing the gap between the results of the min–max OPP with those without zone-picking. We include 6 pickers in the first set of instances beyond which no value is added by additional pickers. Table shows a summary of these gaps. For each of these combinations, best results are indicated in darker grey-colour scale. Equal Results % refers to the percentage of the number of instances with the same results out of 2000 instances. The first inference that can be drawn from Table is that the percentage of equal results increases significantly with each additional picker as it increases from 60.9% in average while there are 2 pickers to 99.8% in average with 6 pickers.
Table 2. Gap analysis between zone-picking and no zone-picking cases.
Results from Table also show that the extent of suboptimality from imposing zone picking, reduces significantly with each introduced picker (decrease from 1.86% with 2 pickers to 0.11% with 6 pickers). This is because possible movements become more limited when fewer aisles are assigned to each picker.
From Table , it can be inferred that aisle-length is also a significant, but negatively associated factor since an increase in the aisle-length leads to a reduction in the number of equal results (from 89.33% to 69.52% in average, p-value < 0.01) and a rise in the average (from 0.50% to 1.53% in average, p-value < 0.01) and standard deviation (from 1.25% to 2.50% in average, p-value < 0.01) of gaps.
6.4. Multiple order pickers for multi-block layout and a comparison of heuristics
Finally, we would like to analyse the performance of the multi-picker dynamic zone-picking algorithm on multi-block layouts by applying four well-known heuristics on the first set of instances with up to 5 blocks and 7 pickers. S-shape, largest gap, and combined heuristics are improved at the same extent by forcing that the entering aisle for the closest block to the depot should be the rightmost filled picking sub-aisle (Roodbergen and de Koster Citation2001a).
Table gives the average minimum lead times of the picking waves. For each combination, the best heuristic is indicated in grey colour scale and bold-italic. Table shows that the combined heuristic significantly outperforms other heuristics for multi-block layouts and the performance of the heuristics converges with the increase in the number of pickers.
Table 3. Minimum wave-picking lead times with each additional picker for multi-block layout settings.
The combined heuristic has the best performance in 259 of the 280 settings and is only outperformed where the aisle-length/aisle-number ratio is large. Moreover, the performance of the aisle-by-aisle heuristic quickly approaches the combined heuristic with the increase of the number of pickers. Table also shows that the S-shape heuristic never has the best performance alone. The largest gap strategy solely has the best performance in 14 settings, each of which emerges when the aisle-length/aisle-number ratio is large. The aisle-by-aisle heuristic solely has the best performance in seven settings and performs the same as combined for the single block layout as in line with the literature (Roodbergen and de Koster Citation2001a). However, employing more pickers quickly improves the performance of these heuristics.
Finally, we examine the impact of each additional picker on savings. Table shows the percentage savings with each additional picker where the best heuristic is indicated in grey colour scale and bold-italic. For the single block layout, average percentage savings are slightly higher when compared to the optimal. When we compare the heuristics, additional pickers yield better savings for S-shape and largest gap heuristics at single block layouts. With the increase in the number of blocks, each additional picker results in more savings for the aisle-by-aisle heuristic. The largest gap strategy performs poorly in terms of percentage savings with each additional picker. The combined heuristic never has the best performance alone for the percentage savings, although it still maintains its overall best performance on the minimum lead times. This can be explained by the fact that underperforming heuristics lead to more savings with each additional picker since the performance of the heuristics converges with the increase in the number of pickers.
Table 4. Percentage savings with each additional picker for multi-block layout settings.
Overall, we observe that the combined heuristic performs relatively the best for the multi-picker, multi-block dynamic zone-picking problem, while the performance of largest gap heuristic increases with the number of blocks and that of aisle-by-aisle heuristics increases with the number of pickers.
7. Conclusions and further research directions
In this paper, we have focused on the multi-picker OPP in parallel-aisle warehouses under a synchronised dynamic zone-picking policy, with the objective of minimising order lead time by minimising the maximum travel time of each picker, while aiming to ensure the balance among pickers. This problem is important in the sense of making practical and effective use of resources while fulfilling the customer orders within increasingly competitive due dates.
The paper has introduced a knapsack-based DP heuristic for the two-picker min–max OPP without zoning, as well as a novel polynomial-time exact algorithm for the min–max OPP in synchronised dynamic zone-picking systems. This DP algorithm assigns pickers for zone-picking and returns the optimal combination of zone assignments for multiple pickers.
Important findings obtained from our computational experiments are that: (i) the proposed algorithm for the min–max OPP with two pickers generates efficient solutions very quickly as the optimality gap averages and the standard deviations are quite low, (ii) for relatively large aisles, assigning a second picker reduces the order picking time around 45% in average while this impact exponentially diminishes each with additional picker, (iii) the proposed synchronised dynamic zone-picking approach with a min–max objective spontaneously leads to the balanced partition of the pickers’ workload thus reduces management supervision, and (iv) the travel time gap between ‘no zoning’ and ‘zoning’ strategies quickly disappears with the introduction of additional pickers. It is important to note that we have worked on uniformly distributed pick locations. That is no demand frequency is taken into account. If a class-based storage policy, which fast moving class products are stored in the closest aisles, is applied, the advantage of dynamic zoning policy would be more significant. This is because the possibility of having a pick location in the further aisles would be relatively small. For the same reason, the proposed algorithm will terminate faster.
For further research, the integrated work in this study can be improved by considering batch-picking approach. The cost factor is not considered in this study and can be a future research direction. Since each additional picker reduces the zone-picking lead time in a decreasing pace, the optimal configuration of zoning and the number of pickers can be further explored with consideration of the cost and service level objectives. Moreover, a cost-related study should also consider other cost factors that vary with the number of zones. For example, as dynamic zones create a more challenging environment for the pickers, a successful operation requires an intact communication and coordination with the help of supporting systems such as pick-by-voice systems. Also, warehouse-specific properties, such as intersection points between picking aisles and cross aisles, intra-aisle and inter-aisle movement types, can be included in the formulations. Such an extension could strengthen the formulation for the multi-picker OPP. The integer programming model can be adapted to a mathematical programming-based heuristic to improve the algorithm. The proposed travel time balancing algorithm could also be embedded into various heuristics for further improvement purposes.
Disclosure statement
No potential conflict of interest was reported by the author(s).
Data availability statement
There are no restrictions on sharing of the data in this paper due to data ownership or the inclusion of personally identifiable information. All data is available upon request from the authors.
Additional information
Notes on contributors

Serhat Saylam
Serhat Saylam is a Ph.D. Candidate at the Department of Industrial Engineering, Middle East Technical University, Ankara, Turkey. He holds a master’s degree in Logistics & Supply Chain Management from U.S. Air Force Institute of Technology. Dayton, Ohio. His research interests focus on operational research, supply chain optimisation, logistics, and routing problems. Currently, he is working as a lecturer at the Department of Industrial Engineering, Turkish Air Force Academy, National Defence University, Istanbul, Turkey.

Melih Çelik
Melih Çelik is an associate professor at the School of Management in the University of Bath (United Kingdom). He holds a Ph.D. in industrial engineering from the Georgia Institute of Technology (Atlanta, USA) as well as a master’s degree in operations research from the same institution. Prior to joining the University of Bath, he was an assistant professor at the Industrial Engineering Department of Middle East Technical University (Ankara, Turkey). His research interests cover warehouse planning, design, and control; non-profit and humanitarian applications of operations research; design, recovery and restoration of vulnerable infrastructure networks; and facility location and layout.

Haldun Süral
Haldun Süral is a professor of industrial engineering at Middle East Technical University (METU), Ankara, Turkey. He received his B.S., M.S., and Ph.D. in industrial engineering from METU. His work experience includes teaching/research positions at METU, INSEAD (France), University of Waterloo and Wilfrid Laurier University (Canada). His research interests range from supply/production/distribution network design to restructuring a large humanitarian aid organisation and waste management system design.
References
- Ardjmand, E., H. Shakeri, M. Singh, and O. S. Bajgiran. 2018. “Minimizing Order Picking Makespan with Multiple Pickers in a Wave Picking Warehouse.” International Journal of Production Economics 206: 169–183.
- Azadeh, K., D. Roy, and R. de Koster. 2020. Dynamic Human-Robot Collaborative Picking Strategies. Erasmus University Working Paper.
- Bartholdi, J. J., and D. D. Eisenstein. 1996. “A Production Line That Balances Itself.” Operations Research 44 (1): 21–34.
- Bartholdi, J. J., D. D. Eisenstein, and R. D. Foley. 2001. “Performance of Bucket Brigades When Work is Stochastic.” Operations Research 49 (5): 710–719.
- Bartholdi, J. J., and S. Hackman. 2019. Warehouse and Distribution Science. Release 0.98.1. Atlanta: Supply Chain and Logistics Institute. https://www2.isye.gatech.edu/~jjb/wh/book/.
- Çelik, M., and H. Süral. 2019. “Order Picking in Parallel-Aisle Warehouses with Multiple Blocks: Complexity and a Graph Theory-Based Heuristic.” International Journal of Production Research 57 (3): 888–906.
- De Koster, R. 1994. “Performance Approximation of Pick-to-Belt Order Picking Systems.” European Journal of Operational Research 72 (3): 558–573.
- De Koster, R., T. Le-Duc, and K. J. Roodbergen. 2007. “Design and Control of Warehouse Order Picking. A Literature Review.” European Journal of Operational Research 182 (2): 481–501.
- De Koster, R., T. Le-Duc, and N. Zaerpour. 2012. “Determining the Number of Zones in a Pick-and-Sort Order Picking System.” International Journal of Production Research 50 (3): 757–771.
- De Koster, R., E. S. Van der Poort, and M. Wolters. 1999. “Efficient Order-Batching Methods in Warehouses.” International Journal of Production Research 37 (7): 1479–1504.
- De Santis, R., R. Montanari, G. Vignali, and E. Bottani. 2018. “An Adapted Ant Colony Optimization Algorithm for the Minimization of the Travel Distance of Pickers in Manual Warehouses.” European Journal of Operational Research 267 (1): 120–137.
- Feller, W. 2008. An Introduction to Probability Theory and its Applications. Vol. II. New York: Wiley.
- Gavish, B., and S. C. Graves. 1978. The Travelling Salesman Problem and Related Problems. Working Paper OR-078-78. Cambridge: Operations Research Center, MIT.
- Gu, J., M. Goetschalckx, and L. F. McGinnis. 2007. “Research on Warehouse Operation: A Comprehensive Review.” European Journal of Operational Research 177 (1): 1–21.
- Hall, R. W. 1993. “Distance Approximations for Routing Manual Pickers in a Warehouse.” IIE Transactions 25 (4): 76–87.
- Ho, Y. C., and T. W. Liao. 2009. “Zone Design and Control for Vehicle Collision Prevention and Load Balancing in a Zone Control AGV System.” Computers and Industrial Engineering 56 (1): 417–432.
- Jane, C. C., and Y. W. Laih. 2005. “A Clustering Algorithm for Item Assignment in a Synchronized Zone Order Picking System.” European Journal of Operational Research 166 (2): 489–496.
- Masae, M., C. H. Glock, and E. H. Grosse. 2020. “Order Picker Routing in Warehouses: A Systematic Literature Review.” International Journal of Production Economics 224: 107564.
- Melacini, M., S. Perotti, and A. Tumino. 2011. “Development of a Framework for Pick-and-Pass Order Picking System Design.” The International Journal of Advanced Manufacturing Technology 53: 841–854.
- Pansart, L., N. Catusse, and H. Cambazard. 2018. “Exact Algorithms for the Order Picking Problem.” Computers and Operations Research 100: 117–127.
- Ratliff, H. D., and A. S. Rosenthal. 1983. “Order-Picking in a Rectangular Warehouse: A Solvable Case of the Traveling Salesman Problem.” Operations Research 31 (3): 507–521.
- Roodbergen, K. J., and R. de Koster. 2001a. “Routing Methods for Warehouses with Multiple Cross-Aisles.” International Journal of Production Research 39 (9): 1865–1883.
- Roodbergen, K. J., and R. de Koster. 2001b. “Routing Order Pickers in a Warehouse with a Middle Aisle.” European Journal of Operational Research 133 (1): 32–43.
- Rouwenhorst, B., B. Reuter, V. Stockrahm, G. J. van Houtum, R. J. Mantel, and W. H. Zijm. 2000. “Warehouse Design and Control: Framework and Literature Review.” European Journal of Operational Research 122 (3): 515–533.
- Roy, D., A. Krishnamurthy, S. S. Heragu, and C. J. Malmborg. 2012. “Performance Analysis and Design Trade-Offs in Warehouses with Autonomous Vehicle Technology.” IIE Transactions 44 (12): 1045–1060.
- Roy, D., S. Nigam, R. de Koster, I. Adan, and J. Resing. 2019. “Robot-Storage Zone Assignment Strategies in Mobile Fulfillment Systems.” Transportation Research Part E: Logistics and Transportation Review 122: 119–142.
- Scholz, A., S. Henn, M. Stuhlmann, and G. Wäscher. 2016. “A New Mathematical Programming Formulation for the Single-Picker Routing Problem.” European Journal of Operational Research 253 (1): 68–84.
- Scholz, A., D. Schubert, and G. Wäscher. 2017. “Order Picking with Multiple Pickers and Due Dates–Simultaneous Solution of Order Batching, Batch Assignment and Sequencing, and Picker Routing Problems.” European Journal of Operational Research 263 (2): 461–478.
- Theys, C., O. Bräysy, W. Dullaert, and B. Raa. 2010. “Using a TSP Heuristic for Routing Order Pickers in Warehouses.” European Journal of Operational Research 200 (3): 755–763.
- Van der Gaast, J. P., R. B. de Koster, I. J. Adan, and J. A. Resing. 2020. “Capacity Analysis of Sequential Zone Picking Systems.” Operations Research 68 (1): 161–179.
- Van Gils, T., K. Ramaekers, A. Caris, and R. de Koster. 2018. “Designing Efficient Order Picking Systems by Combining Planning Problems: State-of-the-Art Classification and Review.” European Journal of Operational Research 267 (1): 1–15.
- Vanheusden, S, T Van Gils, A Caris, K Ramaekers, and K Braekers. 2020. “Operational workload balancing in manual order picking.” Computers and Industrial Engineering 141.
- Vaughan, T. S., and C. G. Petersen. 1999. “The Effect of Warehouse Cross Aisles on Order Picking Efficiency.” International Journal of Production Research 37 (4): 881–897.
- Yu, M., and R. de Koster. 2008. “Performance Approximation and Design of Pick-and-Pass Order Picking Systems.” IIE Transactions 40 (11): 1054–1069.
- Yu, M., and R. de Koster. 2009. “The Impact of Order Batching and Picking Area Zoning on Order Picking System Performance.” European Journal of Operational Research 198 (2): 480–490.
Appendix
Proof of Proposition 1
This arises from the assumption that a zone is a set of adjacent aisles. There is only a single possibility for a zone consisting of aisles. R&R algorithm runs in
. There are two possibilities to construct a zone consisting of
aisles with
running time for each. There are
different ways to form zones consisting of
aisles with
running time for each. Finally, there are
different ways to form a
-aisle zone configuration with
running time for each. Then, for the total number of routing calculation, the proof is the same as the one of sum of finite arithmetic series formula by induction, thus
. When the running times are also included in the summation, the overall running time ends up with:
Proof of Proposition 2
This can be shown by the ‘Stars and Bars’ technique by Feller (Citation2008). Suppose aisles (stars) are fixed and
gaps between aisles, in each of which there may or may not be a ‘bar’. A zone configuration is obtained by ‘bar’ing
of these
gaps.