
Abstract
This paper presents an evaluation of the usability, functionality, and usefulness of the Warehouse Error Prevention (WEP) tool that consists of seven modules. The WEP tool is framed in a simple yes/no form, which can be used to identify human factors related to sources of pick errors in a warehouse. Thirty-three participants in 27 organisations from three different countries participated in a trial application and evaluation of the tool. The evaluation included a survey study and semi-structured interviews. Survey results show that participants agreed on the usability and functionality of the WEP tool. In the interviews, participants generally reported the WEP tool as being both accurate and functional with the potential to support engineers, ergonomists, and warehouse managers to improve order picking quality. Further quantitative field testing of the WEP tool’s potential to identify costly warehouse errors is needed.
1. Introduction
1.1. Order picking
Order Picking (OP) is the process of retrieving items in a warehouse to satisfy customer orders (Grosse et al. Citation2015). There are many design aspects that can significantly impact the efficiency and effectiveness of this process (Vanheusden et al. Citation2023). This article presents an end-user study evaluating the usability, functionality, and usefulness of the Warehouse Error Prevention (WEP) tool (freely available from Setayesh et al. Citation2022a).
Key OP system design elements include: (a) palletizing/batching decisions, which determine how requested stock-keeping units (SKUs) are grouped to facilitate retrieving them (Calzavara et al. Citation2017); (b) pick information provision about item numbers, item locations, and requested quantities (e.g. on a pick-list or using information technologies, Grosse, Glock, and Neumann Citation2017); (c) layout, which determines the shelf configuration of the warehouse (Roodbergen, Vis, and Taylor Citation2015); (d) routing, which determines the sequence in which item locations are visited (Masae, Glock, and Vichitkunakorn Citation2020); (e) storage assignment, which allocates items to storage locations (Battini et al. Citation2015); and (f) organisational behaviour management, which focuses on the design of work procedures and work organisation (Lattal Citation2014). Although automation and robotisation have become an essential part of many warehouse operations (Fragapane et al. Citation2021), about 80% of the OP processes are still performed manually due to the superior flexibility of humans to accommodate unexpected changes in the system (Vijayakumar et al. Citation2022; Zhao et al. Citation2019; De Koster, Le-Duc, and Roodbergen Citation2007). The use of assistive devices has been reported to increase though (Winkelhaus, Grosse, and Morana Citation2021; Grosse Citation2023). As a result, manual OP systems tend to be labour-intensive and time-consuming (Zhao et al. Citation2019), which also creates the potential for pick errors (Setayesh et al. Citation2022b).
1.2. Human and system design interaction in manual order picking
Pick errors may occur as a result of poor human and OP system design interactions, and they can materialise as a selection of incorrect items, a selection of a wrong item quantity, or a selection of damaged items (Setayesh et al. Citation2022b). Pick errors may cause increases in operational costs, customer dissatisfaction, and unexpected penalty costs while degrading system performance. The high amount of manual labour makes the OP process the most expensive operation in a warehouse, which can account for more than 50% of the warehouse’s expenses (Tompkins et al. Citation2010; Frazelle Citation2015). A high number of pick errors can further increase these costs.
Pick errors may result from a problematic system design leading to mismatches between human capability and demands in OP operations (Setayesh et al. Citation2022b; Grosse, Glock, and Neumann Citation2017). Rasmussen (Citation1981) and Rasmussen and Rouse (Citation2013) underscored the relationship between problematic system design and human-system error. Lack of attention to human and OP system interactions in the design process can contribute to pick errors (Setayesh et al. Citation2022b; Grosse et al. Citation2015). This suggests that the application of Human Factors (HF) considerations in the design of OP systems can improve operator-system interactions and reduce pick errors. HF is a multidisciplinary scientific approach considering both psychological and physiological principles and aims to optimise system performance and human well-being by understanding system design elements and human–system interactions (IEA Council Citation2014). Since the roots of errors often lie in the system design, errors in system operations should be considered human-system errors rather than the more common ‘human error’ (Salmon, Walker, and Stanton Citation2016; Di Pasquale, Miranda, and Neumann Citation2020).
Although humans are key to OP operations, HF aspects in OP research appear to be an understudied topic (Grosse, Glock, and Neumann Citation2017; De Lombaert et al. Citation2022). HF consists of four aspects that determine the human–system design interaction that affects humans’ well-being and overall performance (Vijayakumar et al. Citation2022; International Ergonomics Association Citation2014). These four aspects are: (a) Physical demands, including physical activities such as repetitiveness of tasks, carrying of loads, hand and arm postures, and strained hand and arm movements (Coenen et al. Citation2014); (b) cognitive demands, comprising of mental workload and mental fatigue; (c) perceptual demands, involving sensory systems such as vision, hearing, smell, and touch; and (d) psychosocial demands, referring to an individual’s psychological perceptions of the social dimensions of the workplace such as motivation, job satisfaction, and supervisory support (Grosse et al. Citation2015; Salvendy Citation2012). If the design of the system places demands on human operators that exceed their capabilities, then negative outcomes, such as errors or injuries, can be expected. These human-system mismatches incur unexpected costs for the system – a phenomenon referred to as the ‘innovation pitfall’ (Neumann et al. Citation2021).
1.3. Warehouse Error Prevention (WEP) tool design strategy
The Warehouse Error Prevention (WEP) tool is designed to help users identify sources of errors in OP systems to help improve quality performance. It has been developed based on recent research that identified a wide range of different HF considerations in warehouse design that contribute to pick errors including visual demands, mental workload, physical workload, and psychosocial aspects (Setayesh et al. Citation2022b). The WEP tool contains seven modules and 118 questions and sub-questions based on specific OP system design and operational aspects which can help warehouse engineers and managers to identify specific opportunities to reduce human-system error risks. The first five modules focus on specific OP system design elements: (1) pick information/technology (Grosse Citation2023), (2) layout, (3) routing, (4) palletizing/batching, and (5) storage assignment. Modules six and seven cover organisational behaviour management aspects, which are organisational level elements that have been shown to have an impact on order pickers’ performance and pick error occurrence (Setayesh et al. Citation2022b; Grosse et al. Citation2015). The WEP tool is available online (Setayesh et al. Citation2022a).
For each module, specific design elements were identified from a previous analysis of error sources in OP systems (Setayesh et al. Citation2022b). A specific verifiable design requirement was then identified for each element by reviewing scientific literature, existing guidelines, and HF handbooks. Table presents key references used to define the HF demand threshold values and OP design elements in the WEP tool.
Table 1. Key references and types of HF demand threshold values and OP design elements addressed that were used to define the design requirements in creation of the WEP tool.
Based on the identified design requirements in the OP context, each element was broken down into specific binary yes/no criteria that formed the basis of each item rather than using multiple level scale or measurement approaches. The binary approach makes the decision-making process easier for users as it provides a fixed and consistent list of responses based on a single specific criterion. While a ‘multiple options’ or scoring approach was considered, the developers were concerned with the vagueness and complexity that this might cause, thereby compromising tool usability and functionality.
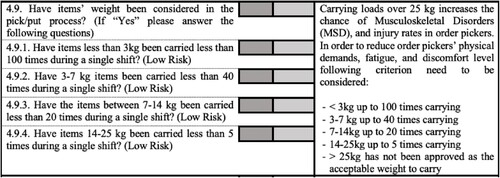
In the WEP tool, any ‘No’ response indicates a specific opportunity to improve that OP system design element according to the criteria provided. In this way, each item in the WEP tool is a kind of decision support tool to identify where further investigation and design changes might be needed. Figure shows an example of the WEP tool from the palletizing/batching module. The WEP tool has never been evaluated with regards to potential users’ views of usability, functionality, and usefulness – key features to evaluate for any production engineering tool.
Figure 1. A section of the WEP tool showing a question associated with the physical weight of items in a palletizing/batching process.
1.4. Research aim and questions
The WEP tool represents a boundary spanning object (Ojansivu, Kettunen, and Alajoutsijärvi Citation2021; Broberg, Andersen, and Seim Citation2011) – in this case spanning the gap between researchers and practitioners – that mobilises research knowledge on the design-related sources of errors in OP systems (Setayesh et al. Citation2022b) in an actionable and practical way around the source of errors in manual OP operations. Having designed and built the tool based on scientific evidence (Setayesh et al. Citation2022a), it is important to test it with the target user groups ensuring their needs have been adequately met.
The purpose of this study is to assess the usability, functionality, and usefulness of the developed WEP tool from the perspective of potential end-users in qualitative and quantitative terms. Usability determines how easily and well a user can use a system to obtain the defined goal (Gulliksen, Boivie, and Göransson Citation2006). Functionality determines a system’s capability and accuracy to support making effective and practical decisions (Laumer et al. Citation2019). Usefulness determines a system’s capability to provide useful indicators to help users achieve higher system performance (Wright, Paroutis, and Blettner Citation2013). A tool with good usability, functionality, and usefulness can support users without requiring specific expertise in a particular area. These key dimensions are evaluated in the context of the WEP tool as part of the development of sociotechnical systems. The specific research questions addressed in this article are as follows:
RQ1 – What are the views of potential users, when surveyed quantitatively, on the following features of the WEP tool?
RQ1-a. What are potential users’ views on the usability of the WEP tool?
RQ1-b. What are potential users’ views on the functionality of the WEP tool?
RQ1-c. What are potential users’ views on the usefulness of the WEP tool?
RQ2 – How do participants perceive the usability, functionality, and usefulness of the WEP tool in qualitative terms?
2. Fundamentals of the research techniques
2.1. Methodology for user evaluation study
This study used mixed (quantitative and qualitative) methods in evaluating the WEP tool to complement the limitations of qualitative data collection with the strengths of quantitative techniques (Greene, Caracelli, and Graham Citation1989). The quantitative data measures the participants’ views of the tool’s usability, functionality, and usefulness. The qualitative data adds contextual information to explain complex issues, and it complements the quantitative data with insights on the participants’ thinking that influences their quantitative ratings (Grosse et al. Citation2016). This study was approved by the institutional ethics review board prior to the data collection.
Thirty-three participants from different industry sectors (manufacturing, production, fresh products, retail) were recruited for data collection and engaged in both the survey and the semi-structured interviews. Participant recruitment was initiated with an e-mail invitation that was sent to warehouse designers, facility designers, and warehouse supervisors that are familiar with the design of warehousing and manual OP operations in the sectors mentioned above. The recruiting process was conducted in Canada, the United Kingdom, and Iran providing different industrial contexts for the study. The WEP tool and user manual were provided to the recruited participants in advance. In each data collection event, the researcher worked with participants as they used the WEP tool to assess their operations and provided help as required. Both survey and semi-structured interview data collection were stopped when data saturation occurred and no additional insights were provided by the participants (Fusch and Ness Citation2015), suggesting an appropriate sample size had been achieved.
2.2. Survey study data collection
After using the WEP tool, participants were asked to complete the 10-question System Usability Scale (SUS) survey (Brooke Citation1986; see Table ) to assess usability and functionality aspects. The SUS technique is a standardised, reliable instrument for measuring various system and product usability and functionality aspects from the user’s perspective (Brooke Citation2013; Bangor, Philip, and James Citation2009). Each question in the SUS questionnaire uses a 5-point Likert scale format from 1 (strongly disagree) to 5 (strongly agree). Table shows the 10 SUS statements. Usability can be assessed by questions # 1, 2, 3, 7, 8, and 10 of the SUS survey. The functionality of the WEP tool can be assessed through questions # 4, 5, 6, and 9. The overall SUS score can be calculated by first subtracting five from the total score of odd-numbered questions and subtracting twenty-five from the total score of even-numbered questions. The outcome of these should be added up and multiplied by 2.5 (Brooke Citation1986). The usefulness of the WEP tool is examined by complementary survey questions (Table ).
Table 2. SUS statements (Brooke Citation2013) were measured using a 5-point Likert scale in 10 questions.
Table 3. Supplementary questions used to assess participants’ opinions using 5-point Likert scale (3 questions).
In the last section of the survey study, three supplementary questions, shown in Table , were asked to capture the participants’ opinions on the applicability and usefulness of the WEP tool. These questions also determine whether participants would like to use the WEP tool for their human-system design assessment.
2.3. Quantitative data analysis
Table summarises the used methods in this study. The Cronbach’s alpha was calculated for each variable to check the internal consistency of the survey instrument (Cronbach Citation1951; Tavakol and Dennick Citation2011; Vaske, Beaman, and Sponarski Citation2017; Bujang, Omar, and Baharum Citation2018).
Table 4. Techniques used for conducting the user evaluation study.
Since the responses are collected based on a distinct (ordinal) outcome variable, a non-parametric one-sample Chi-Square test was used to compare the distribution of participant responses to a chance distribution. A 5% level of significance was used to evaluate the statistical significance (Hamooya et al. Citation2016; Tanveer et al. Citation2021) with the null hypothesis being that the responses are distributed according to chance. The outcome of the survey analysis is used to answer RQ2.
2.4. Qualitative data collection – semi-structured interview
A qualitative, semi-structured interview was performed to supplement the questionnaire for each participant and provide a better understanding of the participants’ opinions on the usefulness, functionality, and usability of the WEP tool (Grosse et al. Citation2016). The interview helped to understand the WEP tool from the user’s standpoint as it allowed the interviewees to describe the logic and opinions behind their responses in their own words (Fontana and Fery Citation2000). The interview questions asked the interviewees to determine: (a) the parts of the WEP tool that they liked most or least, (b) the participant’s opinions on any design elements or error sources that were not included in the WEP tool, and (c) any recommendations or comments that may help improve the WEP tool. Probe questions were used when needed to clarify the participants’ responses. The interview sessions lasted about 45 min and were audio-recorded and transcribed for later analyses to identify key themes (Armat et al. Citation2018; Elo and Kyngäs Citation2008).
2.5. Qualitative data analysis
The interview data were coded in NVivo and analysed by using the thematic approach according to the methodology advocated by Braun and Clarke (Citation2006) to identify common themes in participants’ responses. In this study, data was reviewed thematically with an inductive approach to see what common issues/themes emerged (Elo and Kyngäs Citation2008). The defined RQs supported the themes which were defined deductively based on user evaluation criteria (per Table and Table ). To check the reliability of the coding scheme, two independent raters counted the occurrence of the defined themes on 20% of the data. The Interclass Correlation Coefficient (ICC) was generated between the two independent raters to check the agreement between the two raters (Nowell et al. Citation2017). Based on the two independent raters, an ICC was calculated. The ICC > 0.64 for all the defined themes indicated a strong agreement between the two raters (McHugh Citation2012, Citation2013). The remaining 80% of the data were coded by a single rater.
3. Results
The results from both the SUS survey and the interviews from the 33 recruited participants from different industry sectors and three different countries are presented below.
3.1. Results from the SUS survey technique
The Cronbach’s Alpha for the SUS survey outcome is equal to 0.812 indicating high reliability of the collected data (cf. Cronbach Citation1951). The summary of responses to the SUS survey is presented in Table .
Table 5. Descriptive statistics for SUS survey results (5-point Likert scale) for all participants.
The results from the Chi-square test for the SUS responses rejected the null hypothesis (that the responses were a chance distribution) for 9 out of 10 questions (Table ). This outcome indicates that participants generally agreed on their responses for these 9 items. Participants were inconsistent on question # 8, which evaluates how ‘cumbersome’ the participant found the WEP tool. SUS scores greater than 71.4 indicate ‘good’ WEP tool usability (Bangor, Philip, and James Citation2009). In this study, the SUS score from participants (mean SUS score = 81.06, SD = 16.75) indicates that participants found the WEP tool useable.
The participants’ opinions on the usability of the WEP tool can be supported through questions #2 (median = 1, p-value = 0.002) and #8 (median = 2, p-value = 0.178) in Table . The mode value responses indicate that the WEP tool was seen to be neither complex (question #2) nor cumbersome (question #8) to use. Although question #8 showed inconsistency between participants’ responses (p-value = 0.178), this inconsistency is generated as four participants’ responses to question #8 were neutral, while the same four participants selected ‘disagree’ to question #2 (tool complexity), indicating the WEP tool is unnecessarily complex, and suggesting mixed views on this point. For the functionality assessment, as seen in questions #5 (tool integration) and #6 (tool inconsistency) of Table , participants found the WEP tool generally functional. Participants expressed their opinions in their ratings of the functions in the WEP tool as well integrated (median = 4, p-value = 0.009) and that the WEP tool was seen to be consistent (median = 1, p-value = 0.001) in each different module.
The data analysis on the complementary questions (Table ) showed that participants generally ‘strongly agree’ on their responses to these three questions. The statistical data analysis indicates a significant agreement amongst the participants’ responses on the WEP tool usefulness with p < 0.05, as shown in Table . As seen in question #11, participants ‘strongly agreed’ on the helpfulness of the WEP tool for novice engineers with less field, ergonomics, and design experience (median = 4, p-value = 0.002). Question #12 revealed that participants also ‘strongly agree’ that the WEP tool is helpful for OP system improvement (median = 4, p-value = 0.004). Participants also ‘strongly agree’ that the WEP tool helps engineers and designers meet the operators’ HF needs in warehouse and OP system design (median = 4, p-value = 0.001).
Table 6. Descriptive statistics for significant Chi-square results for the usefulness of the WEP tool based on a participant’s opinion.
3.2. Themes emerging from the analysis of the interviews
Table provides a list of themes that emerged from the interviews and their corresponding definitions along with example modifiers from participant statements. The ‘+’ and ‘-’ modifiers in the ‘examples and modifiers’ column of Table indicate positive and negative comments within the theme, with the exception being in the ‘recommendation/feedback for future improvements’ theme, where the information addresses the participants’ suggestions/recommendations. The themes from the inductive analysis in Table are matched with survey criteria to cluster the findings with at least one survey criterion. For example, tool interaction, tool issues, and match/mismatch between tool and user manual themes address the WEP tool usability through the survey conducted in this study. The frequency distribution of participants’ comments for the defined themes associated with positive and negative modifiers is displayed in Figure .
Figure 2. Frequency distribution of positive and negative comments from participant interviews for the defined themes.
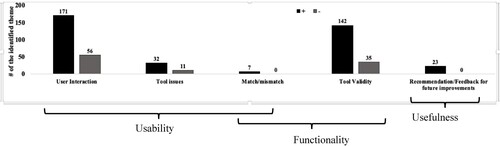
Table 7. List of themes and their corresponding definitions used in the thematic analysis.
3.2.1. Usability
The usability of the WEP tool is identified by participants’ responses, which were classified under ‘user interaction’, ‘tool issues’, and ‘match/mismatch between tool and user manual’ themes per Table and Figure . In the interview sessions, 29 out of 33 participants stated that the WEP tool was easy to use and requires minimum technical knowledge or support as different aspects of designs were addressed through straightforward questions and sub-questions. One participant commented, for example: ‘The tool is classified wisely … makes it very simple and straightforward’. Although the majority of the participants found the WEP tool usable, four participants made negative statements about the usability of the WEP tool. One participant described it as ‘long and time-consuming’.
3.2.2. Functionality
The functionality of the WEP tool is identified by the participants’ responses (Table ) that were classified based on ‘tool validity’ and ‘tool issues’ themes per Table and Figure . Twenty-two out of 33 participants expressed their satisfaction with the functionality of the WEP tool. The majority of the participants found the WEP modules to be very accurate and detail-oriented as different aspects of the OP system design were addressed through questions and sub-questions. One participant commented, for example: ‘The tool and user manual are very accurate and elaborate all the design elements precisely … The palletizing/batching model even indicates the range of appropriate movements to prevent physical fatigue’. Despite the majority of positive responses, eleven participants raised a few concerns about the functionality of the WEP tool. Three out of eleven of these participants mentioned the important role of assistive information technologies in their warehouse by addressing the limitation of the WEP tool in covering those technologies. One participant commented, for example: ‘We are using assistive pick technologies such as gloves and smart glasses … the tool has not addressed any requirements in selecting pick technologies to become efficient’. Four out of eleven concerns raised were related to the lack of functionality of the WEP tool in considering optimisation and simulation modelling, such as optimised storage assignment and routing strategies. A few participants evaluated the paper checklist style as a limitation of the WEP tool. They expressed a desire to have the WEP tool embedded in their main IT system. One participant explained:
The WEP tool works pretty well on Microsoft Office Word, but we are using assistive warehousing software management tools such as SAP … having a tool in program or application-based to make it more practical … It could be useful for a wider range of companies, especially those having international warehouse locations.
The WEP tool provides a summary of the human-system influencing factors that have not been considered in the design. However, it does not quantify the associated risk level which makes the decision-making on prioritizing the design and/or process improvements challenging.
3.2.3. Usefulness
The usefulness of the WEP tool is identified by the participants’ responses that were classified under the ‘recommendation/feedback for future improvements’ theme per Table and Figure . Participants described the WEP tool as very useful to not only design an effective warehouse facility, but also for process improvements and training purposes. Participants found the WEP tool very useful for addressing the need of novice engineers to address HF aspects in design. They also indicated that the WEP tool is useful for both warehouse facility design as well as human-system design improvements. One participant commented, for example:
It can assist engineers during the lean Six Sigma processes to identify the design flaws … module 4 also can help ergonomics improvement as determining the low-risk movements.
4. Discussion
Evaluation of a novel tool with potential users is unusual in production research. The interview results supported the quantitative survey study outcomes, but also helped to identify a number of issues that could be used to improve the WEP tool. The participants’ positive comments indicated that they saw the WEP tool as a suitable and practical method for supporting designers, engineers and managers to prevent the source of errors in their OP systems. This section first discusses the acceptance of the WEP tool by end-users (sub-section 4.1), and then it points out implications for managers and engineers (sub-section 4.2). Sub-sections 4.3 and 4.4 then discuss the possibility of considering other elements (e.g. assistive pick technologies, risk scores) in the design of the WEP tool. The final sub-section (4.5) discusses some methodological aspects of this study.
4.1. WEP tool acceptance by users
Participants found the WEP tool generally useable and useful for considering the role of humans in OP system design to identify possible error sources. These results can be interpreted in light of the broadly discussed technology acceptance model (TAM) of Davis (Citation1986), which suggests that a given technology or innovation – in this case, the WEP tool – is likely to be acceptable to users if it has both high perceived usefulness and good ease of use; two key precursors to the adoption of new technologies (Venkatesh and Davis Citation1996). The current study suggests that the WEP tool is capable to fulfil both cost and utility needs since it suggests design changes at an early stage of the design where the cost of changes are lower when aiming for a better human-system design interaction (Miles and Swif Citation1998). Despite the promising outcome on the WEP tool evaluation, research in behavioural operations management suggests that some workers may be averse to relying on unfamiliar algorithms/tools to perform a task (Healy and Moore Citation2007). In this study, some participants reported being ‘familiar with all the requirements to effectively design an OP system’; this view may represent an example of overconfidence bias (Healy and Moore Citation2007), which can be overcome by using appropriate decision and improvement efforts. As an example, providing comprehensive guidelines to end-users similar to the WEP tool user manual could be a practical strategy to be considered.
4.2. Implications for managers and engineers
The WEP tool illustrates the relationship between HF in system design and system performance, in this case, quality. Quality has been referred to by Sgarbossa et al. (Citation2020) as an important element in logistics system design. HF aspects have also been broadly linked to errors and quality deficits in manufacturing settings (Kolus, Wells, and Neumann Citation2018) with fatigue as a noteworthy common causal element (Yung et al. Citation2020). In OP systems, fatigue, both mental and physical, emerged as an important contributor to human-system errors (Setayesh et al. Citation2022b); long-term fatigue can cause a greater risk of musculoskeletal disorders, human error, and quality deficits (Bláfoss et al. Citation2019; Sarter and Amalberti Citation2000). The chain of effects in manual OP operations are reported to start from system design elements that define the tasks in OP operations, and therefore the HF demands on order pickers (Setayesh et al. Citation2022b). If an individual’s capacity is exceeded while performing a task, individual and system performance may be affected negatively, causing human-system errors to occur. Previous research has noted that the absence of tools is a barrier for engineers in applying HF in design (Village et al. Citation2015; Broberg Citation2010) – a gap addressed by the WEP tool. While the WEP tool evaluation conducted here aimed at identifying error risks in existing OP systems, it could also be applied in system design stages where the costs of eliminating error risks are much cheaper than retrofitting scenarios (Neumann and Village Citation2012; Neumann et al. Citation2006). Items identified in the WEP tool can help reduce pick errors as result of wrong item selection, wrong quantity of item selection, and damaged items due to poor material handling. Each item in the WEP tool presents specific design criteria for potential system improvements. This research needs to be extended to consider cost and benefit profiles of creating high reliability in OP systems.
Much too often, organisations do not consider HF as a discipline that can contribute to organisational goals such as higher quality and lower error likelihood (Dul and Neumann Citation2009). Similarly, HF aspects are often ignored in production and logistics research (Neumann et al. Citation2021; Grosse, Glock, and Neumann Citation2017). This neglect of HF in systems design may be due to its lack of attention from both engineers and designers (Sgarbossa et al. Citation2020; Neumann et al. Citation2021). Engineers often see HF as merely a safety issue (Theberge and Neumann Citation2013; Broberg, Andersen, and Seim Citation2011; Broberg Citation2010) and fail to recognise the extent to which HF in system design can contribute to quality and process improvements (Kolus, Wells, and Neumann Citation2018; Yung et al. Citation2020). This approach is suggesting that the organisation integrates HF into engineering requirements for performance improvement objectives. The critical question is who should attend to humans in a system and to what extent? Particularly, as it was quoted by a participant ‘my department is only responsible for the optimized design process’, for example. The users identified the potential for the WEP tool to impact cross-departmental relationships by connecting HF to an organisational strategy that not only increases the potential of social goals (workers’ well-being), but also improves economic goals (higher quality and system performance). In this case, the WEP tool may be able to act as a ‘boundary-spanning object’ (Ipsen et al. Citation2020; Broberg, Andersen, and Seim Citation2011) allowing and educating even non-specialists (engineers, managers) to identify and communicate the possible impacts of poor human-system design interaction on the risks of errors in their logistic systems. We note that this systematizing of the quality risk assessment may be useful even in the face of overconfidence (Bendoly et al. Citation2010; Healy and Moore Citation2007), as systematic checklists like the WEP tool have been successfully applied by experts in aviation and medical systems (Clay-Williams and Colligan Citation2015) to avoid missing or mis-sequencing necessary hazard checks.
4.3. On the possibility of risk scores
Some participants expressed interest in obtaining quantitative data based on risk scores. The WEP tool provides a report on the factors causing poor human-system interaction, but does not measure the error risk levels. The WEP tool instead provides simple pass/fail rules aimed at helping users identify improvement opportunities. There are different human reliability assessment (HRA) models that have been developed to quantify human error probability. Applying these models for assessment is challenging as current HRA models do not aim at low-risk domains such as OP systems and do not connect error sources to system design elements (Setayesh, Di Pasquale, and Neumann Citation2022c). Further research studies are needed to understand if such quantitative output, and the associated complexity for users, are needed by potential users who want to balance the costs of change against the possible benefits of improved quality.
4.4. Integrating new technologies and operational paradigms
A few participants raised concerns about the lack of inclusion of particular assistive information technologies as a WEP tool limitation. Since the focus of the WEP tool is on HF in system design that are associated with quality deficits in OP, the current version of the WEP tool only considers very common assistive technologies (e.g. barcodes, and scanners). Considering the fast pace of technology development, OP 4.0 (Winkelhaus and Grosse Citation2020; Winkelhaus, Grosse, and Morana Citation2021), and assistive technologies (Glock et al. Citation2021; Grosse Citation2023), embedding new assistive technologies in the WEP tool will be an ongoing issue – particularly since HF considerations are routinely ignored in Industry 4.0 research (Neumann et al. Citation2021). With growing interest in Industry 4.0 and 5.0 paradigms (Breque, De Nul, and Petridis Citation2021), assistive technologies can contribute to performing tasks faster and more efficiently with fewer pick errors (Teo et al. Citation2021; Mandar, Dachry, and Bensassi Citation2020). Other studies have identified downsides to these technologies such as users’ mental fatigue and stress (Setayesh et al. Citation2022b; Neumann et al. Citation2021). This is consistent with sociotechnical systems theory – an extension of general systems theory – that identifies the mismatch between the technical system design and the social (human) sub-system as a source of dysfunction that leads to both system performance and human well-being problems (Skyttner Citation2001; IEA Citation2014). When human-system interactions are poorly designed, then errors and injuries can be expected that will compromise the anticipated profitability of the investment – a phenomenon referred to as ‘phantom profits’ (Neumann et al. Citation2021). Since the general human condition is not changeable, responsibility for errors lies substantially with the system designers who establish the conditions for error. While these design-induced error risks might be reduced with extensive operator training, appropriate attention to human-system interactions in design can address error risks already in early design stages where costs are lowest and benefits of the enhanced reliability are maximal. As such, the WEP tool can help optimise the fit between the technology and human elements of the OP system by helping practitioners improve their system designs in cost-effective ways that reduce the impact of known error inducing design flaws.
4.5. Future work and methodological considerations
A few participants commented on their interest to embed optimisation modelling into the WEP tool and/or implement the WEP tool directly in IT systems (e.g. Enterprise Resource Planning or Warehouse Management System). Embedding optimisation modules such as storage location assignment with respect to item turnover and minimising workers’ energy expenditures (e.g. Diefenbach and Glock Citation2019) can generally be considered. However, optimisation is a different research area which is not compatible with the goal of the WEP tool as optimisation mostly reflects on efficiency (Lee, Chung, and Yoon Citation2020; Roodbergen, Vis, and Taylor Citation2015). These remarks signal the need to integrate the WEP tool human-system design determination with other parts of the planning system. Embedding the WEP tool into the IT system remains for future research to allow for holistic planning such as layout, storage assignment, and routing optimizations.
This study has some limitations. While the sample is limited to only 33 participants, we observed that the qualitative data were saturated and the survey study showed statistical consistency on most constructs. Although the results were largely consistent, outlier views and useful improvement opportunities did emerge from the supporting interviews – a benefit of mixed methods research. It is possible that other participants working in different OP system contexts might raise new issues on identifying pick error risks in their system designs. The WEP tool can also be tried by order pickers which may bring a different perspective as they have to put the design into action; which remains for future validation studies. The focus of the WEP tool was on improving the quality of an OP system by integrating HF into the system design. This study used a questionnaire survey; however, using other usability assessment methods such as focus groups (Ryan et al. Citation2014; Onwuebuzie et al. Citation2009), contextual interviews (Holtzblatt and Jones Citation1995), and heuristic evaluations (Nielsen Citation1994) may provide further insights into the tool’s usability and utility. The data analysis was conducted based on users’ experience by using the WEP tool in a single interactive session. Further empirical studies for WEP tool validation in different OP application scenarios as well as continuous improvement efforts is warranted. Finally, we note that field validation – of the impacts of each WEP tool item on actual OP quality performance in OP systems – remains a task for future research.
5. Conclusion
The Warehouse Error Prevention (WEP) tool represents a mechanism for the transfer of scientific knowledge of HF sources of error in OP system design to warehouse stakeholders. Evaluating the tool is an important part of the creation of new approaches for practitioners to ensure the tool design matches user needs; an important objective and a precursor to future impact validation studies. The WEP tool was evaluated in trial applications using a survey (the SUS questionnaire with supplemented questions) and semi-structured interviews with 33 participants from 27 companies in three countries. The study outcome showed that 21 out of 33 participants found the WEP tool usable, functional, and useful. Most of the participants were satisfied with the usability and functionality of the WEP tool which helps to integrate HF into the warehouse and OP design and organisational management criteria. The majority of the participants found that the WEP tool could help them identify, and therefore prevent, the design level source of pick errors in warehousing and OP systems. Participants suggested the WEP tool could support both OP system process improvement and OP system design processes. As a tool that addresses the HF issues in system design, the WEP tool has boundary-spanning potential helping engineers and managers understand the design-related HF issues in their systems and providing an opportunity for ergonomists to understand the quality (and not just injury) implications of HF in the system. Future extensions to the WEP tool could address optimisation modelling, risk scoring, and the rise of new technologies while maintaining the goal of optimising human-system interaction by supporting good design. While further development is warranted, the current version of the WEP tool appears to be a useful and easy-to-use tool to help improve quality in OP system design and management.
Acknowledgements
The first author wishes to thank the very kind support provided to her, as a visiting researcher, by the Technical University of Darmstadt, Darmstadt Germany. This work was also supported by a fellowship within the Doctoral Programme of the German Academic Exchange Service (DAAD).
Data availability statement
Due to the nature of this research, participants of this study did not agree for their data to be shared publicly, so supporting data is not available.
Disclosure statement
No potential conflict of interest was reported by the author(s).
Correction Statement
This article has been corrected with minor changes. These changes do not impact the academic content of the article.
Additional information
Funding
Notes on contributors

Azin Setayesh
Azin Setayesh received her PhD at the Department of Mechanical and Industrial Engineering of Ryerson University, Canada. Her research interests include operations management and human factors engineering.

Eric H. Grosse
Eric H. Grosse is a Junior Professor and the Head of the Chair of Business Management and Digital Transformation in Operations Management at Saarland University, Germany. He is also Senior Research Fellow at the Institute of Production and Supply Chain Management at Technical University of Darmstadt, Germany. His research interests include warehouse optimisation as well as sustainability and digitalisation in production and logistics.

Michael A. Greig
Michael A. Greig is a postdoctoral fellow and research associate in the Human Factors Engineering Lab at Ryerson University. His research work develops approaches to understand and improve human factors and ergonomics inclusion and reporting in organisation processes.

Christoph H. Glock
Christoph H. Glock is a Full Professor and the Head of the Institute of Production and Supply Chain Management at Technical University of Darmstadt, Germany. His research interests include inventory management, supply chain management, warehousing, sustainable production, and human factors in logistics and inventory systems.

W. Patrick Neumann
W. Patrick Neumann is a Full Professor in the Department of Mechanical and Industrial Engineering of Ryerson University, Canada. Current research, conducted at the Human Factors Engineering Lab, focuses on the design of work systems that are both effective and sustainable from human and technical perspectives. He is a Design Scientist and certified human factors professional (Eur. Erg.).
References
- Abe, D., S. Muraki, and A. Yasukouchi. 2008. “Ergonomic Effects of Load Carriage on the Upper and Lower Back on Metabolic Energy Cost of Walking.” Applied Ergonomics 39 (3): 392–398. doi:10.1016/j.apergo.2007.07.001.
- Armat, M. R., A. Abdolghader, R. Mostafa, S. Hassan, and H. Abbas. 2018. “Inductive and Deductive: Ambiguous Labels in Qualitative Content Analysis.” Qualitative Report 23 (1): 219–221. doi:10.46743/2160-3715/2018.2872.
- Bangor, A., K. Philip, and M. James. 2009. “Determining What Individual SUS Scores Mean: Adding an Adjective Rating Scale.” Journal of Usability Studies 4 (3): 114–123.
- Battini, D., M. Calzavara, A. Persona, and F. Sgarbossa. 2015. “A Comparative Analysis of Different Paperless Picking Systems.” Industrial Management & Data Systems 115 (3): 483–503. doi:10.1108/IMDS-10-2014-0314
- Bendoly, E., R. Croson, P. Goncalves, and K. Schultz. 2010. “Bodies of Knowledge for Research in Behavioral Operations.” Production and Operations Management 19 (4): 434–452. doi:10.1111/j.1937-5956.2009.01108.x.
- Bindi, F., R. Manzini, A. Pareschi, and A. Regattieri. 2009. “Similarity-Based Storage Allocation Rules in an Order Picking System: An Application to the Food Service Industry.” International Journal of Logistics Research and Applications 12 (4): 233–247. doi:10.1080/13675560903075943.
- Bláfoss, R., E. Sundstrup, M. Jakobsen, M. Brandt, H. Bay, and L. Andersen. 2019. “Physical Workload and Bodily Fatigue After Work: Cross-Sectional Study among 5000 Workers.” European Journal of Public Health 29 (5): 837–842. doi:10.1093/eurpub/ckz055.
- Bódis, T., J. Botzheim, and P. Földesi. 2018. “Necessity and Complexity of Order Picking Routing Optimisation Based on Pallet Loading Features.” Acta Universitatis Sapientiae Informatica 9 (2): 162–194. doi:10.1515/ausi-2017-0011.
- Braun, V., and V. Clarke. 2006. “Using Thematic Analysis in Psychology.” Qualitative Research in Psychology 3 (2): 77–101. doi:10.1191/1478088706qp063oa.
- Breque, M., L. De Nul, and A. Petridis. 2021. Industry 5.0: Towards a More Sustainable, Resilient and Human-Centric Industry. https://ec.europa.eu/info/news/industry-50-towards-more-sustainable-resilient-and-human-centric-industry-2021-jan-07_en.
- Broberg, O. 2010. “Workspace Design: A Case Study Applying Participatory Design Principles of Healthy Workplaces in an Industrial Setting.” International Journal of Technology Management 51 (1): 39–56. doi:10.1504/IJTM.2010.033127.
- Broberg, O., V. Andersen, and R. Seim. 2011. “Participatory Ergonomics in Design Processes: The Role of Boundary Objects.” Applied Ergonomics 42 (3): 464–472. doi:10.1016/j.apergo.2010.09.006.
- Brooke, J. 1986. “SUS—A Quick and Dirty Usability Scale.” Usability Evaluation in Industry, 189–194.
- Brooke, J. 2013. “SUS: A Retrospective.” Journal of Usability Studies 8 (2): 29–40. doi:10.5281/zenodo.1000456.
- Bujang, M. A., E. D. Omar, and N. A. Baharum. 2018. “A Review on Sample Size Determination for Cronbach’s Alpha Test: A Simple Guide for Researchers.” Malaysian Journal of Medical Sciences 25 (6): 85–99. doi:10.21315/mjms2018.25.6.9.
- Calzavara, M., C. H. Glock, E. H. Grosse, A. Persona, and F. Sgarbossa. 2017. “Analysis of Economic and Ergonomic Performance Measures of Different Rack Layouts in an Order Picking Warehouse.” Computers & Industrial Engineering 111: 527–536. doi:10.1016/j.cie.2016.07.001.
- Chen, S. Y., W. C. Wu, C. S. Chang, and C. T. Lin. 2015. “Job Rotation and Internal Marketing for Increased job Satisfaction and Organisational Commitment in Hospital Nursing Staff.” Journal of Nursing Management 23 (3): 297–306. doi:10.1111/jonm.12126.
- Chuang, Y. F., H. T. Lee, and Y. C. Lai. 2012. “Item-Associated Cluster Assignment Model on Storage Allocation Problems.” Computers & Industrial Engineering 63 (4): 1171–1177. doi:10.1016/j.cie.2012.06.021.
- Clay-Williams, R., and L. Colligan. 2015. “Back to Basics: Checklists in Aviation and Healthcare.” BMJ Quality & Safety 24 (7): 428–431. doi:10.1136/bmjqs-2015-003957.
- Coenen, P., I. Kingma, C. Boot, P. Bongers, and J. van Dieën. 2014. “Cumulative Mechanical Low-Back Load at Work Is a Determinant of Low-Back Pain.” Occupational and Environmental Medicine 71 (5): 332–337. doi:10.1136/oemed-2013-101862.
- Cronbach, L. J. 1951. “Coefficient Alpha and the Internal Structure of Tests.” Psychometrika 16: 297–334. doi:10.1007/BF02310555.
- Davis, F. D. 1986. “A Technology Acceptance Model for Empirically Testing New End-User Information Systems: Theory and Results.” Doctoral diss., Massachusetts Institute of Technology.
- De Koster, R., T. Le-Duc, and K. Roodbergen. 2007. “Design and Control of Warehouse Order Picking: A Literature Review.” European Journal of Operational Research 182 (2): 481–501. doi:10.1016/j.ejor.2006.07.009.
- De Lombaert, T., K. Braekers, R. De Koster, and K. Ramaekers. 2022. “In Pursuit of Humanised Order Picking Planning: Methodological Review, Literature Classification and Input from Practice.” International Journal of Production Research, 1–31. doi:10.1080/00207543.2022.2079437
- De Vries, J., R. De Koster, and D. Stam. 2016. “Exploring the Role of Picker Personality in Predicting Picking Performance with Pick by Voice, Pick to Light and RF-Terminal Picking.” International Journal of Production Research 54 (8): 2260–2274. doi:10.1080/00207543.2015.1064184.
- Diefenbach, H., and C. Glock. 2019. “Ergonomic and Economic Optimization of Layout and Item Assignment of a U-Shaped Order Picking Zone.” Computers & Industrial Engineering 138: 106–127. doi:10.1016/j.cie.2019.106094.
- Di Pasquale, V., S. Miranda, and W. P. Neumann. 2020. “Ageing and Human-System Errors in Manufacturing: A Scoping Review.” International Journal of Production Research 58 (15): 4716–4740. doi:10.1080/00207543.2020.1773561.
- Dul, J., and W. P. Neumann. 2009. “Ergonomics Contributions to Company Strategies.” Applied Ergonomics 40 (4): 745–752. doi:10.1016/j.apergo.2008.07.001.
- Elbert, R. M., T. Franzke, C. H. Glock, and E. H. Grosse. 2017. “The Effects of Human Behavior on the Efficiency of Routing Policies in Order Picking: The Case of Route Deviations.” Computers & Industrial Engineering 111: 537–551. doi:10.1016/j.cie.2016.11.033.
- Elo, S., and H. Kyngäs. 2008. “The Qualitative Content Analysis Process.” Journal of Advanced Nursing 62 (1): 107–115. doi:10.1111/j.1365-2648.2007.04569.x.
- Fontana, A., and K. J. Fery. 2000. “The Interview: From Structured Questions to Negotiated Text.” In Handbook of Qualitative Research. 2nd ed, edited by N. K. Denzin and Y. S. Lincoln, 645–672. Thousand Oaks, CA: Sage.
- Fragapane, G., R. de Koster, F. Sgarbossa, and J. Strandhagen. 2021. “Planning and Control of Autonomous Mobile Robots for Intralogistics: Literature Review and Research Agenda.” European Journal of Operational Research 294 (2): 405–426. doi:10.1016/j.ejor.2021.01.019.
- Frazelle, E. H. 2015. World-Class Warehousing and Material Handling. New York: McGraw-Hill Education.
- Fusch, P., and L. Ness. 2015. “Are We There Yet? Data Saturation in Qualitative Research.” The Qualitative Report 20 (9): 1408. doi:10.46743/2160-3715/2015.1128.
- Glock, C. H., E. H. Grosse, W. P. Neumann, and A. Feldman. 2021. “Assistive Devices for Manual Materials Handling in Warehouses: A Systematic Literature Review.” International Journal of Production Research 59 (11): 3446–3469. doi:10.1080/00207543.2020.1853845.
- Greene, J. C., V. J. Caracelli, and W. F. Graham. 1989. “Toward a Conceptual Framework for Mixed-Method Evaluation Designs.” Educational Evaluation and Policy Analysis 11 (3): 255–274. doi:10.3102/01623737011003255.
- Grosse, E. H. 2023. “Application of Supportive and Substitutive Technologies in Manual Warehouse Order Picking: A Content Analysis.” International Journal of Production Research, 1–20. doi:10.1080/00207543.2023.2169383
- Grosse, E. H., S. Dixon, W. P. Neumann, and C. H. Glock. 2016. “Using Qualitative Interviewing to Examine Human Factors in Warehouse Order Picking: Technical Note.” International Journal of Logistics Systems and Management 23 (4): 499–518. doi:10.1504/IJLSM.2016.075211.
- Grosse, E. H., C. H. Glock, M. Jaber, and W. P. Neumann. 2015. “Incorporating Human Factors in Order Picking Planning Models: Framework and Research Opportunities.” International Journal of Production Research 53 (3): 695–717. doi:10.1080/00207543.2014.919424.
- Grosse, E. H., C. H. Glock, and W. P. Neumann. 2017. “Human Factors in Order Picking: A Content Analysis of the Literature.” International Journal of Production Research 55 (5): 1260–1276. doi:10.1080/00207543.2016.1186296.
- Gulliksen, J., I. Boivie, and B. Göransson. 2006. “Usability Professionals—Current Practices and Future Development.” Interacting with Computers 18 (4): 568–600. doi:10.1016/j.intcom.2005.10.005.
- Guo, A., S. Raghu, X. Xie, S. Ismail, X. Luo, J. Simoneau, and T. Starner. 2014. “A Comparison of Order Picking Assisted by Head-Up Display (HUD), Cart-Mounted Display (CMD), Light, and Paper Pick List.” In International Semantic Web Conference, 13–17.
- Hamooya, B. M., G. Chongwe, R. Dambe, and H. Halwiindi. 2016. “Treatment-Seeking Behaviour for Childhood Fever among Caretakers of Chivuna and Magoye Rural Communities of Mazabuka District, Zambia: A Longitudinal study.” BMC Public Health 16 (1). doi:10.1186/s12889-016-3460-8
- Häusser, J. A., A. Mojzisch, A. Niesel, and S. Schulz-Hardt. 2010. “Ten Years on: A Review of Recent Research on the Job Demand-Control (-Support) Model and Psychological Well-Being.” Work & Stress 24 (1): 1–35. doi:10.1080/02678371003683747.
- Healy, P., and D. Moore. 2007. Bayesian Overconfidence. Available at SSRN 1001820.
- Holtzblatt, K., and S. Jones. 1995. “Conducting and Analyzing a Contextual Interview (Excerpt).” In Readings in Human-Computer Interaction: Toward the Year 2000, edited by R. M. Baecker, J. Grudin, W. A. S. Buxton, and S. Greenberg, 329–337. Morgan Kaufmann.
- IEA Council (International Ergonomics Association). 2014. “Definition and Domains of Ergonomics.” In Secondary Definition and Domains of Ergonomics, edited by Secondary IEA Council. International Ergonomics Association.
- Ipsen, C., S. Poulsen, L. Gish, and M. Kirkegaard. 2020. “Continuous Evaluation of Participants’ Perceptions of Impact: Applying a Boundary Object in Organizational-Level Interventions.” Human Factors and Ergonomics in Manufacturing & Service Industries 30 (3): 149–164. doi:10.1002/hfm.20830.
- Jacobs, P. 2004. “Kodak's Ergonomic Design for People at Work.” Professional Safety 49 (3): 49. doi:10.1002/9780470172469.
- Kampkötter, P., C. Harbring, and D. Sliwka. 2018. “Job Rotation and Employee Performance – Evidence from a Longitudinal Study in the Financial Services Industry.” The International Journal of Human Resource Management 29 (10): 1709–1735. doi:10.1080/09585192.2016.1209227.
- Kolus, A., R. Wells, and W. P. Neumann. 2018. “Production Quality and Human Factors Engineering: A Systematic Review and Theoretical Framework.” Applied Ergonomics 73: 55–89. doi:10.1016/j.apergo.2018.05.010.
- Lattal, K. A. 2014. “Performance Management: Changing Behavior That Drives Organizational Effectiveness, Fifth Edition.” Performance Improvement 53 (10): 38–41. doi:10.1002/pfi.21445.
- Laumer, I., A. Auersperg, T. Bugnyar, and J. Call. 2019. “Orangutans (Pongo abelii) Make Flexible Decisions Relative to Reward Quality and Tool Functionality in a Multi-Dimensional Tool-Use Task.” PLoS ONE 14 (2): e0211031. doi:10.1371/journal.pone.0211031.
- Lee, I., S. Chung, and S. Yoon. 2020. “Two-Stage Storage Assignment to Minimize Travel Time and Congestion for Warehouse Order Picking Operations.” Computers & Industrial Engineering 139: 106–129.
- Lind, C. M., M. Forsman, and L. M. Rose. 2019. “Development and Evaluation of RAMP I – A Practitioner’s Tool for Screening of Musculoskeletal Disorder Risk Factors in Manual Handling.” International Journal of Occupational Safety and Ergonomics 25 (2): 165–180. doi:10.1080/10803548.2017.1364458.
- Lind, C. M., M. Forsman, and L. M. Rose. 2020. “Development and Evaluation of RAMP II - A Practitioner’s Tool for Assessing Musculoskeletal Disorder Risk Factors in Industrial Manual Handling.” Ergonomics 63 (4): 477–504. doi:10.1080/00140139.2019.1710576.
- Mandar, E. M., W. Dachry, and B. Bensassi. 2020. “Toward a Real-Time Picking Errors Prevention System Based on RFID Technology. Advances on Smart and Soft Computing.” Proceedings of ICAC, 303–318.
- Manzini, R. 2012. Warehousing in the Global Supply Chain: Advanced Models, tools and applications for storage systems. London: Springer.
- Masae, M., C. Glock, and P. Vichitkunakorn. 2020. “Optimal Order Picker Routing in a Conventional Warehouse with Two Blocks and Arbitrary Starting and Ending Points of a Tour.” International Journal of Production Research 58 (17): 5337–5358. doi:10.1080/00207543.2020.1724342.
- McAtamney, L., and E. N. Corlett. 1993. “RULA: A Survey Method for the Investigation of Work-Related Upper Limb Disorders.” Applied Ergonomics 24 (2): 91–99. doi:10.1016/0003-6870(93)90080-S.
- McHugh, M. L. 2012. “Interrater Reliability: The Kappa Statistic.” Biochemia Medica 22 (3): 276–282. doi:10.11613/BM.2012.031.
- McHugh, M. L. 2013. “The Chi-Square Test of Independence.” Biochemia Medica 23 (2): 143–149. doi:10.11613/BM.2013.018.
- Miles, B. L., and K. G. Swif. 1998. “Design for Manufacture and Assembly.” Manufacturing Engineer 77: 221–224.
- Neumann, W. P., and J. Village. 2012. “Ergonomics Action Research II: A Framework for Integrating HF into Work System Design.” Ergonomics 55 (10): 1140–1156. doi:10.1080/00140139.2012.706714.
- Neumann, W. P., J. Winkel, L. Medbo, R. Magneberg, and S. E. Mathiassen. 2006. “Production System Design Elements Influencing Productivity and Ergonomics - A Case Study of Parallel and Serial Flow Strategies.” International Journal of Operations & Production Management 26 (8): 904–923. doi:10.1108/01443570610678666.
- Neumann, W. P., S. Winkelhaus, E. H. Grosse, and C. H. Glock. 2021. “Industry 4.0 and the Human Factor – A Systems Framework and Analysis Methodology for Successful Development.” International Journal of Production Economics 233: 107992. doi:10.1016/j.ijpe.2020.107992.
- Nielsen, J. 1994. “Usability Inspection Methods.” In Conference Companion on Human Factors in Computing Systems CHI 94, 413–414. Boston.
- Nowell, L., J. Norris, D. White, and N. Moules. 2017. “Thematic Analysis.” International Journal of Qualitative Methods 16 (1): 1–13. doi:10.1177/1609406917733847.
- Ojansivu, I., K. Kettunen, and K. Alajoutsijärvi. 2021. “At the Temporary-Permanent Interface: Overcoming Knowledge Boundaries with Boundary Objects.” Scandinavian Journal of Management 37: 101–150. doi:10.1016/j.scaman.2021.101150.
- Onwuegbuzie, A. J., W. B. Dickinson, N. L. Leech, and A. G. Zoran. 2009. “A Qualitative Framework for Collecting and Analyzing Data in Focus Group Research.” International Journal of Qualitative Methods 8 (3): 1–21.
- Rasmussen, J. 1981. “Models of Mental Strategies in Process Plant Diagnosis.” In Human Detection and Diagnosis of System Failures, 241–258. doi:10.1007/978-1-4615-9230-3_17.
- Rasmussen, J., and W. B. Rouse. 2013. Human Detection and Diagnosis of System Failures. Vol. 15. Springer Science & Business Media. New York: Plenum.
- Roodbergen, K. J., F. Vis, and G. D. Taylor. 2015. “Simultaneous Determination of Warehouse Layout and Control Policies.” International Journal of Production Research 53 (11): 3306–3326. doi:10.1080/00207543.2014.978029.
- Ryan, K. E., T. Gandha, M. J. Culbertson, and C. Carlson. 2014. “Focus Group Evidence: Implications for Design and Analysis.” American Journal of Evaluation 35 (3): 328–345. doi:10.1177/1098214013508300.
- Salmon, P., G. H. Walker, and N. A. Stanton. 2016. “Pilot Error versus Sociotechnical Systems Failure: A Distributed Situation Awareness Analysis of Air France 447.” Theoretical Issues in Ergonomics Science 17 (1): 64–79. doi:10.1080/1463922X.2015.1106618.
- Salvendy, G. 2012. Handbook of Human Factors and Ergonomics. John Wiley and Sons, Inc. doi:10.1002/9781118131350.ch44.
- Sarter, N. B., and R. Amalberti, eds. 2000. Cognitive Engineering in the Aviation Domain. 1st ed. CRC Press. doi:10.1201/b12462.
- Setayesh, A., V. Di Pasquale, and W. P. Neumann. 2022c. “An Inter-Method Comparison of Four Human Reliability Assessment Models.” Applied Ergonomics 102: 103750. doi:10.1016/j.apergo.2022.103750.
- Setayesh, A., M. A. Greig, E. H. Grosse, C. H. Glock, and W. P. Neumann. 2022a. WEP Checklist Tool. Toronto Metropolitan University. doi:10.32920/ryerson.21231767.v2.
- Setayesh, A., E. H. Grosse, C. H. Glock, and W. P. Neumann. 2022b. “Determining the Source of Human-System Errors in Manual Order Picking with Respect to Human Factors.” International Journal of Production Research 60 (20): 6350–6372. doi:10.1080/00207543.2021.1991022.
- Sgarbossa, F., E. H. Grosse, W. P. Neumann, D. Battini, and C. H. Glock. 2020. “Human Factors in Production and Logistics Systems of the Future.” Annual Reviews in Control 49: 295–305. doi:10.1016/j.arcontrol.2020.04.007.
- Skyttner, L. 2001. General Systems Theory - Ideas and Applications. London: World Scientific.
- Tanveer, S. A., A. Afaq, M. N. Alqutub, N. Aldahiyan, A. M. AlMubarak, A. C. Shaikh, M. Naseem, F. Vohra, and T. Abduljabbar. 2021. “Association of Self-Perceived Psychological Stress with the Periodontal Health of Socially Deprived Women in Shelter Homes.” International Journal of Environmental Research and Public Health 18 (10): 5160. doi:10.3390/ijerph18105160.
- Tavakol, M., and R. Dennick. 2011. “Making Sense of Cronbach's Alpha.” International Journal of Medical Education 2: 53–55. doi:10.5116/ijme.4dfb.8dfd.
- Teo, M. E. W., B. Y. Chia, Y. C. Lee, P. Tay, J. Wong, S. Lee, M. Lim, and M. Cheen. 2021. “Cost-Effectiveness of Two Technology-Assisted Manual Medication Picking Systems versus Traditional Manual Picking in a Hospital Outpatient Pharmacy.” European Journal of Hospital Pharmacy 28 (2): 100–105. doi:10.1136/ejhpharm-2019-001997.
- Theberge, N., and W. P. Neumann. 2013. “The Relative Role of Safety and Productivity in Canadian Ergonomists’ Professional Practices.” Relations Industrielles 68: 387–408. doi:10.7202/1018433ar.
- Tompkins, J. A., J. A. White, A. B Yavuz, and J. M. A. Tanchoco. 2010. Facilities Planning. 4th ed. Sheridan, WY, U.S.A.: Wiley. Wakulla books LLC.
- Vanheusden, S., T. van Gils, K. Ramaekers, T. Cornelissens, and A. Caris. 2023. “Practical Factors in Order Picking Planning: State-of-the-Art Classification and Review.” International Journal of Production Research 61: 1–25. doi:10.1080/00207543.2022.2053223.
- Vaske, J. J., J. Beaman, and C. C. Sponarski. 2017. “Rethinking Internal Consistency in Cronbach's Alpha.” Leisure Sciences 39 (2): 163–173. doi:10.1080/01490400.2015.1127189.
- Venkatesh, V., and F. Davis. 1996. “A Model of the Antecedents of Perceived Ease of Use: Development and Test.” Decision Sciences 27 (3): 451–481. doi:10.1111/j.1540-5915.1996.tb01822.x.
- Vijayakumar, V., F. Sgarbossa, W. P. Neumann, and A. Sobhani. 2022. “Framework for Incorporating Human Factors Into Production and Logistics Systems.” International Journal of Production Research 60 (2): 402–419. doi:10.1080/00207543.2021.1983225.
- Village, J., C. Searcy, F. Salustri, and W. P. Patrick Neumann. 2015. “Design for Human Factors (DfHF): A Grounded Theory for Integrating Human Factors into Production Design Processes.” Ergonomics 58 (9): 1529–1546. doi:10.1080/00140139.2015.1022232.
- Weisner, K., and J. Deuse. 2014. “Assessment Methodology to Design an Ergonomic and Sustainable Order Picking System Using Motion Capturing Systems.” Procedia CIRP 17: 422–427. doi:10.1016/j.procir.2014.01.046.
- Winkelhaus, S., and E. H. Grosse. 2020. “Logistics 4.0: A Systematic Review towards a New Logistics System.” International Journal of Production Research 58 (1): 18–43. doi:10.1080/00207543.2019.1612964.
- Winkelhaus, S., E. Grosse, and S. Morana. 2021. “Towards a Conceptualisation of Order Picking 4.0.” Computers & Industrial Engineering 159: 107511. doi:10.1016/j.cie.2021.107511.
- Wright, R., S. Paroutis, and D. Blettner. 2013. “How Useful Are the Strategic Tools We Teach in Business Schools?” Journal of Management Studies 50 (1): 92–125. doi:10.1111/j.1467-6486.2012.01082.x.
- Yung, M., A. Kolus, R. Wells, and W. P. Neumann. 2020. “Examining the Fatigue-Quality Relationship in Manufacturing.” Applied Ergonomics 82: 102919. doi:10.1016/j.apergo.2019.102919.
- Zhang, Y. 2016. “Correlated Storage Assignment Strategy to Reduce Travel Distance in Order Picking∗∗Zhang Thanks the Financial Support of the China Scholarship Council (CSC)..” IFAC-PapersOnLine 49 (2): 30–35. doi:10.1016/j.ifacol.2016.03.006.
- Zhao, X., N. Liu, S. Zhao, J. Wu, K. Zhang, and R. Zhang. 2019. “Research on the Work-Rest Scheduling in the Manual Order Picking Systems to Consider Human Factors.” Journal of Systems Science and Systems Engineering 28 (3): 344–355. doi:10.1007/s11518-019-5407-y.