
 ?Mathematical formulae have been encoded as MathML and are displayed in this HTML version using MathJax in order to improve their display. Uncheck the box to turn MathJax off. This feature requires Javascript. Click on a formula to zoom.
ABSTRACT
There is a growing trend in the use of adhesively bonded patches to repair structures that are subjected to fatigue loads in an attempt to reduce the propagation of an existing crack. The fatigue lifetime prediction of the adhesive used in bonded patch repair is a state-of-the-art challenge, especially when in-service conditions must also be considered. Different approaches have been identified in the literature to analyse structural failure; the methods based on fracture mechanics seem more promising for adhesives because the presence of defects is also considered in the analysis. A considerable amount of work has been undertaken to analyse the delamination of layered structures using cohesive zone modelling (CZM). However, research analysing fatigue delamination in bonded thick-walled structures (> 30 mm) is lacking. The present work proposes a methodology to predict the lifetime of an adhesively bonded patch repair applied to a thick-walled structure, specifically looking at the bearing ring structural fatigue (RSF) life extension of a pitch bearing commonly used in wind turbines.
1. Introduction
Pitch bearings connect the rotor hub and rotor blade of a wind turbine, allowing for the rotation of the blade to maximise the power of the wind turbine (). Attached to the blade, the inner ring is subjected to tilting moments because of wind action. Cyclic loads vary in magnitude with wind loads and blade positions, and they are transmitted by the rolling elements through angular contact from the inner to outer ring. Bolted joints are used to connect the outer ring to the hub, and significant hoop stresses are generated, with a critical point being the outer edge of the holes drilled for bolt mounting ().[Citation3] At this point, a crack may initiate because of fatigue loads, causing the failure of the component (); this is known as ring structural failure (RSF).
Figure 1. (a) Main components of the rotor, (b) cracks on bearing outer rings[Citation1] and c) details of RSF[Citation2].
![Figure 1. (a) Main components of the rotor, (b) cracks on bearing outer rings[Citation1] and c) details of RSF[Citation2].](/cms/asset/315a0806-92b9-47a1-ab08-eab9000042d0/gadh_a_2006645_f0001_oc.jpg)
Over the next few decades (2030–2050), many wind farms will achieve their serviceable life limits, presenting the need for either dismantling them, repowering or extending the life of the most aged components. Regarding RSF, a repairing solution was patented consisting of a stiffener installed on the bearing ring cylindrical surface by means of an adhesive.[Citation4] This innovative concept for pitch-bearing lifetime extension was assessed within the framework of the INNTERESTING programme.[Citation5]
INNTERESTING aims to eliminate the need to build large test benches by simplifying the product development process of new wind turbine components, reducing the required costs and time. Experimental S-N curves are commonly used to predict the fatigue failure mode on real components. However, there is a gap in knowledge between characterisation and prediction scales on manufacturing conditions, roughness and loading ratios, among others. Moreover, preforming real-world large component tests is not affordable because of the large number of tests that would need to be performed. Thus, a simple test at an intermediate scale is proposed. This test is closer to the real application in terms of manufacturing and shape but is still within relatively small dimensions that allow them to be run in lab test conditions.
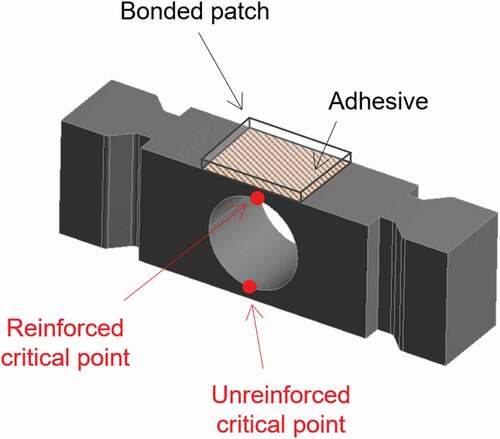
describes the specimen for the intermediate scale test, which is composed of an open-hole geometry and an adhesively bonded patch. The critical points determine the area where cracks may initiate because of RSF failure mode. The bonded patch aims to strengthen this area so that the stresses at these critical points are reduced, thereby increasing the lifetime of the component. The confined adhesive layer transfers stresses from the critical point to a structural patch, which may cause a new failure mode along the adhesive bondline because of its low stiffness and fatigue loading conditions. A finite element (FE) analysis of the complex stress distribution in the adhesive layer may provide input for the lifetime prediction of the bonded structural patch.
Traditionally, the strength-of-materials criteria have been used for structural design and analysis, both of which determine structural failure when the applied stress exceeds the material’s strength for a determined number of cycles.Citation6] A strength prediction method for thick adhesive layers is proposed by Fernández et al.,[Citation7] where a statistical approach is used to analyse the size effect on the fatigue strength of the adhesive. Castro Sousa et al.[Citation8,Citation9] propose a critical distance criterion to define an effective stress that depends on some key parameters governing the fatigue failure of adhesive joints. The fatigue failure criteria considering different stress approaches are analysed by Beber et al.[Citation10] However, the strength criteria assume that neither defects nor flaws are present in the geometries, which are frequent in large structures and reduce the fracture toughness () and fracture resistance against fatigue loads.
The presence of a crack magnifies stresses in the vicinity of the crack and may result in failure before what can be predicted when using traditional strength-of-materials criteria. In fracture mechanics, a stress intensity factor (SIF) is calculated as a function of applied stress, crack size, and part geometry, and a failure occurs when the SIF exceeds the material’s toughness. FE commercial software proposes different solutions to evaluate SIF in complex geometries but modelling a crack into the material is required. The location of the fracture path and the geometry and position of the crack tip have to be assumed, and SIF values are only obtained at the crack tip. Alternatively, prediction models based on the damage mechanics, such as cohesive zone modelling (CZM), are used, especially when the delamination of layered materials is analysed.[Citation11] Although the location of the fracture path is assumed, the damage evolution through the adhesive layer can be analysed by defining a traction-separation law.
Pure mode[Citation12] and mixed mode (I+ II)[Citation13,Citation14] fatigue delamination have been studied in specimens with flexible adherends and thin bondline thicknesses. In these works, the evolution of a 3D crack is modelled using an incremental strategy on cycles, and the number of cycles needed for a determined crack propagation is calculated. The structural bonded patch repair in, however, aims to strengthen a thick-walled structure (> 30 mm), where the fatigue delamination of the adhesive may be conditioned by the magnitude of the surrounding parts. To the best of the authors’ knowledge, only a few studies about quasi-static delamination on large structures have been studied.[Citation15,Citation16] Thus, research analysing adhesive fatigue delamination in thick-walled structures is lacking. The aim of the present contribution is to propose a prediction method based on CZM to analyse fatigue crack propagation in the adhesive layer of bonded structural patch repair. The present work is structured as follows: First, Section 2 describes the methodology developed for the prediction method. The experimental and numerical results are discussed in Section 3. Conclusions are given in Section 4.
2. Methodology
First, an experimental campaign was developed to characterise the elastic and fracture properties of the adhesive. Tensile, lap-shear and static and fatigue fracture tests were carried out on dumbbell, single lap joint (SLJ) and double cantilever beam (DCB) specimens, respectively. Afterwards, these adhesive elastic properties were used as an input for the numerical simulations. First, a sensitivity analysis, which was followed by optimisation work, was carried out to define the optimal value of the main geometrical parameters that govern the effectiveness of the bonded structural patch repair. Second, based on the design/geometry, a fatigue crack propagation analysis was carried out in the adhesive layer using cohesive interface elements. In this way, the effect of an eventual crack propagation on the strengthening was analysed, and the fatigue lifetime of the structural bonded patch repair was predicted.
2.1. Experimental campaign
The epoxy-based structural adhesive Scotch Weld EC-9323-2 B/A by 3 M was used.[Citation17] This two-part adhesive was handled at room temperature and cured at 80°C for 3 h before testing. To determine the Young modulus and yield stress of the adhesive, three dumbbell specimens were manufactured using a Teflon mould having the specific geometry. Later, specimens were cured, and tested following ASTM D638[Citation18]. An extensometer was coupled to determine the Poisson’s ratio. A digital image correlation (DIC) technique was also applied to obtain an accurate value.[Citation19] Three SLJ specimens were manufactured and tested following ASTM D1002[Citation20] to determine the ultimate shear stress of the adhesive. High-strength aluminium alloy type Al 7075-T6 with a yield strength of 550 MPa was used to prevent any plastic deformation during the test. Aluminium substrates were first rough filed and then cleaned with acetone to remove native metal oxide. Prior to bonding, the substrates were cleaned again with isopropyl alcohol to improve adhesion. ()
Figure 2. Pitch-bearing stiffener conceptual design.[Citation4]
![Figure 2. Pitch-bearing stiffener conceptual design.[Citation4]](/cms/asset/da687df7-9825-4c28-8f45-ac739bfdb4fe/gadh_a_2006645_f0002_oc.jpg)
Five DCB specimens were manufactured for the mode I and mode II static and fatigue fracture tests. One specimen was tested for each condition, except for mode II fatigue tests for which two specimens were needed. Here, 3 mm thick and 250 mm long two aluminium adherends were bonded with the selected adhesive. Teflon-calibrated spacers were placed in between the adherends to ensure a constant thickness of 0.5 mm throughout the whole adhesive layer and to delimit an edge in the crack front. A sharp crack was produced by cutting the adhesive with a cutter blade and all manufactured specimens had a crack length of 55 mm and total width (B) of 25 mm. Specimens were painted with white spray, and a ruler was marked on the lateral side of the joint to allow for the visual measurement of the crack’s length during testing.
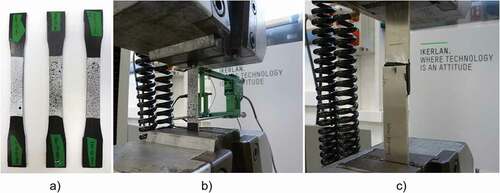
The fracture energy was obtained via experimentation on DCB specimens. Tests were run on a Servosis servohydraulic testing machine using a 2 kN load cell and under 50% relative humidity conditions (). Difficulties in crack length (a) measurement were expected during testing, especially in mode II or the fatigue tests. Thus, the compliance calibration test was carried out prior to testing, which consisted of measuring the opening load (P) and displacement (δ) to evaluate the compliance (C = δ/P) of the bonded joint at different known crack lengths. Then, a relation between C and a was obtained through the following fitting equation:
Figure 3. Open-hole geometry with the bonded structural patch.
For quasi-static tests, a constant displacement rate of 3 mm/min was set. A mode I static fracture test was carried out following the DCB test described in the ISO-25217 standard[Citation21]. The side-clamped beam (SCB) hinge system[Citation22] was used as a substitute for the bonded fixtures, and a crack propagation of 65 mm was allowed. A mode II static fracture test was carried out following the end-notched flexure (ENF) test described in ASTM D7905/D7905M[Citation23] . The distance between rollers was defined as 150 mm. The initial crack length () for mode I and mode II fracture tests was approximately of 20 mm and 53 mm, respectively. The following equation was applied for the evaluation of the energy release rate (G), which is valid for either mode I or mode II fracture tests:
Mode I and mode II fatigue tests were carried out following the procedures described by Stelzer et al.[Citation24] and Brunner et al.,[Citation25] and Renart et al.[Citation26] respectively. A loading frequency of 5 Hz and a load ratio of 0.5 were applied by controlling the opening displacement. The maximum opening displacement was set to a value close to the static crack propagation. During testing, the corresponding crack length for each number of cycles (N) was evaluated using EquationEquation (1)(1)
(1) . The derivative of the a-N curve provided the crack growth rate in terms of the number of cycles (
). The fracture toughness was also evaluated during testing following EquationEquation (2)
(2)
(2) . Thus, a relation between
and G was obtained for any test cycle, giving the Paris curve.[Citation27] The D and m Paris constants were calculated as follows:
where .
The experimental results obtained from the elastic and quasi-static fracture tests are given in . The experimental results obtained from the fatigue tests are given in .
Table 1. Elastic and fracture properties of the adhesive
Table 2. Paris constants from fatigue tests
2.2. Numerical simulations
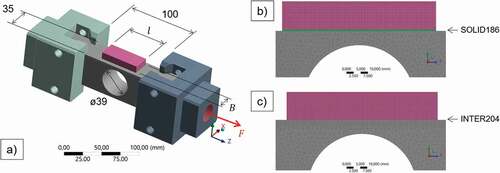
Two 3D numerical models were implemented using the FE method and ANSYS software to reproduce the simplified geometry of a hole drilled for bolt mounting and the loading tool used for intermediate scale testing. The first model that considers the adhesive layer rather than SOLID186 20-node quadrilateral elements was used to define the main geometrical parameters of the structural bonded patch. A second model used to consider the adhesive layer as a row of INTER204 cohesive interface elements was developed to analyse the lifetime of the structural bonded patch repair. ()
Figure 4. (a) Dumbbell specimens, (b) setup of the tensile tests and (c) lap-shear tests.
A sensitivity analysis, which was followed by optimisation work, was developed to define the main geometrical parameters of the structural bonded patch. The elastic properties of a typical structural steel and adhesive SW 9323 were used for the analysis (). A frictional contact with a coefficient of 0.15[Citation28] was assumed between the specimen and loading tool. The geometrical parameters of the bonded patch that dominate the stress state in the critical points () are the width (B), the length (l), the bondline thickness () and the thickness of the patch (
). Regarding the sensitivity analysis, increasing B, l or
decreases the maximum principal stresses (MPS) in the critical point closest to the bonded patch, while the stresses in the critical point with the farthest location are barely reduced. However, increasing
increases MPS in the closest critical point.
From previous work in the INNTERESTING programme, it was determined that a 12% stress reduction must be achieved at the critical point to guarantee a 20-year lifetime bearing.[Citation29] Moreover, the reference load (F) was determined for the simulations using the open-hole geometry, being the value of the maximum load 132.28 kN. To achieve the target, the minimum values for the main geometrical parameters were calculated using the optimisation tool of ANSYS. Some constructional boundaries were previously defined, resulting in a width of 24 mm, a length of 54 mm, a bondline thickness of 0.44 mm and a patch thickness of 10 mm.
For the lifetime analysis of the structural bonded patch, a model using cohesive interface elements was developed. A bilinear cohesive law was considered to characterise the mode I and mode II fracture resistance of the adhesive.[Citation30] The values for the fracture toughness for defining the traction-separation law were taken as the mean values in the crack growth regime in the DCB and ENF tests. The fracture properties of the adhesive are summarised in . The mesh was constructed using the hexahedron meshing algorithms of ANSYS and manual resizing. This resulted in an element size of 0.5 mm in the longitudinal, transversal and out-of-plane directions (), as recommended by Turon et al.[Citation31]
A load ratio of 0.1 was considered for the constant amplitude fatigue loading cycles. The maximum and minimum fatigue loads were defined in two separated load steps. The relative displacement in all nodal connections of the cohesive interface (λ) was evaluated at each load step, and the energy release rate was calculated as follows[Citation13]:
where is the maximum stress and
is the onset displacement jump, which was calculated considering a penalty stiffness of 106 N/mm. The final displacement jump (
) reads as follows[Citation13]:
The variation of the energy release rate () for a fatigue cycle was calculated following the strategy described by Turon et al.,[Citation13] where the energy release rate calculated at the maximum (
) and the minimum (
) loads of the fatigue cycle are subtracted:
.
The adhesive was expected to work in mixed mode (I+ II) conditions, and the total energy release rate was obtained by applying the principle of linear superposition,[Citation32] as follows:
The crack growth rate under mixed mode (I+ II) loading conditions was also obtained by applying the same principle[Citation33]:
The lifetime of the structural bonded patch repair in the event of crack initiation in the adhesive layer was analysed. To do this, the crack growth rate was evaluated in the cohesive interface, and 2 mm crack increments () were created where the maximum crack growth rate was located. The number of cycles needed for the crack increment (
) was calculated as follows:
New crack increments were created using mm/cycle. Lower crack growth rates were considered the threshold values so that the crack growth was arrested.
An ANSYS script was developed to extract the relative displacement in all the nodal connections of the cohesive interface. Later, a MATLAB code was used for the postprocessing. The mode I and mode II Paris constants are given in .
3. Results and discussion
3.1. Experimental results
Stress-strain curves for the tensile and lap-shear tests are shown in, respectively. The stress-strain curves in have the characteristic shape of a tensile test with a nonlinear behaviour because of the elasto-plastic behaviour of the adhesive. The stress-strain curves in follow an almost linear curve, which shows a sudden drop because of the characteristic failure mode of SLJ specimens. Good repeatability was achieved, while cohesive failure occurred in the lap-shear tests.[Citation34]
show the R-curves obtained for the mode I and mode II static fracture tests, respectively. A fully cohesive and stable crack growth was observed in the DCB and ENF tests. In agreement with Manterola et al.[Citation35] and Pérez-Galmés et al.,[Citation36] respectively, a constant and slightly decreasing curve was obtained as the crack grew in mode I fracture tests, while the curve slightly increased as the crack grew in the mode II fracture tests. The energy release rate was calculated following EquationEquation (2)(2)
(2) . The fracture toughness is considered the energy release rate when the R-curves reach a plateau value.
was determined as the average value of the calculated critical G over 65 mm and 10 mm of crack propagation for mode I and mode II, respectively.
show the Paris curves obtained from mode I and mode II fatigue tests, respectively. A cohesive and stable crack propagation was observed in the mode I fatigue tests, which provided a large crack path for the linear region of the Paris curve. However, the crack propagation in the mode II fatigue tests was small. Thus, two tests at different severities provided portions of the linear region of the Paris curve. A linear regression between both short curves provided the mode II Paris curve. The mode I and mode II Paris constants are given in .
3.2. Numerical analysis of the structural bonded patch
Regarding the results obtained from the numerical simulations, respectively, show the mode I and mode II contributions in the total . Although the top and bottom edges of the adhesive layer work under 76% mode II mixed mode (I+ II) loading conditions, the central zone of the adhesive layer is 99% subjected to mode I loading.
()
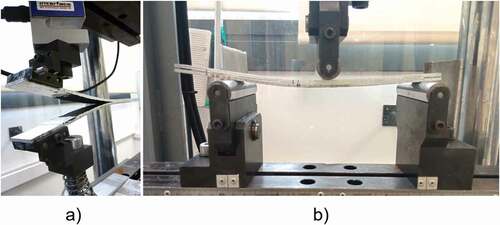
Figure 5. (a) Mode I and (b) mode II test set ups.
The distribution of the total energy release rate along the adhesive layer indicates that the parts of the adhesive layer that are subjected to higher total energy release rate values are the top and bottom edges, hence showing a symmetrical behaviour. values obtained are 0.4285 N/mm and 0.1688 N/mm in the free edges and centre of the bonded area, respectively. However, shows that the crack growth rate is higher in the centre of the adhesive layer than in the top and bottom edges. Thus, the centre of the adhesive layer is more susceptible to initiate a crack.
values were calculated using EquationEquation (7)
(7)
(7) , being 1.07 × 10⁻⁶ mm/cycle and 5.95 × 10⁻⁶ mm/cycle in the free edges and in the centre of the adhesive layer, respectively. Considering that the crack growth rate in the free edges was close to the threshold value (10−6 mm/cycle), an artificial crack was propagated in the centre of the adhesive layer for further analysis.
()
Figure 6. (a) 3D model of the repaired open-hole specimen and the loading tool, (b) adhesive layer with SOLID186 element type and (c) adhesive layer with INTER204 cohesive elements.
shows the distribution of the fatigue crack growth rate at the adhesive layer for the different crack lengths. Six crack increments were simulated, from 1 mm to 11 mm crack lengths. In all cases, the area of the adhesive layer with the highest crack growth rate values is the centre of the adhesive layer. Despite the crack growth rate variations in the centre of the adhesive layer, the crack growth rate in the top and bottom edges does not increase. Thus, the mode I dominated crack propagations are more critical than the mode II dominated ones. The crack growth data calculated for the different crack lengths are given in .
Table 3. Crack growth data calculated in the centre of the adhesive layer at different crack lengths
The crack growth data calculated for different crack lengths () shows that the relation between the crack length and crack growth rate is not linear. This nonlinearity is related to the mode mixity () and total
at each iteration, as shown in the crack growth data in . Moreover, the crack slows down with an increase in the crack length, and it almost arrests when the crack is 11 mm in length, where the 10−6 mm/cycle criterion is almost achieved. The number of cycles needed for crack propagation also increases with the crack length, showing an exponential increment from a 7 mm crack.
Figure 7. CZM for cyclic loading (adapted[Citation13]).
![Figure 7. CZM for cyclic loading (adapted[Citation13]).](/cms/asset/98ef4178-ac09-4b04-b631-b23ff95d0a14/gadh_a_2006645_f0007_oc.jpg)
Figure 8. Stress-strain curves obtained for a) tensile and b) lap-shear tests.
Figure 9. R-curves obtained through a) DCB test and b) ENF test.
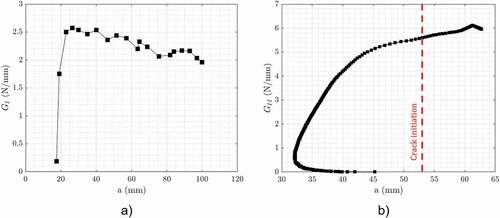
Figure 10. Paris curves for a) mode I and b) mode II fatigue tests.
Figure 11. (a) Mode I and (b) mode II contributions to the variable of energy release rate.
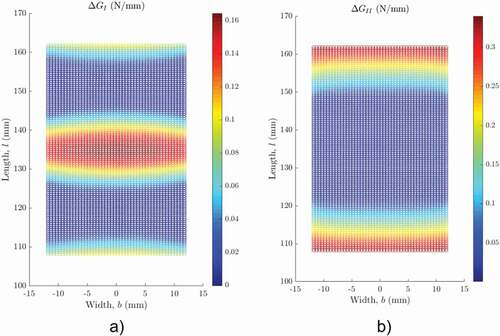
Figure 12. (a) Total energy release rate and (b) fatigue crack growth rate.
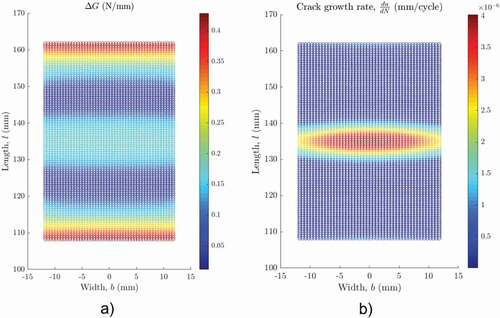
Figure 13. Crack growth rate for (a) 1 mm, (b) 3 mm, (c) 5 mm, (d) 7 mm, (e) 9 mm and (f) 11 mm crack lengths.
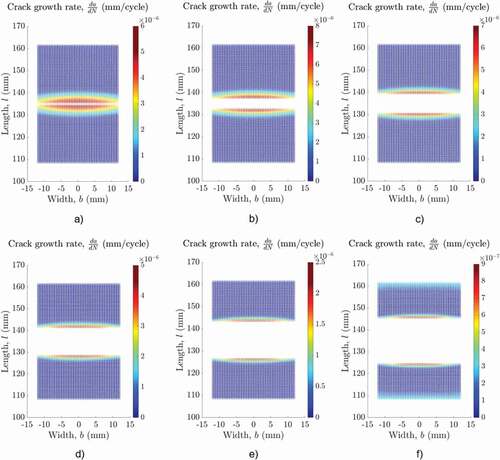
Figure 14. N-a curve and the evolution of the crack growth rate.
shows the stress reduction curves, here depending on the crack length. A stress reduction of 12.95% is obtained with an uncracked adhesive layer. However, the stress reduction decreases to 4.13% when there is an increase in the crack length. Moreover, the effectiveness of the structural bonded patch differs for the two critical points because of its location. Although a stress reduction is obtained at the critical point closest to the structural bonded patch, the effect on the nonreinforced critical point is almost negligible.
Figure 15. Evolution of the stress reduction with an increase in the crack length.
shows the stress reduction curves, here depending on the number of cycles. Stress reduction decreases with an increase in the number of cycles because of crack propagation inside the adhesive layer. An exponential decrease of the stress reduction is observed until cycle number 1652390, where the stress reduction decreases to 4.6%. Starting from this point, the number of cycles needed for stress reduction is high because 5834138 cycles are needed for crack arrest (a = 13 mm). At this point, the stress reduction decreases to 4.13%.
Figure 16. Stress reduction depends on the number of cycles.
4. Conclusion
In the present work, a prediction method is proposed to calculate the lifetime of a thick-walled structural bonded patch subjected to fatigue loads. CZM is applied for simulations and fracture mechanics concepts, here based on experimental work used for a fatigue lifetime calculation. FE simulations showed that the stress reduction in the critical point that is needed to guarantee a 20-year lifetime of the bearing is achieved by using a structural bonded patch. However, structural strengthening is lost in the event of crack initiation in the adhesive layer. Crack propagation is dominated by mode I fatigue loading, and two crack fronts move symmetrically from the centre towards the top and bottom edges of the adhesive layer. In any case, an unstable fracture is avoided because of the slowdown effect in the propagation of the crack. Crack arresting techniques and a structural health monitoring strategy coordinated with regular maintenance may also contribute to extending the effectiveness of the structurally bonded patch over time, despite the initiation of a crack in the adhesive layer. Future work will focus on the experimental validation of the presented prediction method.
Acknowledgements
This project has received funding from European Union’s Horizon 2020 research and innovation programme under grant agreement No 851245.
Disclosure statement
No potential conflict of interest was reported by the author(s).
References
- Romax Technology. https://romaxtech.com/ (accessed October 8, 2021)
- Budny, R. Improving Pitch Bearing Reliability. RBB Eng. 2016.
- Dhanola, A.; Garg, H. C. Tribological Challenges and Advancements in Wind Turbine Bearings: A Review. Eng. Fail. Anal. 2020, 118, 104885. DOI: 10.1016/j.engfailanal.2020.104885.
- Asensio, M.; Lekuona, I.; Olave, M.; Zurutuza, A. Bearing Having a Stiffener of Overstress Compensation. 2019, EP3421829.
- European Commission. Innovative Future-Proof Testing Methods for Reliable Critical Components in Wind Turbines. https://cordis.europa.eu/project/id/851245 (accessed October 8, 2021)
- Da Silva, L. F. M.; Campilho, R. D. S. G. Advances in Numerical Modelling of Adhesive Joints. SpringerBriefs Appl. Sci. Technol. 1–93 2011. DOI: 10.1007/978-3-642-23608-2_1.
- Fernández, G.; Vandepitte, D.; Usabiaga, H.; Van Hooreweder, B.; Debruyne, S. Experimental Identification of Static and Dynamic Strength of Epoxy Based Adhesives in High Thickness Joints. Int. J. Solids Struct. 2017, 120, 292–303. DOI: 10.1016/j.ijsolstr.2017.05.012.
- Castro Sousa, F.; Akhavan-Safar, A.; Rakesh, G.; Da Silva, L. F. M. Fatigue Life Estimation of Adhesive Joints at Different Mode Mixities. J. Adhes. 2020, 1–23. doi:10.1080/00218464.2020.1804376.
- Castro Sousa, F.; Akhavan-Safar, A.; Goyal, R.; Da Silva, L. F. M. Fatigue Life Estimation of Single Lap Adhesive Joints Using a Critical Distance Criterion: An Equivalent Notch Approach. Mech. Mater. 2021, 153, 103670. DOI: 10.1016/j.mechmat.2020.103670.
- Beber, V. C.; Baumert, M.; Klapp, O.; Nagel, C. Fatigue Failure Criteria for Structural Film Adhesive Bonded Joints with Considerations of Multiaxiality, Mean Stress and Temperature. Fatigue Fract. Eng. Mater. Struct. 2021, 44, 636–650. DOI: 10.1111/ffe.13383.
- Camanho, P. P.; Davila, C. G.; Moura, M. F. Numerical Simulation of Mixed Mode Progressive Delamination in Composite Materials. J. Compos. Mater. 2003, 37, 1415–1438. DOI: 10.1177/0021998303034505.
- Pirondi, A.; Moroni, F. A Progressive Damage Model for the Prediction of Fatigue Crack Growth in Bonded Joints. J. Adhes. 2010, 86, 501–521. DOI: 10.1080/00218464.2010.484305.
- Turon, A.; Costa, J.; Camanho, P. P.; Dávila, C. G. Simulation of Delamination in Composites under High-Cycle Fatigue. Compos. Part A-Appl. S. 2007, 38, 2270–2282. DOI: 10.1016/j.compositesa.2006.11.009.
- Moroni, F.; Pirondi, A. A. Procedure for the Simulation of Fatigue Crack Growth in the Adhesively Bonded Joints Based on the Cohesive Zone Model and Different Mixed Mode Propagation Criteria. Eng. Fract. Mech. 2011, 78, 1808–1816. DOI: 10.1016/j.engfracmech.2011.02.004.
- Ji, Y. M.; Han, K. S. Fracture Mechanics Approach for Failure of Adhesive Joints in Wind Turbine Blades. Renew. Energ. 2014, 65, 23–28. DOI: 10.1016/j.renene.2013.07.004.
- Salimi-Majd, D.; Azimzadeh, V. Loading Analysis of Composite Wind Turbine Blade for Fatigue Life Prediction of Adhesively Bonded Root Joint. Appl. Compos. Mater. 2015, 22, 269–287. DOI: 10.1007/s10443-014-9405-4.
- 3M. 3M™ Scotch-Weld™ EC-9323-2 B/A. https://multimedia.3m.com/mws/media/820935O/3m-scotch-weld-9323-b-a.pdf (accessed October 8, 2021)
- ASTM D638–14. Standard Test Method for Tensile Properties of Plastics. ASTM International: West Conshohocken, PA, 2014.
- Manterola, J.; Cabello, M.; Zurbitu, J.; Renart, J.; Turon, A.; Jumel, J.; Urresti, I. Effect of the Width-to-Thickness Ratio on the Mode I Fracture Toughness of Flexible Bonded Joints. Eng. Fract. Mech. 2019, 218, 106584. DOI: 10.1016/j.engfracmech.2019.106584.
- ASTM D1002-10(2019). Standard Test Method for Apparent Shear Strength of Single-Lap-Joint Adhesively Bonded Metal Specimens by Tension Loading (Metal-to-metal). ASTM International: West Conshohocken, PA, 2019.
- ISO-25217. Determination of the Mode I Adhesive Fracture Energy of Structural Adhesive Joints Using Double Cantilever Beam and Tapered Double Cantilever Beam Specimens. Tech. Rep. Int. Org. Stdzn. 2009.
- Renart, J.; Blanco, N.; Pajares, E.; Costa, J.; Lazcano, S.; Santacruz, G. Side Clamped Beam (SCB) Hinge System for Delamination Tests in Beam-Type Composite Specimens. Compos. Sci. Technol. 2011, 71, 1023–1029. DOI: 10.1016/j.compscitech.2010.10.005.
- ASTM D7905/D7905M-19. Standard Test Method for Determination of the Mode II Interlaminar Fracture Toughness of Unidirectional Fiber-Reinforced Polymer Matrix Composites. ASTM International: West Conshohocken, PA, 2019.
- Stelzer, S.; Brunner, A. J.; Argüelles, A.; Murphy, N.; Cano, G. M.; Pinter, G. Mode I Delamination Fatigue Crack Growth in Unidirectional Fiber Reinforced Composites: Results from ESIS TC4 Round-Robins. Eng. Fract. Mech. 2014, 116, 92–107. DOI: 10.1016/j.engfracmech.2013.12.002.
- Brunner, A. J.; Murphy, N.; Pinter, G. Development of a Standardized Procedure for the Characterization of Interlaminar Delamination Propagation in Advanced Composites under Fatigue Mode I Loading Conditions. Eng. Fract. Mech. 2009, 76, 2678–2689. DOI: 10.1016/j.engfracmech.2009.07.014.
- Renart, J.; Vicens, J.; Budhe, S.; Rodríguez-Bellido, A.; Comas, J.; Mayugo, A.; Costa, J. An Automated Methodology for Mode II Delamination Tests under Fatigue Loading Based on the Real Time Monitoring of the Specimen’s Compliance. Int. J. Fatigue. 2016, 82, 634–642. DOI: 10.1016/j.ijfatigue.2015.09.021.
- Paris, P. C.; Gomez, M. P.; Anderson, W. E. A Rational Analytic Theory of Fatigue. Trend Eng. 1961, 13, 9–14.
- Barrett, R. T. Fastener Design Manual. NASA Technical Reports Server. NASA-RP-122 1990, 16.
- Olave, M.; Urresti, I.; Hidalgo, R.; Zabala, H.; Neve, M. D1.1 Technical, Environmental and Social Requirements of the Future Wind Turbines and Lifetime Extension. Innteresting. 2020. https://www.innterestingproject.eu/.
- Manterola, J.; Aguirre, M.; Zurbitu, J.; Renart, J.; Turon, A.; Urresti, I. Using Acoustic Emissions (AE) to Monitor Mode I Crack Growth in Bonded Joints. Eng. Fract. Mech. 2020, 224, 106778. DOI: 10.1016/j.engfracmech.2019.106778.
- Turon, A.; Dávila, C. G.; Camanho, P. P.; Costa, J. An Engineering Solution for Mesh Size Effects in the Simulation of Delamination Using Cohesive Zone Models. Eng. Fract. Mech. 2007, 74, 1665–1682. DOI: 10.1016/j.engfracmech.2006.08.025.
- Kinloch, A. J.; Wang, Y.; Williams, J. G.; Yayla, P. The Mixed-Mode Delamination of Fibre Composite Materials. Compos. Sci. Technol. 1993, 47, 225–237. DOI: 10.1016/0266-3538(93)90031-B.
- Ramkumar, R. L.; Whitcomb, J. D. Characterization of Mode I and Mixed-Mode Delamination Growth in T300/5208 Graphite/Epoxy. In Delamination and Debonding of Materials, 1985; Vol. 876 (ASTM International), pp 315–335.
- Zimmermann, J.; Sadeghi, M. Z.; Schroeder, K. U. The Effect of γ-Radiation on the Mechanical Properties of Structural Adhesive. Int. J. Adhes. Adhes. 2019, 93, 2–7. DOI: 10.1016/j.ijadhadh.2019.01.028.
- Manterola, J.; Renart, J.; Zurbitu, J.; Turon, A.; Urresti, I. Mode I Fracture Characterisation of Rigid and Flexible Bonded Joints Using an Advanced Wedge-Driven Test. Mech. Mater. 2020, 148, 103534. DOI: 10.1016/j.mechmat.2020.103534.
- Pérez-Galmés, M.; Renart, J.; Sarrado, C.; Brunner, A. J.; Rodríguez-Bellido, A. Towards a Consensus on Mode II Adhesive Fracture Testing: Experimental Study. Theor. Appl. Fract. Mech. 2018, 98, 210–219. DOI: 10.1016/j.tafmec.2018.09.014.