
 ?Mathematical formulae have been encoded as MathML and are displayed in this HTML version using MathJax in order to improve their display. Uncheck the box to turn MathJax off. This feature requires Javascript. Click on a formula to zoom.
ABSTRACT
To ensure the desired mechanical properties of adhesively bonded components, maintaining the prescribed mixing quality, i.e. mixing ratio and evenness, of two-component (2K) adhesives is essential. Although different studies proved that mixing errors may exert a negative impact on the bonding result, there are currently no methods available that would allow for continuous monitoring thereof during inline dosing processes. A way out of associated issues is offered by the Electrical Capacitance Tomography (ECT), which enables practitioners to map spatial material distributions and mixing ratios by measuring the capacitances of different media, including adhesives. Therefore, the aim of the study was to investigate the ECT’s potential to be used for 2K mixture quality control. Due to the complexity of the matter, the presentation is split into two papers. In this 1st part, all preliminary experimental and analytical work aiming to determine polymer characteristics, above all permittivity, ε, needed to evaluate whether a respective 2K adhesive may be ECT-monitored is presented. For that, a permittivity measurement device (PMD) was developed, which allows for a fast and efficient determination of adhesive permittivities. Subsequently, the PMD was validated with reference dielectrics and then used to determine the permittivities of the components of 16 commercially available 2K adhesives (epoxies and polyurethanes). Finally, the relationship between permittivity and mixing ratio was investigated for a sub-set of four representative ECT-suitable adhesives. It was found that a wide variety of 2K polymers may principally be controlled by ECT and that the relationship between mixing ratio and mixture permittivity can be described by general analytical theories from the literature. As a result, preliminary experimental effort aiming to assess the adhesive suitability for inline ECT-monitoring could be significantly reduced. The latter experiments will be the topic of the 2nd part of the study.
1. Introduction
1.1. Mixing errors of adhesives
Adhesive bonding represents a so-called ‘special process’ indicating that the mechanical condition of adhesively bonded components cannot completely be characterised by non-destructive methods. To guarantee the quality of a bond, it is thus of significant importance to monitor the complete process chain, starting from the adhesive raw materials to the final bonded product.[Citation1] This includes providing defined surface conditions of the parts to be bonded, ensuring a reproducible adhesive application and, finally, guaranteeing consistently the correct mixing ratio, if two-component (2K) adhesives are applied. All these requirements lie in the responsibility of practitioners and, if not carried out properly, may have a negative impact on a component’s mechanical performance or durability.[Citation2] If focusing on the mixing process, two aspects have to be considered: Firstly, resin and hardener have to be mixed evenly in the correct ratio and, secondly, free of air bubbles. The mixing step thus represents an additional source of errors during production.
The importance of accurate 2K adhesive processing was pointed out by Meschut et al.[Citation3] in 2015. The authors highlighted the influence of different process parameters such as mixing technique and hardware on the quality of 2K adhesives. A visual inspection of applied adhesive beads as well as tensile tests according to DIN EN ISO 527[Citation4] was used as evaluation criteria. It was found that, at the beginning and the end of dosing, deviations from the mixing ratio in the range of 4–7% can occur. However, an influence on resulting tensile strengths could not be proven.
In contrast, Szabelski[Citation5] successfully showed that an increase of the hardener content by 10% already leads to a significant decrease in tensile strength by about 30%, which was observed for a 2K epoxy adhesive. In addition, further studies[Citation6–8] already proved that thermo-mechanical properties of adhesives are significantly influenced by the ratio of resin and hardener, as well as the applied mixing conditions. These findings show that in-depth knowledge about 2K mixtures is of essential importance for the quality of the final bonded product. As a result, there is an urgent need for novel methods that enable efficient and continuous monitoring thereof during inline processes.
1.2. Methods for mixture monitoring of adhesives
In the present study, mixing quality is defined by the following three factors: mixing ratio, evenness of mixing and distribution of air bubbles. With regard to the mixing ratio, measurement of the component volume flow rates represents the current state of the art. A good overview of this technique was provided by Böhm et al.[Citation9,Citation10] in 2009. The authors considered different methods, such as volumetric or Coriolis techniques as well as ultrasonic measurement cells, which were compared regarding measurement accuracy. However, the techniques have in common that only the volume flow of the individual components can be measured, from which the mixing ratio is calculated. In contrast, Bezmenov & Ignatov[Citation11] described a concept to control the dosing of 2K adhesives using pressure sensors by monitoring the pressure loss over time. The applicability of this method depends on multifarious factors, such as dosing parameters, the adhesive’s physical and chemical properties, and is thus not suitable for many polymers.
Although principal functionality could be proven, all aforedescribed methods represent indirect measurement techniques that have only limited significance for the actual mixing ratio discharged. Additionally, the methods do not provide any information about the evenness of mixing or distribution of air bubbles. As a result, suitable sensors that enable continuous inline monitoring of all three factors affecting the mixing quality are currently not available on the market. The present study is thus intended to close this gap by using an ECT-sensor adapted to the requirements of adhesive bonding technology, which will be presented in the 2nd part of the study.
1.3. Electrical capacitance tomography and adhesive bonding
The Electrical Capacitance Tomography (ECT) is a non-destructive tomography technique, which enables mapping of spatial material distributions by measuring capacitances of mixtures, including 2K adhesives.[Citation12] For that, the individual electrical permittivities, ε, of the mixture’s components (resin and hardener) are needed, which quantify their ability to be polarised by an applied electrical field. In addition, the dependency between mixture permittivity, εM, and mixing ratio must be known.
Investigations focusing on the relation between permittivity of uncured adhesive and the mixing ratio are rare. A significant contribution to the field was made by Day[Citation13] in 1988. He investigated the influence of the stoichiometric mixing ratio of an epoxy adhesive on the curing behaviour as well as its electrical properties, including permittivity. Day found a significant influence of the molar mixing ratio on both pre- and post-cure electrical properties, with an almost linear dependency between mixing ratio and mixture permittivity.
Pethrick et al.[Citation14] as well as McConnell & Pethrick[Citation15] combined dielectric and mechanical measurement methods in their studies to describe the influence of ageing effects on mechanical and dielectric adhesive properties. With regard to the permittivity of cured adhesives, they proved that ageing in water leads to a time-dependent increase in measurable permittivity.
Throughout the last decades, various theories have emerged that try to provide a general description of the permittivity of mixtures. However, up to this point it remains unclear whether these theories are valid in context of adhesive bonding technology. A good overview of the field was provided by Persch[Citation16] in 1997, who distinguished between the following model categories:
Empirical models, which are obtained from the fitting of experimentally determined metrics.
Models, which rely on additional mixture characteristics and foot upon the Debye-Model.[Citation17]
Models that foot upon material properties of the individual components.
Many models, especially the empirical ones, have a limited validity, e.g. only for certain substances, boundary conditions, or temperatures.[Citation18] Models that rely on additional mixture characteristics have the disadvantage that these metrics must be accessible and measurable, leading to increased measurement effort in the following. Therefore, models based on measurable material properties of the individual component are of particular interest for the present work.
1.4. Theoretical approaches for permittivity of mixtures
In 1912, Wiener[Citation19] described a model for calculating the dielectric constant, εM, of a mixture that consists of two dielectrics. Wiener’s considerations foot upon a two-phase system with the volume fractions CA and CB being represented between the electrodes of a two-plate capacitor. He assumed that the capacitance of the capacitor is dependent upon the component distribution located between the capacitor plates. His model distinguishes between two essential ways of dielectric arrangements that can be understood as a parallel (1) or serial (2) connection of several single capacitors. These can be expressed by the following two equations:
Here, CA and CB are the volume fractions of the individual components, εA, and εB their permittivities, and εM the permittivity of the mixture. Both equations can be transformed into the general Wiener equation by introducing the shape coefficient u. The shape coefficient takes into account the angle between the layers of the two dielectrics with respect to the electric field. Thus, EquationEquation (1)(1)
(1) and (Equation2
(2)
(2) ) can be rewritten as follows:
With u → ∞ to the parallel (1) and u = 0 corresponding to the serial (2) circuit.
A second approach was provided by Lichtenecker & Rother[Citation20] in 1931. The authors implemented a function, which describes the relation between εM, εA, and εB as well as the volume fraction of the second starting material, CA. In addition, Lichtenecker & Rother introduced the exponent k, which is comparable to Wiener’s shape coefficient:
EquationEquation (4)(4)
(4) is identical to EquationEquation (1)
(1)
(1) for k = +1, whereas for k = – 1, it corresponds to EquationEquation (2)
(2)
(2) .
The approaches of Wiener and Lichtenecker & Rother lead to the same results and are convertible into each other. In the present study, both approaches are used to describe the relation between the 2K adhesive mixing ratio and mixture permittivity.
1.5. Scope
The focus of the study was to investigate the potential of the ECT technology to be used for mixing error detection during inline 2K dosing processes. Due to the complexity of the topic, the study was divided into two consecutive parts. While the present paper focused on preliminary experimental aspects concerning necessary adhesive characteristics needed for ECT-monitoring and their determination, the 2nd part concentrated on illustrating functionality and capabilities of an ECT-sensor adapted to adhesive bonding technology using exemplary dosing processes with ECT-suitable adhesives identified in the present publication.
The scope of the present paper is the following:
Development of a permittivity measurement device (PMD) for fast and efficient determination of permittivities of 2K adhesives.
Experimental validation of the PMD using representative fluids of known permittivity as well as theoretical validation using the theories of Wiener[Citation19] and Lichtenecker & Rother.[Citation20]
Determination of permittivities of the components of representative 2K adhesives using the validated PMD and selection of suitable polymers that meet the requirements of the ECT-sensor (see 2nd part of the study) used for inline monitoring.
Analytical description of the relationship between mixture permittivity and mixing ratio using the theories of Wiener[Citation19] and Lichtenecker & Rother[Citation20] to reduce preliminary PMD measurement effort.
2. Materials & methods
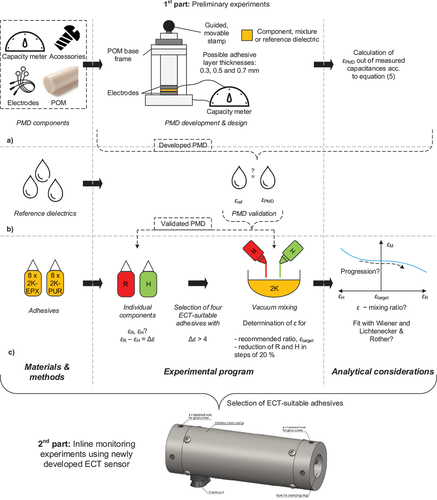
To provide a clear overview, the research roadmap is illustrated in . In a first step, the development approach as well as principal functionality of the PMD is described (cf. ). Afterwards, the PMD was validated (cf. ) and the permittivities of the components of sixteen 2K adhesives were measured using the validated PMD to generate a representative database (cf. ). Subsequently, four ECT-suitable adhesives were selected to illustrate the relationship between mixture permittivity and mixing ratio and the results were compared with the theoretical approaches of Wiener (subsequently labelled as W) as well as Lichtenecker & Rother (L&R). The analytical considerations aimed to reduce preliminary PMD effort with regard to practical implementation of the technique (also cf. ).
Figure 1. Roadmap of the publication.
2.1. Adhesives
The investigations covered sixteen two-component (2K) adhesives (eight epoxies, subsequently labelled as 2K-EPX, and eight polyurethanes, 2K-PUR) from four different adhesive manufacturers (subsequently labelled as A–D). The adhesives along with a nomenclature for their identification are listed in . They cover a wide variety of mixing ratios, ranging from 0.6:1 to 3.45:1. In addition, pot lives varied between 0.13 and 120 min. Furthermore, both unfilled and filled 2K-EPX as well as a boosted 2K-PUR were represented by the experimental campaign.
Table 1. Overview of investigated adhesives and associated mixing/processing conditions, all values taken from manufacturer’s technical data sheet (TDS).
2.2. Permittivity measurement device
2.2.1. Development approach and underlying relations
The focus of the Permittivity Measurement Device (PMD) development was set on two major aspects. On the one hand, measurement time should be reduced to a minimum so to exclude any influence of the polymerisation progress on the permittivity results. On the other hand, underlying measurement principle was chosen in compliance with the actual ECT-sensor (see 2nd part of the study).
In detail, the ECT technology makes use of capacitances measured between several electrodes, which are usually arranged in a ring consisting of two-plate capacitors. Within this ring, the 2K adhesive to be tested represents the dielectric and the capacitance of the capacitors is dependent upon the adhesive permittivity. In turn, the 2K mixture consists of resin and hardener, with both components having individual permittivities. Accordingly, the mixture’s permittivity assumes a value between those of the unmixed components. To be measured by ECT, the component’s relative permittivities must have a sufficient difference, ∆ε, which must be at least 4 according to the manufacturer of the ECT-sensor. For the preliminary experiments, adhesives that meet this requirement are thus considered as suitable for ECT-monitoring.
In order to obtain the permittivity value independent of the capacitor geometry, the following equation is introduced:
In EquationEquation (5)(5)
(5) , εPMD is the PMD-measured permittivity, C* represents the capacitance influenced by the dielectric, ε0 is the permittivity of the vacuum, d and A describe the geometry of the capacitor and Cp is the parasitic capacitance. The latter includes capacitances caused by cables, connections, and the PMD itself. These were determined during calibration and were thus taken into account by each of the presented PMD measurements.
2.2.2. Design and construction
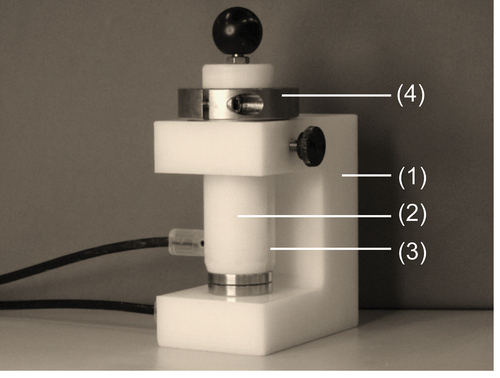
The PMD geometry has been illustrated in . The construction consists of an electrically insulated polyoxymethylene (POM) base frame (1), a movable stamp (2), which is guided within the frame as well as the two stainless steel electrodes (3) of the capacitor. The electrodes (Ø32 mm) are kept apart by precision shims (4), which can be selected so to adjust different adhesive layer thicknesses of 0.5, 0.7, and 1.0 mm.
Figure 2. Developed permittivity measurement device (PMD) with (1) base frame, (2) movable stamp, (3) stainless steel electrodes, and (4) precision shims.
All capacitance measurements were performed with a capacity meter type Alpha KM 1000 (Zadow-Electronics, Germany). The device covers a capacitance range from 1 to 1000 pF and works at a frequency of 1 MHz. The measurement results are available immediately, which is particularly important for short pot lives. Furthermore, measuring range of the PMD (cf. ) is determined by the electrode diameter, their distance, as well as the capacity range of the capacity meter.
Table 2. Measuring range of PMD for determination of permittivity, εPMD, in dependency of adhesive layer thickness/shim height.
2.2.3. Measurement procedure & result evaluation
For a PMD measurement, the following procedure was applied, as shown in : In a first step, the desired shim was inserted within the PMD and all surfaces were freed from superficial impurities that may have affected electrode spacing. After preparation was finished (cf. ), the adhesive components were weighed and mixed using a Speedmixer type 800.2 VAC-P (Hauschild & Co. KG, Germany) for 50 s at 800 rpm under vacuum conditions (0.3 bar absolute pressure, cf. ). To exclude any influence of the mixing process, the unmixed adhesive components were also subjected to vacuum mixing.
Figure 3. Illustration of PMD measurement procedure (herein for a correctly mixed 2K-EPX), all measurements performed at RT.
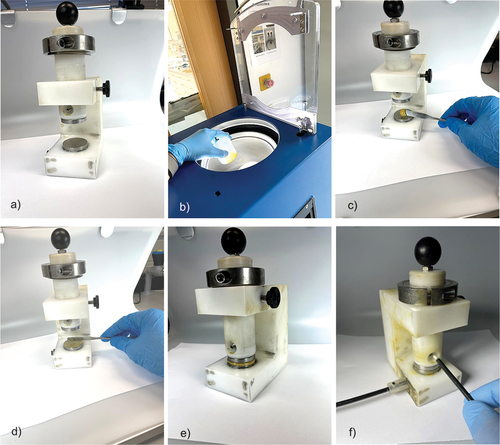
Prior to any application, the stamp was pulled up and fixed in place. Afterwards, the respective mixture or component was applied onto the lower electrode using a spatula (cf. ), evenly distributed (cf. ) and pressed to the desired thickness (cf. ). Immediately afterwards, the capacity meter was started (cf. ) and the capacity could be read off.
For mixtures, the whole application process started when resin and hardener got in contact and ended with the reading of the capacity. This took about 90 s, which was well within pot life of most of the considered adhesives (cf. ). Adhesives with a pot life of <0.2 min were mixed by hand in order to exclude any influence of the curing reaction. In the following, the measured capacitances were used to calculate εPMD according to EquationEquation (5)(5)
(5) . All PMD measurements have been carried out under laboratory conditions at RT (23 ± 2°C, 50 ± 10% RH) and were repeated twice.
2.3. Experimental programme
2.3.1. PMD validation
In a first step, the PMD was validated using dielectrics with known permittivity. The literature values were taken from the Dortmund Database of thermo-physical and thermo-dynamic data of pure substances and mixtures.[Citation21] The dielectrics used for the validation are listed in . To cover a wide range of capacitances, measurements were performed with all available shims, thus adhesive layer thicknesses. Three measurements were performed per shim and dielectric.
Table 3. Dielectrics of known permittivity taken from literature[Citation21] and used for the PMD validation.
2.3.2. Unmixed adhesive components
In the second step, the permittivities of both components, hardener, εH, and resin, εR, of all sixteen adhesives listed in were measured with the PMD. To validate the influence of the adhesive layer thickness, a triple determination was performed for each component with two electrode spacings (0.7 and 1.0 mm). This resulted in six individual measurements per component or 12 measurements per adhesive. The experimental program for the individual adhesive components is summarised in -top.
Table 4. Experimental programme of unmixed and mixed adhesive components.
2.3.3. Mixed adhesive components
The relationship between mixing ratio and mixture permittivity was investigated for four representative adhesives, which were selected based upon the required permittivity difference between resin and hardener to be ECT-monitored (Δε > 4, cf. section 2.2.1). For the investigations, various deviations from the recommended mixing ratio (subsequently referred to as target ratio) were considered. Starting from the target ratio (0% deviation), resin and hardener contents were gradually reduced in steps of 20% until pure hardener (–100%) or pure resin (+100%) was reached. This approach resulted in 11 measurements per adhesive. Afterwards, the capacitances of each mixture were determined according to the procedure described in section 0. The experimental program for the mixtures is listed in -bottom.
2.3.4. ECT-indices and analytical considerations
Up to now, it is not possible to assess an adhesive suitability for ECT-monitoring based upon quantified data. To reach this goal, it was thus investigated whether the theoretical approaches of Wiener (W) as well as Lichtenecker & Rother (L&R) can be used to develop an ECT-index, which expresses how well possible mixing errors of a specific 2K adhesive can be ECT-controlled. For that, the authors introduce the two ECT-indices εECT-R and εECT-H, which describe the expected change of the mixture’s permittivity, εM, when resin (εECT-R) or hardener (εECT-H) are reduced by 10% in relation to the mixing ratio recommended by the adhesive manufacturer (target ratio). The aforementioned deviation threshold was chosen after consultation with the adhesive manufacturers, which revealed that deviations in the range of ±5–10% can be considered as tolerable during production. Consequently, the ECT-sensor must be able to detect the aforementioned deviations close to the target ratio. For the quantification of aforedescribed relationships as well as to obtain a comparable value, a deviation of ±10% from the target ratio is used as a basis for the development of the ECT-indices.
In the following, the ECT-indices for the four representative adhesives were calculated based upon the permittivity-mixing-ratio-functions presented in section 3.3. The latter are determined by the permittivities of hardener, εH, and resin, εR, the shape coefficients u (W) and k (L&R), as well as the volume fractions CH and CR, as provided by the adhesive manufacturers. The shape coefficients can be obtained by fitting the experimental permittivity data of the mixtures with the two models (cf. section 3.3). In detail, the ECT-indices are calculated by simply reading of εPMD at deviations from the target ratio of – 10 and +10% and subtracting the values from εtarget, as exemplarily illustrated for the adhesive EPX_A1 in -left.
The dependency between ECT-indices, mixing ratio, as well as εH and εR is analytically investigated based upon the relationships uncovered during the mixture experiments presented in section 3.3. For that, the following considerations served as a basis: Firstly, a fictive 2K adhesive with a target ratio of 1:1, εH = 5 and εECT-H = 0.13 is assumed, corresponding to an adhesive with high ECT-suitability. These values were chosen based upon experience with the PMD and the ECT-sensor (see 2nd part of the study) and were thus considered to be representative. Afterwards, the theories of W (u = ∞) as well as L&R (k = 1) were applied for the determination of εR, and consequently ∆ε. In addition, the influence of a changing mixing ratio on the ECT-indices, i.e. the fictive polymer’s ECT-suitability, was investigated. The assumed values for the analytical considerations presented in section 0 are listed in .
Table 5. Assumed values and constants for the analytical considerations to be inserted in the equations of W as well as L&R.
3. Results
3.1. PMD validation
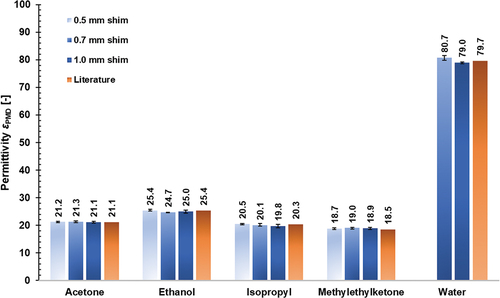
The permittivities of the reference materials as measured with the developed PMD have been illustrated in . The data reveal that determined permittivities for the reference dielectrics agree very well with those from the literature, with average relative deviations between the repetition measurements differing by less than 0.1%. The largest discrepancies to the literature were found when adhesive layer thickness was 0.7 mm, for which permittivities were 2.9% higher (methyl ethyl ketone), and 2.9% lower (ethanol), in comparison to the respective literature value. In addition, it can be seen that shim height, i.e. adhesive layer thickness, has a negligible influence on measured permittivities, with standard deviations between the three investigated shim heights ranging from ~0.08 (acetone) to 0.29 (methyl ethyl ketone and isopropyl).
Figure 4. Determined permittivities of reference dielectrics measured with the developed PMD in comparison to known values from literature, values indicate arithmetic mean out of three repetition measurements, all measurements performed at RT.
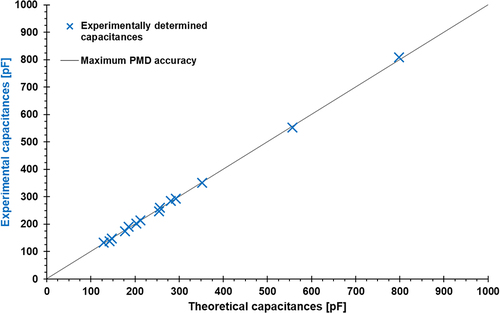
In the next step of the validation, it had to be proven that the PMD measurements are valid over the complete capacitance measurement range. For that, the theoretical capacitances of the reference dielectrics were calculated for the different adhesive layer thicknesses (0.5, 0.7, and 1.0 mm) using EquationEquation (5)(5)
(5) . These are plotted in (x-axis, solid line) against the experimentally measured capacitances of the reference dielectrics (y-axis, blue crosses). It can be seen that a wide capacitance range from 140 to 800 pF is covered by the PMD, whereby the measured capacities show a very high agreement with the theoretically calculated values over the whole measurement range.
Figure 5. Determined capacities of reference dielectrics measured with the developed PMD (see section 2.2.2) in comparison to theoretical values calculated acc. to Equationequation 5(5)
(5) , all measurements performed at RT.
3.2. Permittivities of unmixed adhesive components
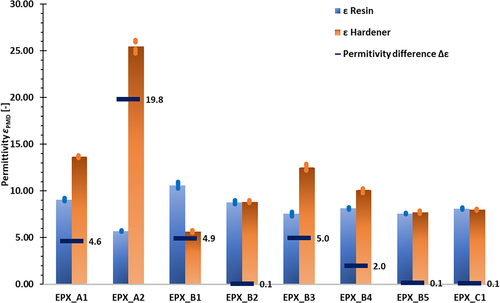
The permittivity measurements for the individual components of the 2K-EPX adhesives are illustrated in . Overall, permittivities in the range of 5–25 could be determined. As already described, only adhesives with components exhibiting a permittivity difference Δε > 4 are of interest in order to be ECT-controlled. This requirement is fulfilled by the following 2K-EPX adhesives: EPX_A1 (Δε = 4.6), EPX_B1 (Δε = 4.9), and EPX_B3 (Δε = 5.0), which show almost similar permittivity differences, as well as the adhesive EPX_A2, which has the highest permittivity difference of all 2K-EPX adhesives investigated (Δε = 19.8). The scatter of all EPX-related measurements can be considered as very low, with deviations from the arithmetic mean amounting to ±2% in most cases.
Figure 6. Results of PMD permittivity measurements for the 2K-EPX adhesives, all measurements performed at RT.
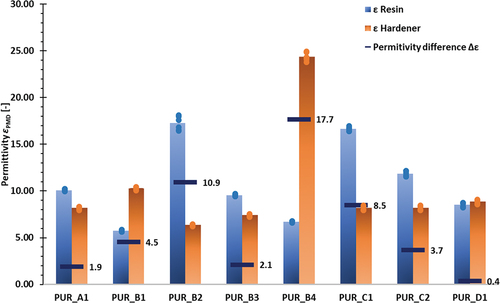
The results for the polyurethane components have been illustrated in . Permittivities range from 6 to 25, with four adhesives reaching the required permittivity difference threshold of Δε > 4. For these adhesives, the following permittivity differences were measured: PUR_B4 (Δε = 17.7), PUR_B2 (Δε = 10.9), PUR_C1 (Δε = 8.5), and PUR_B1 (Δε = 4.5). In compliance with the results for the epoxy components, scattering can be considered as very low (±2.2%). In accordance with the results of the PMD validation presented in section 3.1, adhesive layer thickness of the components exerted a negligible influence on resulting permittivities, with standard deviations amounting to ~1.5% across the different adhesive layer thicknesses.
Figure 7. Results of PMD permittivity measurements for the 2K-PUR adhesives, all measurements performed at RT.
3.3. Permittivities of mixed adhesive components
In the next step, the relationship between permittivity and mixing ratio has been illustrated for a sub-set of the following four adhesives: EPX_A1, EPX_A2, EPX_B1, and PUR_C1 (see ), all of which meeting the permittivity difference threshold of Δε > 4. As illustrated in -left, the permittivity data of EPX_A1 starts at pure hardener, εH = 13.8, and ends with the pure resin, εR, = 9.1. The permittivity of the mixture as recommended by the adhesive manufacturer, εtarget, is 10.2. If the hardener component is decreased, the permittivity develops almost linearly with the provoked mixing error (see -left, positive x-axis). Conversely, when a reduction of the resin content is adhered (negative x-axis), the linear progression initially continues until resin is 40% lower than recommended. In the following, a further reduction leads to a non-linear permittivity increase. When the PMD-measured permittivity data of EPX_A1 is fitted with the theoretical approaches of W and L&R, shape coefficients u = 0 (W) as well k = – 1 (L&R) can be calculated.
Figure 8. Dependency between experimentally determined permittivity, εPMD, of mixed adhesive components and mixing ratio for the adhesives EPX_A1 (left) and EPX_A2 (right) along with resulting fitting curve and associated shape coefficients of W as well as L&R; crosses indicate arithmetic mean of measured values (triple determination), all measurements performed with PMD (see section 2.2) at RT.
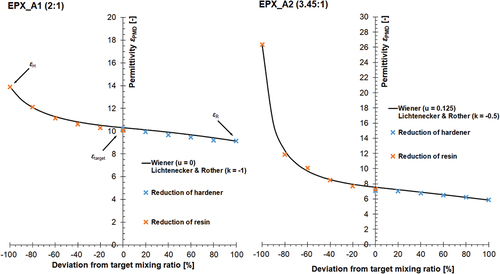
Permittivity of EPX_A2 (see -right) at the target ratio is about 2/3 as high as that of EPX_A1 (εtarget = 7.2). However, the progression of the permittivity function is comparable. Thus, pure resin of EPX_A2 has a permittivity of εR = 5.8, whereas εH = 26.3 was determined for the pure hardener. As already stated, permittivity progresses similarly to EPX_A2, with, however, stronger deviations being measurable when the resin component is reduced (see -right, negative x-axis). The shape coefficients for EPX_A2 are as follows: u = 0.125 (W) and k = – 0.5 (L&R).
Figure 9. Dependency between experimentally determined permittivity, ε, of mixed adhesive components and mixing ratio for the adhesives EPX_B1 (left) and PUR_C1 (right) along with resulting fitting curve and associated shape coefficients of Was well as L&R; crosses indicate arithmetic mean of measured values (triple determination), all measurements performed with PMD (see section 2.2) at RT.
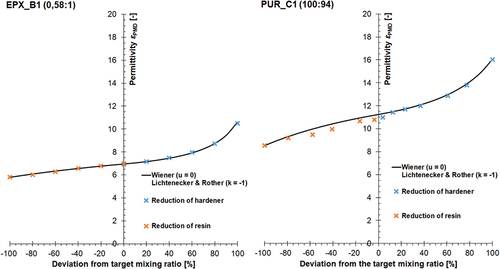
As shown in -left permittivity of the epoxy adhesive EPX_B3 at the target ratio can be measured to εtarget = 7. The permittivity difference between pure resin and pure hardener is 5 (εR = 10.6 and εH = 5.6). With regard to the permittivity progression, the data behaves linearly starting from pure hardener up to the point when hardener deviates by +40% from the target ratio. From there onwards, the influence of the resin on measurable permittivity strongly increases.
Finally, the components of the polyurethane PUR_C1 shown in -right have a permittivity difference of 8.5 (εR = 16.1 and εH = 8.5). The permittivity changes almost proportionally from the pure hardener to a deviation from the target ratio of +60%, after which, analogously to the adhesive EPX_B1, the resin’s influence increases. The permittivity at the target mixing ratio amounts to εtarget = 10.9. The data sets of EPX_B1 and PUR_C1 can both be fitted with shape coefficients of u = 0 (W) and k = – 1 (L&R). All characteristic values that determine the progression of the permittivity-mixing-ratio-function of the four considered adhesives have been summarised in .
Table 6. Characteristic values of the permittivity-mixing-ratio-function of the representative ECT-suitable adhesives investigated, all values determined at RT.
3.4. ECT-indices and analytical considerations
The results of the theoretical considerations described in section 2.3.4 for shape coefficients of u = ∞ (W) and k = +1 (L&R) are shown in . The ECT-index for a reduction of the resin by 10% was kept constant at εECT-H = 0.13, while the mixing ratio and the permittivity difference, Δε, have been varied. The theoretical data show that a permittivity difference of Δε = 5 is required to achieve an ECT index of 0.13 at a mixing ratio of 1:1. In contrast, a 2K adhesive with a mixing ratio of 1:5 already needs a significantly higher permittivity difference of Δε = 8.5 to be measured by ECT. If even stronger deviations in the mixing ratio are considered (1:10), the aforedescribed trend continues as a permittivity difference of Δε = 14.3 is required to keep the ECT-index identical.
Figure 10. Dependency of the ECT-index on the mixing ratio and the permittivity difference.
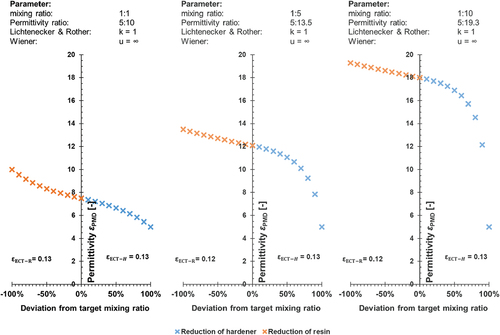
It can also be observed that the theoretical permittivity of the mixture at a balanced target mixing ratio of 1:1 is exactly the average of the permittivities of the two individual components (both ECTindices are identical). The results show that more unbalanced mixing ratios provoke stronger influences of the dominant component. Due to the aforementioned relations, the shape of the permittivity function is thus dependent upon the mixing ratio. This also leads to slight discrepancies between the ECT-indices, as shown in -middle and right.
4. Discussion
4.1. PMD validation
The validation of the developed PMD showed a very good agreement between the measurements and literature values for all considered reference dielectrics, as relative deviations remained below 3% with very low scatter for repeated measurements. The device covers a permittivity range of 3–80, which thus covers the typical range of polymers/adhesives. The newly developed PMD has thus proven to provide accurate permittivity values of different media. The system is very accurate due to calibration with reference capacitors and, in addition, the time needed to perform a permittivity measurement including mixing is very short (<90 s). In the context of adhesive bonding, this offers a clear advantage in comparison to, e.g., impedance spectroscopy, especially when short pot lives are on hand. Summing up, the PMD is thus very reliable and can be used to identify adhesives whose mixing is to be controlled by the ECT sensor in the 2nd part of the study.
4.2. Permittivities of unmixed adhesive components
The results for the individual adhesive components, presented in section 3.2, showed that half of the adhesives (both 2K-EPX and 2K-PUR) exhibit the required difference in permittivity between resin and hardener. Thus, these adhesives are considered as suitable to be ECT-monitored.
As expected, the results of the permittivity measurements do not show clear trends or similarities that would allow for a general description of resulting permittivities on the analytical level. Consequently, preliminary PMD measurements are always needed to assess an adhesive suitability to be ECT-monitored. Furthermore, the results may suggest that the permittivity of adhesives is influenced by many individual conditions such as chemical base, fillers, or chain lengths of the polymers. However, as PMD-measured permittivities have a phenomenological character, these are very well suited to assess ECT-suitability of 2K adhesives.
4.3. Permittivities of mixed adhesive components
The results for the mixed adhesive components, presented in section 3.3, showed that the permittivity of mixtures depends upon the mixing ratio. If centred around the recommended mixing ratio, the relationship is almost linear. The theoretical approaches of W as well as L&R were used to investigate the relationship between mixing ratio and εPMD for a sub-set of four adhesives (cf. section 3.3). It was shown that both theories are suitable to describe and predict the permittivity of mixed adhesive components as a function of the mixing ratio.
The shape of the function depends on the target mixing ratio itself, with the gradient around the target mixing ratio being influenced by the difference of the component’s permittivity, Δε. This implies that Δε cannot be used as the only parameter to assess the adhesive’s suitability for ECT. Rather, the relationship between Δε and the mixing ratio is of significant importance. Up to now, complex series of PMD measurements with different mixing ratios have been necessary in order to describe the relationship between permittivity and mixing ratio for a specific 2K adhesive. However, the results presented in section 3.3 made clear that this effort can be significantly reduced by application of the theories of W as well as L&R as only three permittivities have to be known to obtain the permittivity-mixing-ratio-function: εtarget (recommended mixing ratio), εH (pure hardener), as well as εR (pure resin). Subsequently, all permittivity values between these characteristic points can be obtained by simply fitting the measured data with the general equations proposed by W or L&R.
4.4. ECT-indices and analytical considerations
For the quantification of the adhesive’s ECT-suitability, the authors introduced the ECT-indices εECT-R and εECT-H. The indices provide a quantifiable value that directly describes whether the ECT can detect deviations in the mixing ratio of an adhesive. In detail, the indices describe the change in permittivity when resin or hardener is reduced by 10% based upon the mixing ratio recommended by the adhesive manufacturer as an indicator for the adhesive’s ECT-suitability. In addition, the theoretical results presented in section 0 proved that the suitability of an adhesive does not only depend – as previously assumed – on the permittivity difference of the individual components, Δε. Rather, the data show that lower mixing ratios ultimately lead to greater Δε values being needed to keep ECT-suitability identical (cf. ). For a constant ECT-index, the following applies: The greater Δε, the more extreme the mixing ratio may be, and, conversely, the more extreme the mixing ratio is, the greater Δε must be. The data allow to estimate the permittivity-mixing-ratio-function based upon the PMD and thus to determine both ECT-indices. Both the significance and benefit of the newly introduced ECT-indices will be analysed more deeply in the 2nd part of the study by comparing ECT-suitable adhesives with different indices in context of inline ECT-monitoring experiments.
5. Conclusion
The potential of the Electrical Capacitance Tomography (ECT) to monitor the mixing quality of 2K adhesives during inline dosing processes was in the focus of the study. For that, sixteen commercially available 2K adhesives (8 × epoxy, 8 × polyurethane) from four different adhesive manufacturers were considered. Due to the complexity of the topic, the study was divided into two parts: In the present paper, all preliminary experimental and analytical work aiming to determine adhesive permittivities necessary for ECT-monitoring was presented. The 2nd part of the study concentrates on actual implementation of the technique using real-time ECT-monitoring experiments with suitable adhesives identified in the present paper.
As permittivity is affected by the polymerisation progress, common permittivity measurement techniques such as impedance spectroscopy are not suitable for adhesives due to comparatively long measurement times. Consequently, a Permittivity Measurement Device (PMD) was developed, which uses the concept of a two-plate capacitor as underlying measurement principle. The PMD was validated using reference dielectrics as well as theoretical approaches from the literature. Subsequently, the permittivities of the individual components of all sixteen adhesives were determined and a representative sub-set of four ECT-suitable polymers was selected. For these, the relationship between mixture permittivity and mixing ratio was analysed and analytically described to reduce preliminary experimental effort with regard to practical implementation. The following important findings were made:
The PMD validation was successful and showed that the device is capable of measuring permittivities with high accuracy in a reasonable amount of time. The PMD results can thus be used to select representative adhesives for the ECT measurements presented in the 2nd part of the study.
Half of the commercially available adhesives investigated meet the requirements of the ECT-sensor, which suggests that a wide variety of commercial 2K adhesives will principally be suitable for ECT-monitoring.
The results proved that not only the permittivity difference of the individual components, Δε, must be known to assess the ECT-suitability of a respective adhesive rather the relation between Δε and the mixing ratio must be taken into account.
For the quantification of ECT-suitability, the ECT-indices index εECT-R and εECT-H have been introduced, which describe the change in mixture permittivity to be expected at deviations from the recommended mixing ratio of ±10%, i.e. the typical range of mixing errors during practical application. The ECT-indices will be used in future studies to determine the suitability of an adhesive for ECT.
Finally, the authors showed that the general analytical models of Wiener as well as Lichtenecker & Rother, which represent general approaches to determine the permittivity of mixtures, are applicable for adhesives and provide satisfactory descriptions of the relationship between mixture permittivity and mixing ratio. This cognition can be used to significantly reduce preliminary measurement effort as only the permittivity of pure hardener, εH, and pure resin, εR, and the permittivity at the recommended mixing ratio, εtarget, have to be determined in advance.
Based on these results, future studies should focus on the following aspects:
Optimisation of the PMD, e.g., by using guard electrodes to further increase measurement accuracy.
Transfer of the technique to other 2K adhesive classes with disclosure of associated boundary conditions to be observed by practitioners.
Acquisition of fundamental knowledge about the relation between ECT-indices and ECT-performance. In this context, yet open questions such as that after minimum ECT-index required for an adhesive to be ECT-monitored may be addressed.
The results of the paper form the basis for the actual ECT-monitoring experiments presented in the 2nd part of the study. These will be carried out with a selection of three qualified adhesives. In addition, measures and techniques to adapt the ECT-technology to the requirements of adhesive bonding technology are presented.
Disclosure statement
No potential conflict of interest was reported by the author(s).
Additional information
Funding
References
- Beuth Verlag GmbH (Berlin). Part 1: Adhesive bonding process chain(2304-1:2016-03). In Adhesive bonding technology - Quality requirements for adhesive bonding processes; DIN e.V., 2016. DOI: 10.31030/2399371.
- Habenicht, G. Vom flüssigen Klebstoff zur festen Klebschicht. In Kleben - erfolgreich und fehlerfrei: Handwerk, Haushalt, Ausbildung, Industrie, 3rd ed.; Habenicht, G., Ed.; Vieweg: Wiesbaden, 2003; pp 13–20.
- Meschut, G.; Hahn, O.; Teutenberg, D.; Ernstberger, L. Influence of the Dosing and Mixing Technology on the Property Profile of two-component Adhesives. Weld World. 2015, 59(1), 91–96. DOI: 10.1007/s40194-014-0182-3.
- Beuth Verlag GmbH (Berlin). Part 1: General principles (527-1:2019-09-18). In Plastics - Determination of tensile properties; 2018. DOI: 10.31030/3059426.
- Szabelski, J. Effect of Incorrect Mix Ratio on Strength of Two Component Adhesive Butt-Joints Tested at Elevated Temperature. MATEC Web Conf. 2018, 244, 1019. DOI: 10.1051/matecconf/201824401019.
- Minty, R. F.; Yang, L.; Thomason, J. L. The Influence of hardener-to-epoxy Ratio on the Interfacial Strength in Glass Fibre Reinforced Epoxy Composites. Compos. Part A Appl. Sci. Manuf 2018, 112, 64–70. DOI: 10.1016/j.compositesa.2018.05.033.
- Michels, J.; Sena Cruz, J.; Christen, R.; Czaderski, C.; Motavalli, M. Mechanical Performance of cold-curing Epoxy Adhesives after Different Mixing and Curing Procedures. Compos. B Eng 2016, 98, 434–443. DOI: 10.1016/j.compositesb.2016.05.054.
- Shin, P.-S.; Wang, Z.-J.; Kwon, D.-J.; Choi, J.-Y.; Sung, I.; Jin, D.-S.; Kang, S.-W.; Kim, J.-C.; DeVries, K. L.; Park, J.-M., et al. 2015. “Optimum Mixing Ratio of Epoxy for Glass Fiber Reinforced Composites with High Thermal Stability.” Compos. B Eng 79:132–137. doi:10.1016/j.compositesb.2015.04.032
- Böhm, S.; Bischof, S.; Dilger, K. Controlled Application Even for Small Quantities. Adhes. Adhes. Sealants. 2009, 6(3), 42–47. DOI: 10.1007/BF03250458.
- Ing Dilger, K.; Rer Nat Fischer, F.; Dipl.-Ing Schönteich, B.; Institut für Füge- und Schweißtechnik, TU Braunschweig. Berührungslose thermische Durchflussmessverfahren zum geregelten Klebstoff-auftrag hochviskoser Klebstoffe; DECHEMA e.V.: Frankfurt am Main, 2008.
- Bezmenov, V. S.; Ignatov, A. V. Devices for Transportation and Dosing of Adhesive Compounds at Assembly Facilities. Polym. Sci. Ser. D. 2015, 8(1), 79–84. DOI: 10.1134/S1995421215010049.
- Process Tomography Ltd. Volumen 1. Fundamentals of ECT; 2009.
- Day, D. R.;. Effects of Stoichiometric Mixing Ratio on Epoxy Cure —A Dielectric Analysis. J. Reinf. Plast. Compos 1988, 7(5), 475–484. DOI: 10.1177/073168448800700505.
- Pethrick, R. A.; Armstrong, G. S.; Banks, W. M.; Crane, R. L.; Hayward, D. Dielectric and Mechanical Studies of the Durability of Adhesively Bonded Aluminium Structures Subjected to Temperature Cycling. Part 1: Examination of Moisture Absorption. Proc. Inst. Mech. Eng. Part L. 2004, 218(3), 169–182. DOI: 10.1177/146442070421800301.
- McConnell, B. K.; Pethrick, R. A. Influence of Thermal Spikes on the Ageing of Adhesively Bonded Structures – A Dielectric Study. J. Adhes 2008, 84(3), 193–211. DOI: 10.1080/00218460801954235.
- Persch, C. “Messung von Dielektrizitätskonstanten im Bereich von 0, 2 bis 6 GHz und deren Bedeutung für die Mikrowellenerwärmung von Lebensmitteln,” Dissertation, Karlsruhe: Universität Fridericiana; (1997).
- Debye, J. W. P.;. Polar Molecules; The Chemical Catalog Company, Inc: New York, 1929.
- Sun, E.; Datta, A.; Lobo, S. Composition-based Prediction of Dielectric Properties of Foods. J. Microw. Power Electromagn. Energy. 1995, 30(4), 205–212. DOI: 10.1080/08327823.1995.11688278.
- Wiener, O. “Die Theorie des Mischkörpers für das Feld der stationären Strömung.” Abhandlung der mathematisch-physikalischen Klasse der königlich sächsischen Gesellschaft der Wissenschaft. 1912, 32, 507–604.
- Lichtenecker, K., and Rother, K . Die Herleitung des logarithmischen Mischungsgesetzes aus allgemeinen Prinzipien der stationären Strömung. Physikalische Zeitschrift. 1931, 32(XXXII), 255–260.
- Dortmund Data Bank. Retrieved February 1, 2022 www.ddbst.com.