
Abstract
Varroa destructor is arguably the most important threat to Apis mellifera honey bees. Despite the recentness of the invasion of Varroa, A. mellifera colonies naturally resistant to the mite are being observed in a growing number of populations across Europe, South Africa and Brazil. Appearing in concert with this resistance is an increase in the ability of workers to detect mite-infested cells, which is closely associated with the recapping of such cells. However, many non-infested cells are also uncapped and then recapped which would appear to be a waste of time and energy. In this study we looked at the spatial patterns of recapping and its association with Varroa infestation to understand in what way the uncapping of non-infested cells occurs. We found that recapping occurred in clusters consisting of infested cells and their surrounding non-infested cells. This helped explain our finding that a significant positive correlation existed between levels of recapped infested and non-infested cells. Furthermore, we found that bees responded to an artificial increase in the mite infestation level by increasing their recapping behavior. We confirmed that the recapped area of non-infested cells was significantly smaller, relative to the holes made in the infested cells. Given these findings we propose that recapping behavior is stimulated either by a diffuse signal emanating from the infested cell or that cursory checks are conducted in the vicinity of an infested cell.
Introduction
The Western honey bee, Apis mellifera, is a highly abundant and important pollinator (Hung et al., Citation2018). However, populations are currently experiencing pressure from multiple stressors both natural and man-made. The increasing global trade of honey bees has led to the spread of devastating pests and pathogens, one of the most prolific being the ectoparasitic mite, Varroa destructor commonly referred to as Varroa (Rosenkranz et al., Citation2010). Varroa feeds on the fat body of the adult and pupal stages of bees (Ramsey et al., Citation2019), depleting them of nutrients and transmitting viruses (Martin, Citation2001). A virus they are commonly associated with is the Iflavirus, Deformed Wing Virus (DWV) (Highfield et al., Citation2009; Martin et al., Citation2012; Wilfert et al., Citation2016). Bees infected with DWV as pupae emerge as smaller adults with severely shortened lifespans and reduced productivity (Mockel et al., Citation2011). If a colony has a high mite burden then DWV viral loads will be high, which will ultimately lead to an unbalanced workforce and colony collapse (Martin, Citation2001).
A key part of colony health is the social immune system which is comprised of innate behaviors directed towards protecting the colony as a whole (Cremer et al., Citation2007). Hygienic behavior is an integral part of this, in which bees detect, uncap and remove dead or diseased brood (Spivak & Gilliam, Citation1998). It is effective against many brood diseases such as the American foulbrood bacteria (Rothenbuhler, Citation1964; Woodrow & Holst, Citation1942) and the fungal disease chalkbrood (Gilliam et al., Citation1983; Spivak & Reuter, Citation2001). Hygienic behavior also acts as a defense against Varroa in its original host, Apis cerana (Rath & Drescher, Citation1990). Indeed, it is thought that different subsets of worker bees within a colony can be more sensitive to the presence of Varroa and thus detect and remove mite-infested pupae (Scannapieco et al., Citation2016). However, to A. mellifera, Varroa is a relatively new parasite having only jumped species during the first half of the twentieth century (Oldroyd, Citation1999). Furthermore, the addition of miticides and other chemicals used to control the Varroa population reduces the selective pressure that allows the bees to adapt to this new challenge (Neumann & Blacquiere, Citation2017).
Despite this, naturally Varroa-resistant (NVR) colonies are being observed in an increasing number of regions including Africa, Latin America (Martin et al., Citation2020), mainland Europe (Oddie et al., Citation2018) and the UK (Hawkins, Citation2020). NVR colonies are those which have survived without treatment for more than five years and have similar traits. Typically, each case of resistance appears to have been preceded by an initial period of high colony losses. This suggests that resistance takes time to develop and the ability to resist the mite may initially be found in only a small part of the population. A key factor associated with the majority of incidences of resistance is the reduction of the reproductive success of the mite (Locke et al., Citation2012; Mondet et al., Citation2020). Reduced reproductive success seems likely to be caused by the interruption of the mites’ reproductive cycle when infested brood cells are emptied or recapped (Harbo & Harris, Citation2005; Kirrane et al., Citation2011). However, there has also been some indication that the brood themselves are able to negatively impact Varroa mites’ reproductive ability (Broeckx et al., Citation2019; Conlon et al., Citation2019; Frey et al., Citation2013).
A behavior that has become of particular interest is ‘recapping’ in which workers repeatedly create and reseal holes in the cell capping of worker pupae (Oddie et al., Citation2018). Recapping appears to be an innate behavior of bees frequently seen in association with wax moth larva (Galleriinae) that burrow through the capped cells (Villegas & Villa, Citation2006). However, it is apparent that it can be co-opted for defense against Varroa, since recapping rates are the lowest in Varroa naïve colonies and highest in NVR populations (Hawkins, Citation2020; Martin et al., Citation2020). Precisely why they make these holes, some which are only 1 mm in size, is unknown but it may be to improve the detection of olfactory cues/signals that trigger hygienic behavior. At present, many studies seem to agree that the cues come from the brood and that these cues are likely to consist of cuticular hydrocarbons (CHC) (Mondet et al., Citation2016; Nazzi et al., Citation2004; Salvy et al., Citation2001; Schoning et al., Citation2012; Wagoner et al., Citation2019; Wagoner et al., Citation2020). Indeed, Varroa and DWV have been found to cause changes in the expression of components of the CHC profile, which in turn elicit a hygienic response (Baracchi et al., Citation2012; Wagoner et al., Citation2019). In particular the CHCs, (Z)-6-pentadecene and (Z)-10-tritriacontene are associated with Varroa and DWV stressed brood, respectively (Wagoner et al., Citation2020). The ability to pinpoint the source of such cues may be aided by creating a small hole in the thick wax capping. If no cue or secondary cue is detected after creating the hole, it can easily be resealed (Martin et al., Citation2020). In this context recapping would be highly beneficial for colonies to prevent the loss of erroneously uncapped, healthy brood while maximizing the surveillance of suspicious cells. Importantly, the different potential stages of hygienic behavior (uncapping, removal and recapping) are undertaken by different bees within the colony (Scannapieco et al., Citation2016). The presence of highly sensitive ‘uncappers’ is thought to be offset by ‘recapper’ bees with a lower level of sensitivity. This may also explain the erroneous recapping of infested cells (Martin et al., Citation2020). Recapping correlates with the removal of infested cells and so may be considered a good proxy for removal behavior (Martin et al., Citation2020). To measure removal behavior one would normally be required to artificially infest brood cells and then check for removal at a later date. Checking for recapping is comparatively easier and less time consuming.
It appears that all A. mellifera honeybee colonies have the ability to detect mite-infested cells as both susceptible and NVR colonies locate and recap a greater number of infested cells than non-infested cells (Oddie et al., Citation2018; Martin et al., Citation2020). However, NVR populations that are thought to be more sensitive to mites actually recap a greater proportion of non-infested cells than susceptible populations (Hawkins, Citation2020; Martin et al., Citation2020). This uncapping and recapping of non-infested brood cells would appear to be an unnecessary expenditure of energy, especially since it occurs several times during the development of worker pupae (personal observation, and personal communication Marla Spivak). Therefore, the aims of this study are to investigate in what way the uncapping and recapping of non-infested cells occurs and to determine if there is a spatial pattern associated with recapping behavior. Specifically, we tested the hypotheses that the recapping of non-infested brood cells is triggered by the proximity of infested brood and that the spatial distribution of recapped cells is not random. We predicted that 1) all bees (Varroa naïve, susceptible or NVR) have the ability to detect mite infested cells, 2) recapping would occur in a clustered pattern, 3) the clusters would contain recapped infested cells, 4) infested cells would have larger recap sizes than non-infested cells, 5) the predilection of bees to recap non-infested cells would correlate with their ability to recap infested cells and 6) NVR bees would recap more infested cells than susceptible bees.
Materials and methods
Direct effect of Varroa on recapping of non-infested cells
The initial study conducted in 2019 involved testing the effect of Varroa on recapping rates of nearby cells. We used four Varroa naïve colonies from the Isle of Man, UK and five hygienic colonies with low (<0.5%) levels of mite infestation in brood, due to previous acaricide treatment, from the University of Minnesota research apiary, US. First, we measured the recapping levels in one frame from each colony based on opening 150–300 cells. Recapping was measured following the protocol outlined in previous studies (Boecking & Spivak, Citation1999; Harris et al., Citation2012). The cap of each cell was carefully peeled back using fine forceps to check for signs of recapping, which can be seen when the silk cocoon has been removed and filled in with a matte disc of wax particles (Martin et al., Citation2020). We then inserted 30 (UK) or 50 (US) live Varroa mites into newly capped worker brood. Mites for this artificial infestation were sourced from live A. mellifera drone pupae from Anglesey for the Isle of Man colonies and from a single untreated colony in the Minnesota University apiary for the US colonies. After a period of ten days the infested cells and the cells adjacent to the infested cells were checked for recapping. A Mann-Whitney U-test was conducted to compare the recapping values before Varroa introduction and afterwards.
Spatial distribution of recapped cells
For the spatial analysis, frames containing worker sealed brood that had been capped for between four and ten days were removed from a mixture of NVR and susceptible colonies across England and Wales during August 2019 and stored at −20 °C. Susceptible colonies were those that received acaricide treatment at least once per year. NVR colonies were those that beekeepers stated had been surviving without acaricide treatment for at least five years. Additional data from three frames of NVR colonies from Hawaii that were created from feral, untreated populations were collected in November 2019. The Hawaiian bees were caught in the forest and maintained treatment free for several years (Martin, Citation2020). NVR and susceptible colonies were chosen so that there would be a greater variation in infestation rates which may affect any spatial patterning. The two groups also allowed for the comparison of recapping ability between NVR and susceptible colonies. Each frame was examined under a x16 binocular microscope using a bright cold light source. Individual cell caps were checked for recapping in line with the aforementioned method. If recapped, the diameter of the recapping (matte wax circle) was recorded to the nearest millimeter, then the brood was removed to determine if the cell was infested or not. Infestation was based upon observation of mites, mite frass or mite exuviae in the cell. The data was transferred into an Excel spreadsheet which was designed to spatially represent a honey comb. To achieve this, pairs of cells in each row were merged and each alternate row was offset by one cell.
Data analysis
For each frame, coordinates of the recapped cells were generated in Excel and imported into R version 3.6.2 (R Core Team, Citation2019). A distance matrix was generated from the coordinates, with each data point representing the center of a recapped cell. The distance matrix was then analyzed using the cluster detection algorithm DBSCAN (Density-based spatial clustering of applications with noise) (Ester et al., Citation1996; Hahsler et al., Citation2019) (for code see ). DBSCAN searches spatial data points for clusters of a user defined minimum size (MinPts) within a user defined maximum search radius (eps). The minimum cluster size is the smallest number of points (recapped cells) that DBSCAN will consider a cluster. The search radius is the area in which DBSCAN will look for a recapped cell from the starting cell. Potential values of these parameters were first decided from observation of patterns in brood combs. In this case radii needed to be in multiples of 5 mm to allow the measure from one cell center (data point) to another (cells are approximately 5 mm). For example, with a maximum of 10 mm, the scan will look for recapped cells within a two- cell radius. If recapped cells are in this radius, the search moves to that cell (or cells), and this continues until a recapped cell cannot be found within the radius. All the cells the program has searched are recorded as a cluster if the number is above the minimum cluster size. If it is below this size then no cluster is reported and it moves on to the next search. Cells that do not fit the requirement, i.e., do not have at least two other recapped cells within a 10 mm radius are considered outside of the clusters. The investigated parameters were radius sizes of 5 mm, 10 mm and 15 mm with minimum cluster sizes of 2, 3, 4 and 5 cells. Each permutation (5 mm with 2, 10 mm with 2, etc) was run in DBSCAN, which provides a visual output. The final parameters were decided based on whether the clusters could be considered realistic given the DBSCAN output and the natural spacing of cells. After preliminary runs a search radius of 10 mm (eps = 10) and a minimum cluster size of three cells (MinPts = 3) were chosen, as the two key DBSCAN variables. The resulting clusters were manually transferred onto the Excel spreadsheet.
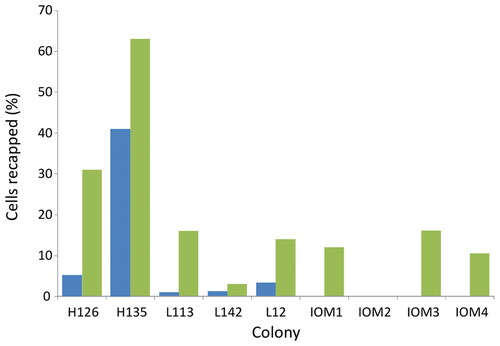
Figure 1. Recapping rates of non-infested cells in the five US effectively Varroa free colonies (before mite introduction colonies had brood infestation levels of 0% except for colonies H126 and L142 which had 0.4% and 0.3%, respectively), along with three Varroa naïve isle of Man colonies The recapping levels before mite introduction (blue) and after mite introduction (green).
To address our second and third predictions, the number of clusters per frame; total number of cells per cluster; number of infested cells per cluster; number of non-infested cells per cluster; and the recapping values of infested and non-infested cells within clusters were tabulated (). Statistical analyses were conducted using Minitab ® version 18 (Minitab Statistical Software, Citation2017). To address our prediction that the clusters would contain recapped infested cells we used Mann-Whitney U-tests to compare the numbers of non-infested and infested clusters per frame, the sizes of non-infested and infested clusters and the proportions of recapped infested and non-infested cells that occur within clusters. We defined an infested cluster as one that contained at least one recapped infested cell. One frame (Colony name Wal, frame number 11) was excluded from any cluster analysis and as it contained too few recapped cells, i.e., no clusters, while another frame (Colony name Rhona, frame 2, side 2) was removed from comparisons of mean recap sizes of cells in infested and non-infested clusters and the number of infested and non-infested clusters per frame. This is because it contained no recapped infested cells. In line with our fourth prediction we used a Mann-Whitney U-test to assess whether there was a significant difference in the size of the recapped areas of infested and non-infested cells.
Table 1. Summary of frame and recapping data alongside the subsequent DBSCAN generated cluster data for each frame. If the second side of the frame has been analysed, the prefix ‘s2’ was used. The images of each frame and their predicted clusters are provided in the supplementary data ().
Relationship between the recapping of infested and non-infested cells
To address our fifth and sixth predictions we pooled our UK and Hawaiian data with recapping data from Oddie et al. (Citation2018), Martin et al. (Citation2020), Hawkins (Citation2020) and from unpublished data provided by Marla Spivak. The data comes from a variety of locations; this range was chosen to provide a good variation in data. The Oddie et al. (Citation2018) data is from NVR and susceptible populations in Avignon and Sarthe, France. Martin et al. (2020) includes data on NVR populations from South Africa (Apis mellifera scutellata and Apis mellifera capensis) and Brazil (Africanized honey bees). Marla Spivak’s unpublished data is from bees of the Minnesota hygiene line. Hawkins (Citation2020) includes NVR and susceptible colonies from the UK.
A Spearman’s Rho test was used to determine whether there was a correlation between the percentage of infested cells recapped and the percentage of non-infested cells recapped and the strength of such correlation. A scatter diagram was created to illustrate the relationship. Spearman’s Rho tests were also used to assess whether this correlation was present in data if separated by colony type (susceptible and NVR). A Mann-Whitney U-test was used to determine whether there was a significant difference in the percentage of infested cells and non-infested cells recapped by NVR colonies and susceptible colonies.
Results
Direct effect of Varroa on recapping of non-infested cells
The addition of mites consistently and significantly (U = 16, p = 0.034) increased the level of recapping of non-infested cells on that frame in both the US and UK colonies (.). In one Isle of Man colony, zero recapping was recorded irrespective of the mites’ presence or not.
Spatial distribution of recapped cells
A total of 8661 cells was mapped across 15 frames: nine from six NVR colonies and six from three susceptible colonies. The DBSCAN algorithm found that recapped cells form clusters associated with infested cells (, ). High levels of recapping, typically due to higher infestation levels, resulted in fewer, larger clusters. The clearer cluster patterns were seen when sealed brood infestation levels were below 10% and when efficient targeting of the infested cells occurred ().
Figure 2. Cell map showing DBSCAN predicted clusters on two frames both with around 5% infestation level but with a A) high (63%) and B) lower (29%) level of recapping.
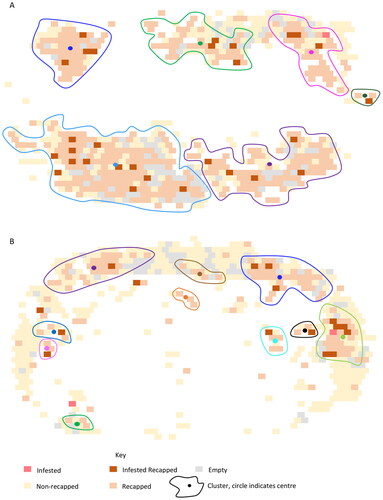
The percentage of infested and non-infested cells located within clusters was 85% and 88%, respectively. This indicates that the majority of recapped cells occur within clusters of three cells or more rather than as single points. Furthermore, clusters containing infested cells were significantly greater in size than those comprised of just non-infested cells (U = 604, p = 0.002). This finding remains significant even when all clusters greater than 50 cells are removed (U = 604, p = 0.048). Additionally, the number of infested clusters per frame was significantly greater than the number of non-infested clusters (U = 52.5, p = 0.038). The size of the recapped area of the infested cells, median 3.07 mm, was significantly greater than those found on non-infested cells, median 2.15 mm, (U = 57.5, p = 0.024). Including all the cells of the frames in significantly greater percentage of the infested cells was recapped than the non-infested cells (U = 50, p = 0.01).
Relationship between the recapping of infested and non-infested cells
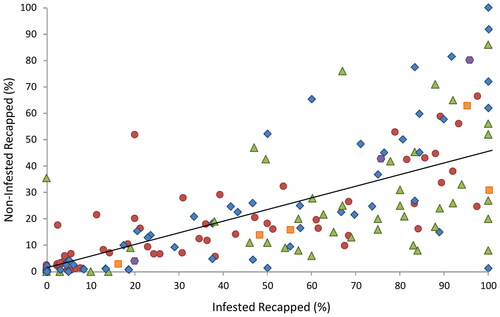
When data from this study was combined with data from all previous studies, we found a significant positive correlation between the percentage of infested cells recapped and the number of non-infested cells recapped (r = 0.754, p < 0.0001) (). This correlation was stronger for susceptible colonies (r = 0.818, p < 0.001) than NVR colonies (r = 0.677, p < 0.001). NVR colonies also recapped a significantly greater percentage of infested cells, 58% versus 32% (U = 1563, p < 0.0001) and non-infested cells, 27% versus 16% (U = 1891, p = 0.0024), than susceptible colonies.
Figure 3. The colony level relationship between the percentages of infested recapped cells against percentages of non-infested recapped cells across several studies, Red circles = Europe (Oddie et al., 2018), green triangles = Brazil/Africa (Martin et al., Citation2020), blue diamonds = UK (Hawkins, Citation2020) and this study orange squares = Minnesota (M. Spivak unpublished data), and purple hexagons = Hawaii (this study).
Discussion
Ultimately this study shows that the uncapping and recapping of non-infested cells is being driven by the presence of mite infested cells. We found, in agreement with our initial predictions, that Varroa naïve, susceptible and NVR bees all have the ability to detect mite infested cells (), that the recapping of non-infested cells occurs in clusters associated with infested cells () and that the recapping of non-infested cells increases alongside the recapping of infested cells (). These findings are important as they suggest first that all colonies have the ability to detect and thus potentially to remove mite infested brood, and secondly that whether a cell is checked for Varroa is influenced by the infestation status of its surrounding cells. We also found that NVR colonies recapped a greater percentage of infested and non-infested cells than susceptible colonies, which could suggest that NVR bees have an enhanced sensitivity to cues and/or a heightened ability to recognize potential areas of infestation based on the location of known infested cells.
Cursory checking of the cells surrounding infested cells may explain why we found recapping to occur in clusters. This could be a reflection of the natural clustered brood infestation pattern that has been observed in Varroa (Fuchs, Citation1988; Kim et al., Citation2018). Bees may instinctively check around an infested cell if Varroa are more likely to infest in a clustered fashion (Kim et al., Citation2018). The clustering of infestation patterns has been disputed by some studies such as (Salvy et al., Citation1999); however, this may be because it varies depending on the severity of infestation (Kim et al., Citation2018). Additionally, the instinctive checking of cells may explain why the recapped areas of non-infested cell are significantly smaller than those of infested cells. Cells that are being checked on instinct may only be opened slightly as, should the instinct be wrong, the hole is easier to repair and requires less wax. On the other hand, it is also plausible that the smaller holes are created because these cells carry a weak chemical stimulus that has drifted from an infested cell. This diffusion of cues from an infested cell to its surrounding non-infested cells could also explain why recapping occurs in clusters. However, it is important to note that the explanations of cue diffusion and cursory checking are not mutually exclusive and so may operate alongside one another. In contrast to cursory checking, cue diffusion would appear to be an unintended consequence of the infestation signaling system. Cues need to be volatile in order to escape the cell and attract a hygienic worker but this volatility may also mean that they drift over neighboring cells causing the cells to appear suspicious. If each cell that was tainted in such a way was emptied then many healthy pupae would be wasted. Therefore, bees may create small holes in the caps of suspicious cells which could enhance the diffusion of cues out of the cell, if it is infested, increasing the accuracy in pinpointing the source.
Interestingly, it may be that the accuracy of this system is reinforced through the use of both low and high volatility cues (Wagoner et al., Citation2019). A highly volatile cue such as (Z)-6-pentadecene would elicit attention through the cap and direct a bee towards the infested cell (Nazzi et al., Citation2004). Once the bee bites into the infested cell a second, low volatility cue such as heptacosene or tritriacontane, which is normally stifled by the cap, may become detectable allowing confirmation of the infestation (Wagoner et al., Citation2019). If a non-infested cell is opened then no secondary cue will be present meaning the cell can be resealed. This secondary cue would not be diffuse and so could increase the accuracy of brood removal and reduce the chances of healthy brood being removed. However, if the cue was only of a low volatility it may be insufficient to direct the attention of bees towards the infestation. This system is not just proposed for Varroa infestation but also for more general hygienic behavior. McAfee et al. (Citation2018) suggest hygienic behavior is triggered by the blend of the volatile food begging cue beta-ocimene and the death pheromone oleic acid. The ability of beta-ocimene to elicit workers’ attention could be co-opted to direct them towards an infested cell which they will then bite into and gain access to the non-volatile cue, oleic acid. The secondary signal oleic acid would trigger the enlargement of the cell and removal of the pupa. In its absence, the small hole can easily be resealed without harm to the pupa. For Varroa infestation this combination is unlikely as infested pupae usually do not die and thus do not emit oleic acid. However, as the ability to remove Varroa infested brood stems from hygienic behavior then the same dual cue process may occur but with different cues (Nazzi et al., Citation2004; Wagoner et al., Citation2019). It seems that the second cue in this process is fairly prone to error as in NVR colonies a high number of infested cells are erroneously recapped. In speculation, this may be due to the lower olfactory sensitivities of ‘recapper’ bees in comparison to ‘uncapper’ bees (Gramacho & Spivak, Citation2003). Although it is also important to note that evaluating recapping provides a snap shot in time and so we can only speculate on the fate of recapped infested cells, it may be that they will be uncapped and removed at a later time. Indeed, cells can be uncapped and recapped many times during the sealed stage.
The ‘uncapper’ bees are those that take part in the initial detection and opening of suspicious cell caps (Gramacho & Spivak, Citation2003). As these bees start the behavior it seems reasonable to assume that the higher recapping rates of NVR colonies may be because their ‘uncapper’ bees have a higher sensitivity to cues or are present in a greater number than in susceptible colonies. Exposure to Varroa may allow individual bees to learn to recognize the cues involved in infestation (Gronenberg et al., Citation2014). This could explain why Varroa naïve colonies and colonies with very low infestation levels had low levels of recapping until after substantial exposure to Varroa. Repeated exposure may increase the numbers of sensitive bees, enhance their sensitivity or lower the bees’ threshold of response to cells that carry cue traces (Masterman et al., Citation2001; Mondet et al., Citation2015). Indeed, the positive correlation between the recapping of infested cells and non-infested cells suggests that individuals in colonies that are more able to detect Varroa are also more likely to investigate non-infested cells. Experience dependent behavior like this has been observed in another eusocial insect species, the clonal ant Platythyrea punctata (Westhus et al., Citation2014). Adult ants that had more frequently encountered fungus-exposed (Metarhizium robertsii) larvae groomed exposed larvae for longer and more effectively (removed more fungal conidiospores). Similarly recapping, a form of social hygiene like grooming is enhanced (in frequency rather than duration) after naïve bees are exposed to Varroa (). While this explanation may be undermined by the presence of non-infested clusters it is important to note that one cannot exclude the possibility that these non-infested clusters at some point contained an infested cell that was removed.
Encouraging the prevalence of resistance traits appears to be a sustainable solution to the Varroa problem. However, the complexity of linking genetic traits to observable phenotypes confounds screening and breeding efforts (Beaurepaire et al., Citation2019; Mondet et al., Citation2020). The recapping trait has been observed in NVR colonies and is an example of the way colonies are adapting to the Varroa threat (Martin et al., 2020; Oddie et al., Citation2018). Recapping may provide a useful marker for resistance (Martin et al., Citation2020). We found that the recapping of non-infested and infested cells was positively correlated, suggesting recapping (of both cell types) is a trait of more hygienic colonies or those with more sensitive ‘uncappers’. Additionally, both potential explanations for recapping non-infested cells, i.e., checking areas around infested cells or a diffuse signal, could suggest the influence of experience on the performance of social hygiene be it through learning patterns (Gould, Citation1986), becoming sensitive to cues (Masterman et al., Citation2001; Mondet et al., Citation2015) or a combination of both. Hygienic behavior has been shown to have a genetic basis (Boecking et al., Citation2000; Harbo & Harris, Citation1999). However, it is thought that the underlying gene set is somewhat limited and behavioral differences may rely on changes in regulation patterns (Boutin et al., Citation2015). Indeed, Mondet et al. (Citation2015) found that olfactory genes were upregulated in the antenna of bees that could detect mites. It may thus be worth exploring whether the environment can influence the behavior - for example, whether bees can become sensitized to (or learn) certain cue odors over time, priming them for recapping and brood removal.
Supplementary Figures
Download Zip (1.6 MB)Acknowledgments
We thank the various beekeepers for providing the frames of sealed brood, G. Hawkins for providing access to the Isle of Man recapping data and M. Spivak for providing the unpublished data.
Disclosure statement
No potential conflict of interest was reported by the authors.
Supplementary material
Supplementary Figures are available via the ‘Supplementary’ tab on the article’s online page (http://dx.doi.org/10.1080/00218839.2021.1890419). The captions for the supplementary figures are:
. Distance matrix and DBSCAN R-code.
. Cell maps for each frame and the DBSCAN predicted clusters.
Additional information
Funding
References
- Baracchi, D., Fadda, A., & Turillazzi, S. (2012). Evidence for antiseptic behaviour towards sick adult bees in honey bee colonies. Journal of Insect Physiology, 58(12), 1589–1596. https://doi.org/https://doi.org/10.1016/j.jinsphys.2012.09.014
- Beaurepaire, A., Sann, C., Arredondo, D., Mondet, F., & Le Conte, Y. (2019). Behavioral genetics of the interactions between Apis mellifera and Varroa destructor. Insects, 10(9), 299. https://doi.org/https://doi.org/10.3390/insects10090299
- Boecking, O., & Spivak, M. (1999). Behavioral defenses of honey bees against Varroa jacobsoni Oud. Apidologie, 30(2–3), 141–158. https://doi.org/https://doi.org/10.1051/apido:19990205
- Boecking, O., Bienefeld, K., & Drescher, W. (2000). Heritability of the Varroa-specific hygienic behaviour in honey bees (Hymenoptera: Apidae). Journal of Animal Breeding and Genetics, 117(6), 417–424. https://doi.org/https://doi.org/10.1046/j.1439-0388.2000.00271.x
- Boutin, S., Alburaki, M., Mercier, P. L., Giovenazzo, P., & Derome, N. (2015). Differential gene expression between hygienic and non-hygienic honeybee (Apis mellifera L.) hives. BMC Genomics, 16, 500. https://doi.org/https://doi.org/10.1186/s12864-015-1714-y
- Broeckx, B. J. G., De Smet, L., Blacquière, T., Maebe, K., Khalenkow, M., Van Poucke, M., Dahle, B., Neumann, P., Bach Nguyen, K., Smagghe, G., Deforce, D., Van Nieuwerburgh, F., Peelman, L., & de Graaf, D. C. (2019). Honey bee predisposition of resistance to ubiquitous mite infestations. Science Report, 9(1), 7794. https://doi.org/https://doi.org/10.1038/s41598-019-44254-8
- Conlon, B. H., Aurori, A., Giurgiu, A. I., Kefuss, J., Dezmirean, D. S., Moritz, R. F. A., & Routtu, J. (2019). A gene for resistance to the Varroa mite (Acari) in honey bee (Apis mellifera) pupae. Molecular Ecology, 28(12), 2958–2966. https://doi.org/https://doi.org/10.1111/mec.15080
- Cremer, S., Armitage, S. A., & Schmid-Hempel, P. (2007). Social immunity. Current Biology: CB, 17(16), R693–R702. https://doi.org/https://doi.org/10.1016/j.cub.2007.06.008
- Ester, M., Kriegel, H., Sander, J., & Xu, X. (1996). A Density-based spatial clustering of applications with noise. Spatial, Text, & Multimedia, 1996, 226–231.
- Frey, E., Odemer, R., Blum, T., & Rosenkranz, P. (2013). Activation and interruption of the reproduction of Varroa destructor is triggered by host signals (Apis mellifera). Journal of Invertebrate Pathology, 113(1), 56–62. https://doi.org/https://doi.org/10.1016/j.jip.2013.01.007
- Fuchs, S. (1988). The distribution of Varroa jacobsoni on honeybee brood combs and within brood cells as a consequence of fluctuation infestation rates. In R. Cavallero (Ed.), European research on varroatosis control: proceedings of a meeting of the EC expert's group (pp. 73–76). EU Publications.
- Gilliam, M., Taber, S., & Richardson, G. V. (1983). Hygienic behaviour of honey bees in relation to chalkbrood disease. Apidologie, 14(1), 29–39. https://doi.org/https://doi.org/10.1051/apido:19830103
- Gould, J. L. (1986). Pattern learning by honey bees. Animal Behaviour, 34(4), 990–997. https://doi.org/https://doi.org/10.1016/S0003-3472(86)80157-9
- Gramacho, K. P., & Spivak, M. (2003). Differences in olfactory sensitivity and behavioral responses among honey bees bred for hygienic behavior. Behavioral Ecology and Sociobiology, 54(5), 472–479. https://doi.org/https://doi.org/10.1007/s00265-003-0643-y
- Gronenberg, W., Raikhelkar, A., Abshire, E., Stevens, J., Epstein, E., Loyola, K., Rauscher, M., & Buchmann, S. (2014). Honeybees (Apis mellifera) learn to discriminate the smell of organic compounds from their respective deuterated isotopomers. Proceedings. Biological Sciences, 281(1778), 20133089. https://doi.org/https://doi.org/10.1098/rspb.2013.3089
- Hahsler, M., Piekenbrock, M., & Doran, D. (2019). dbscan: Fast density-based clustering with R. Journal of Statistical Software, 91(1), 6628. https://doi.org/https://doi.org/10.18637/jss.v091.i01
- Harbo, J. R., & Harris, J. (1999). Heritability in honey bees (Hymenoptera: Apidae) of characteristics associated with resistance to Varroa jacobsoni (Mesostigmata: Varroidae). Journal of Economic Entomology, 92(2), 261–265.
- Harbo, J. R., & Harris, J. W. (2005). Suppressed mite reproduction explained by the behaviour of adult bees. Journal of Apicultural Research, 44(1), 21–23. https://doi.org/https://doi.org/10.1080/00218839.2005.11101141
- Harris, J. W., Danka, R. G., & Villa, J. D. (2012). Changes in infestation, cell cap condition, and reproductive status of Varroa destructor (Mesostigmata: Varroidae) in brood exposed to honey bees with Varroa sensitive hygiene. Annals of the Entomological Society of America, 105(3), 512–518. https://doi.org/https://doi.org/10.1603/AN11188
- Hawkins, G. (2020). Investigating naturally evolved Varroa destructor resistance in Apis mellifera honey bees: host behavioural traits and parasite reproductive biology. The University of Salford.
- Highfield, A. C., El Nagar, A., Mackinder, L. C., Noel, L. M., Hall, M. J., Martin, S. J., & Schroeder, D. C. (2009). Deformed wing virus implicated in overwintering honeybee colony losses. Applied and Environmental Microbiology, 75(22), 7212–7220. https://doi.org/https://doi.org/10.1128/AEM.02227-09
- Hung, K. J., Kingston, J. M., Albrecht, M., Holway, D. A., & Kohn, J. R. (2018). The worldwide importance of honey bees as pollinators in natural habitats. Proceedings. Biological Sciences, 285(1870), 20172140.
- Kim, S. H., Mondet, F., HervÉ, M., & Mercer, A. (2018). Honey bees performing Varroa sensitive hygiene remove the most mite-compromised bees from highly infested patches of brood. Apidologie, 49(3), 335–345. https://doi.org/https://doi.org/10.1007/s13592-017-0559-6
- Kirrane, M. J., De Guzman, L. I., Rinderer, T. E., Frake, A. M., Wagnitz, J., & Whelan, P. M. (2011). Asynchronous development of honey bee host and Varroa destructor (Mesostigmata: Varroidae) influences reproductive potential of mites. Journal of Economic Entomology, 104(4), 1146–1152. https://doi.org/https://doi.org/10.1603/ec11035
- Locke, B., Conte, Y. L., Crauser, D., & Fries, I. (2012). Host adaptations reduce the reproductive success of Varroa destructor in two distinct European honey bee populations. Ecology and Evolution, 2(6), 1144–1150. https://doi.org/https://doi.org/10.1002/ece3.248
- Martin, S. J. (2001). The role of Varroa and viral pathogens in the collapse of honeybee colonies: a modelling approach. Journal of Applied Ecology, 38(5), 1082–1093. https://doi.org/https://doi.org/10.1046/j.1365-2664.2001.00662.x
- Martin, S. J. (2020). Naturally mite-resistant colonies evolve on Hawaii. American Bee Journal, 160, 649–651.
- Martin, S. J., Hawkins, G., Brettell, L. E., Reece, N., Correia-Oliveira, M., & Allsopp, M. (2020). Varroa destructor reproduction and cell re-capping in mite-resistant Apis mellifera populations. Apidologie, 51(3), 369–381. https://doi.org/https://doi.org/10.1007/s13592-019-00721-9
- Martin, S. J., Highfield, A. C., Brettell, L., Villalobos, E. M., Budge, G. E., Powell, M., Nikaido, S., & Schroeder, D. C. (2012). Global honey bee viral landscape altered by a parasitic mite. Science (New York, NY), 336(6086), 1304–1306. https://doi.org/https://doi.org/10.1126/science.1220941
- Masterman, R., Ross, R., Mesce, K., & Spivak, M. (2001). Olfactory and behavioral response thresholds to odors of diseased blood differ between hygienic and non-hygienic honey bees (Apis mellifera L.). Journal of Comparative Physiology. A, Sensory, Neural, and Behavioral Physiology, 187(6), 441–452. https://doi.org/https://doi.org/10.1007/s003590100216
- McAfee, A., Chapman, A., Iovinella, I., Gallagher-Kurtzke, Y., Collins, T. F., Higo, H., Madilao, L. L., Pelosi, P., & Foster, L. J. (2018). A death pheromone, oleic acid, triggers hygienic behavior in honey bees (Apis mellifera L.). Scientific Reports, 8(1), 5719. https://doi.org/https://doi.org/10.1038/s41598-018-24054-2
- Minitab Statistical Software. (2017). [Computer software] (Version 18). Minitab, Inc. www.minitab.com
- Mockel, N., Gisder, S., & Genersch, E. (2011). Horizontal transmission of deformed wing virus: pathological consequences in adult bees (Apis mellifera) depend on the transmission route. Journal of General Virology, 92(Pt 2), 370–377. https://doi.org/https://doi.org/10.1099/vir.0.025940-0
- Mondet, F., Alaux, C., Severac, D., Rohmer, M., Mercer, A. R., & Le Conte, Y. (2015). Antennae hold a key to Varroa-sensitive hygiene behaviour in honey bees. Scientific Reports, 5, 10454. https://doi.org/https://doi.org/10.1038/srep10454
- Mondet, F., Beaurepaire, A., McAfee, A., Locke, B., Alaux, C., Blanchard, S., Danka, B., & Le Conte, Y. (2020). Honey bee survival mechanisms against the parasite Varroa destructor: a systematic review of phenotypic and genomic research efforts. International Journal for Parasitology, 50(6–7), 433–447. https://doi.org/https://doi.org/10.1016/j.ijpara.2020.03.005
- Mondet, F., Kim, S. H., de Miranda, J. R., Beslay, D., Le Conte, Y., & Mercer, A. R. (2016). Specific cues associated with honey bee social defence against Varroa destructor infested brood. Scientific Reports, 6, 25444. https://doi.org/https://doi.org/10.1038/srep25444
- Nazzi, F., Della Vedova, G., & D’Agaro, M. (2004). A semiochemical from brood cells infested by Varroa destructor triggers hygienic behaviour in Apis mellifera. Apidologie, 35(1), 65–70. https://doi.org/https://doi.org/10.1051/apido:2003065
- Neumann, P., & Blacquiere, T. (2017). The Darwin cure for apiculture? Natural selection and managed honeybee health. Evolutionary Applications, 10(3), 226–230. https://doi.org/https://doi.org/10.1111/eva.12448
- Oddie, M., Büchler, R., Dahle, B., Kovacic, M., Le Conte, Y., Locke, B., de Miranda, J. R., Mondet, F., & Neumann, P. (2018). Rapid parallel evolution overcomes global honey bee parasite. Scientific Reports, 8(1), 7704. https://doi.org/https://doi.org/10.1038/s41598-018-26001-7
- Oldroyd, B. P. (1999). Coevolution while you wait: Varroa jacobsoni. Trends in Ecology & Evolution, 14(8), 312–315. https://doi.org/https://doi.org/10.1016/S0169-5347(99)01613-4
- R Core Team. (2019). A language and environment for statistical computing. R Foundation for Statistical Computing.
- Ramsey, S. D., Ochoa, R., Bauchan, G., Gulbronson, C., Mowery, J. D., Cohen, A., Lim, D., Joklik, J., Cicero, J. M., Ellis, J. D., Hawthorne, D., & vanEngelsdorp, D. (2019). Varroa destructor feeds primarily on honey bee fat body tissue and not hemolymph. Proceedings of the National Academy of Sciences of the United States of America, 116(5), 1792–1801. https://doi.org/https://doi.org/10.1073/pnas.1818371116
- Rath, W., & Drescher, W. (1990). Response of Apis cerana Fabr. towards brood infested with Varroa jacobsoni Oud. and infestation rate of colonies in Thailand. Apidologie, 21(4), 311–321. https://doi.org/https://doi.org/10.1051/apido:19900406
- Rosenkranz, P., Aumeier, P., & Ziegelmann, B. (2010). Biology and control of Varroa destructor. Journal of Invertebrate Pathology, 103(Suppl 1), S96–S119. https://doi.org/https://doi.org/10.1016/j.jip.2009.07.016
- Rothenbuhler, W. C. (1964). Behaviour genetics of nest cleaning in honey bees. I. Responses of four inbred lines to disease-killed brood. Animal Behaviour, 12(4), 578–583. https://doi.org/https://doi.org/10.1016/0003-3472(64)90082-X
- Salvy, M., Capowiez, Y., & Conte, Y. L. (1999). Does the spatial distribution of the parasitic mite Varroa jacobsoni Oud. (Mesostigmata: Varroidae) in worker brood of honey bee Apis mellifera L. (Hymenoptera: Apidae) rely on an aggregative process? Naturwissenschaften, 86, 540–543. https://doi.org/https://doi.org/10.1007/s001140050671
- Salvy, M., Martin, C., Bagnères, A. G., Provost, E., Roux, M., Le Conte, Y., & Clèment, J. L. (2001). Modifications of the cuticular hydrocarbon profile of Apis mellifera worker bees in the presence of the ectoparasitic mite Varroa jacobsoni in brood cells. Parasitology, 122(Pt 2), 145–159. https://doi.org/https://doi.org/10.1017/s0031182001007181
- Scannapieco, A. C., Lanzavecchia, S. B., Parreño, M. A., Liendo, M. C., Cladera, J. L., Spivak, M., & Palacio, M. A. (2016). Individual precocity, temporal persistence, and task-specialization of hygienic bees from selected colonies of Apis mellifera. Journal of Apicultural Science, 60(1), 63–74. https://doi.org/https://doi.org/10.1515/jas-2016-0006
- Schoning, C., Gisder, S., Geiselhardt, S., Kretschmann, I., Bienefeld, K., Hilker, M., & Genersch, E. (2012). Evidence for damage-dependent hygienic behaviour towards Varroa destructor-parasitised brood in the western honey bee, Apis mellifera. The Journal of Experimental Biology, 215(Pt 2), 264–271. https://doi.org/https://doi.org/10.1242/jeb.062562
- Spivak, M., & Gilliam, M. (1998). Hygienic behaviour of honey bees and its application for control of brood diseases and Varroa. Bee World, 79(4), 169–186. https://doi.org/https://doi.org/10.1080/0005772X.1998.11099408
- Spivak, M., & Reuter, G. (2001). Resistance to American foulbrood disease by honey bee colonies Apis mellifera bred for hygienic behavior. Apidologie, 32(6), 555–565. https://doi.org/https://doi.org/10.1051/apido:2001103
- Villegas, A. J., & Villa, J. D. (2006). Uncapping of pupal cells by European bees in the United States as responses to Varroa destructor and Galleria mellonella. Journal of Apicultural Research, 45(4), 203–206. https://doi.org/https://doi.org/10.1080/00218839.2006.11101348
- Wagoner, K. M., Millar, J. G., Schal, C., & Rueppell, O. (2020). Cuticular pheromones stimulate hygienic behavior in the honey bee (Apis mellifera). Science Report, 10(1), 7132. https://doi.org/https://doi.org/10.1038/s41598-020-64144-8
- Wagoner, K., Spivak, M., Hefetz, A., Reams, T., & Rueppell, O. (2019). Stock-specific chemical brood signals are induced by Varroa and deformed wing virus, and elicit hygienic response in the honey bee. Scientific Reports, 9(1), 8753. https://doi.org/https://doi.org/10.1038/s41598-019-45008-2
- Westhus, C., Ugelvig, L. V., Tourdot, E., Heinze, J., Doums, C., & Cremer, S. (2014). Increased grooming after repeated brood care provides sanitary benefits in a clonal ant. Behavioral Ecology and Sociobiology, 68(10), 1701–1710. https://doi.org/https://doi.org/10.1007/s00265-014-1778-8
- Wilfert, L., Long, G., Leggett, H. C., Schmid-Hempel, P., Butlin, R., Martin, S. J. M., & Boots, M. (2016). Deformed wing virus is a recent global epidemic in honeybees driven by Varroa mites. Science (New York, NY), 351(6273), 594–597. https://doi.org/https://doi.org/10.1126/science.aac9976
- Woodrow, A. W., & Holst, E. C. (1942). The mechanisms of colony resistance to American foulbrood. Journal of Economic Entomology, 35(3), 327–330. https://doi.org/https://doi.org/10.1093/jee/35.3.327