
Abstract
Climate change is a major threat to sustained economic growth and wellbeing in the Global South. To what extent does official development assistance (ODA) strengthen recipient communities’ capacity to cope with climatic extremes? Here, we investigate whether inflow of development aid mitigates adverse health impacts of subsequent drought among children under 5 years of age, drawing on survey data of nearly 140,000 respondents across 16 countries in Sub-Saharan Africa in combination with georeferenced data on World Bank-sponsored ODA projects and historical weather statistics. A coarsened exact matching analysis reveals little benefit of development aid on child nutritional status under normal meteorological conditions. However, among children exposed to drought, prior aid allocation is associated with significantly reduced weight loss. While the merit of ODA in facilitating long-term growth remains debated, this study finds consistent indication that multilateral development aid improves recipient communities’ capacity to cope with future drought.
1. Introduction
The recently concluded United Nations Millennium Development Goals project set as its first ambitious goal to eradicate extreme poverty and hunger, including halving the proportion of people worldwide that suffer from hunger by 2015. With a handful of exceptions, all developing countries managed to accomplish the latter target, denoting a remarkable improvement in global food security (UN, Citation2015). However, in the most recent years, the global rate of undernourished has again been on the rise. The leading cause of growth in hunger is escalating violence in war-torn countries, compounded by climate-related shocks, notably drought (FAO, IFAD, UNICEF, WFP, & WHO, Citation2019). Extreme weather events are projected to become more frequent and more severe as a result of global warming (Fischer & Knutti, Citation2015; Stott, Citation2016), directly threatening agricultural productivity and food security in fragile regions of the world. In the absence of conscious adaptation and sustainable development, many societies risk being increasingly exposed to rampant and recurring episodes of acute hunger and malnutrition (Lesk, Rowhani, & Ramankutty, Citation2016; Nelson et al., Citation2014; Springmann et al., Citation2016).
In this article, we ask: what is the short-term health effect of development aid, and to what extent does aid reduce individual vulnerability to future climatic extremes? Official development assistance (ODA) projects come in many forms and their overall success in promoting economic growth is debated (Doucouliagos & Paldam, Citation2008; Sumner & Glennie, Citation2015). However, to the extent that development aid leads to general improvements in standards of living, it may also increase communities’ pool of skills and resources needed to cope with disaster. In addition, development aid efforts increasingly encompass disaster relief and resilience strategies (Paul, Citation2006). Even if development aid formally may be distinct from emergency relief aid, ODA projects often seek to target populations that are vulnerable to climate-driven food security threats in their efforts to spur economic development.
Focusing on multilateral ODA, we investigate the extent to which the inflow of development assistance to an area (i) has a measurable and direct effect on recipients’ health conditions, and (ii) makes the recipient population less adversely affected by subsequent drought. In terms of health outcomes, we study weight-for-height ratio among children aged 0–5 years. Low weight-for-height ratio (that is, wasting), is a common indicator of acute undernutrition, which often comes as a result of disrupted food access during drought. We adopt an inclusive approach to the research question by first considering the average effect of all aid projects since individual health and wellbeing are determined by many factors beyond local food production. We then assess agricultural development projects specifically, which most directly target communities’ food production and livelihood systems and therefore should have particularly beneficial consequences for recipients’ sensitivity to drought.
In order to maximise inferential power, we draw on data on nearly 140,000 children from 32 household surveys across 16 Sub-Saharan African countries since 2001 from the Demographic and Health Surveys (DHS), in combination with georeferenced data on World Bank development aid projects and high-resolution meteorological statistics. Since aid is not distributed at random, we use coarsened exact matching (CEM) to obtain comparable treatment and control groups and then estimate the isolated average treatment effect of receiving development aid on the extent of child wasting, accounting for variation in respondents’ post-treatment drought exposure. In line with earlier research (for example, Kumar, Molitor, & Vollmer, Citation2016), we find that a recent drought has a significant negative impact on child nutritional status, all else equal, whereas the analysis provides little evidence of a direct health benefit of ODA under normal conditions (Williamson, Citation2008; Wilson, Citation2011). However, among children exposed to drought, we find that earlier proximity to a development aid project site is associated with a significantly reduced level of undernutrition. We then zoom in on the subset of aid projects that directly targets local food production systems. Here, results are weaker, although the overall pattern remains largely consistent with the more general results. We conclude that even if the macro-economic merit of official development assistance may be uneven, multilateral development aid, here represented by World Bank projects, appears to significantly reduce child health risk imposed by future drought in the short to medium term. Although lack of data on bilateral ODA flows and inherent matching challenges put clear limits on the potential for generalisation, any bias due to incomplete data would likely attenuate rather than inflate the estimated treatment effect, meaning that the true influence of World Bank projects on child health is quite possibly considerably stronger than what is reported here.
In the next section, we briefly review the scientific literature on the causes of child malnutrition, followed by an outline of how development assistance may curb negative health impacts of drought-related food security shocks. We then present the materials and methods and document the results from the statistical analysis. We end by discussing some implications of our results for future research and policy.
1.1. Drivers of child malnutrition
Wasting, or below-normal weight-for-height ratio, is the standard anthropometric measure of acute malnutrition for children aged 0–5 years (WHO & UNICEF, Citation2009). Unlike other measures of undernutrition, such as stunting (height-for-age), wasting can emerge quickly and is usually the result of recent acute food deprivation or severe illness (Smith & Haddad, Citation2015). Child malnutrition can result in developmental impairment, such as growth failure, delayed motor and cognitive development, diminished immunocompetence, and increased morbidity and mortality (Martorell, Citation1999), and impacts are usually more damaging for the youngest children (Hoddinott & Kinsey, Citation2001; Lentz & Barrett, Citation2013). One study calculates the annual cost of child wasting at 3.1 million lives or around 45 per cent of all under-5 deaths globally (Black et al., Citation2013). Most chronically malnourished people are found in Asia, although Africa has the highest density and it is also the continent that has experienced the least improvement in food and nutrition security in recent decades.
The estimation of individual weight-for-height (WHZ) score is done in relation to an international reference population of children at the same age and sex, traditionally provided by the US National Centre for Health Statistics and adopted by the World Health Organization (WHO). In the reference population, 2.3 per cent of children are classified as moderately undernourished (two standard deviations (SD) below the median) while 0.13 per cent are severely underweight (three SD below the median). The true global extent of wasting is well above this share since malnutrition is much more widespread in countries in the Global South than in the reference population. Although some variation in pre-school WHZ scores may be due to genetic differences in the growth potential across regions, ‘these variations are relatively minor compared with the large worldwide variation in growth related to health and nutrition’ (de Onis & Habicht, Citation1996, p. 652).
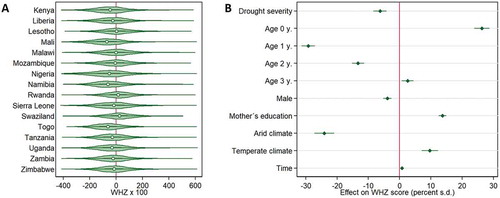
The plots in show the distribution of observed WHZ scores among rural children in selected Sub-Saharan African countries (see Materials and methods sections for details). The plots reveal considerable variation across countries, although most exhibit median WHZ scores well below the WHO reference. Overall, Mali has the largest negative median value but the largest share of severely undernourished children in our data is found in Nigeria (4.3%). Individual-level variation within countries is many times larger than cross-country variation in aggregate scores, however. Note that these values are sampled across different years, 2001–2016, and only consider rural respondents. According to the latest global statistics, around 51 million children were classified as wasted in 2017 (UNICEF, WHO, & The World Bank, Citation2018).
Figure 1. Distribution and determinants of under-5 wasting in 16 Sub-Saharan African countries. (a) Distribution of weight-for-height (WHZ) score among under-5 children of rural DHS respondents. (b) OLS regression coefficients of determinants of under-5 WHZ score with whiskers representing 95 per cent confidence intervals. The horizontal axis is expressed as per cent of a standard-deviation change in WHZ score with a one-unit increase in the independent variable (N = 138,103).
High rates of malnutrition are closely related to armed conflict, and food crises are often especially acute when conflict overlaps with natural hazards. The Food and Agriculture Organization of the UN (FAO) has concluded that the recent deterioration in global food security is due to the compound and interacting effects of escalating conflicts, climate-related shocks, and stagnating economies (FAO et al., Citation2019). However, drought and other forms of extreme weather events can severely threaten food security also in the absence of political turmoil (Ebi & Bowen, Citation2016), especially where food provision and income are dependent on local agriculture, where food and trade markets are inefficient, and where infrastructure is poorly developed. For example, Mulmi, Block, Shively, and Masters (Citation2016) and Shively (Citation2017) find solid evidence that agroclimatic factors and rainfall variability affect children’s height-to-age ratio in Nepal and Uganda, whereas Hoddinot’s (Citation2006) study of rural Zimbabwe shows that children under the age of two are most adversely affected by drought. Health impacts further depend on baseline vulnerability, which is determined by a host of individual-, household-, and context-specific factors, including age and gender, livelihood, poverty and other socioeconomic conditions, and political status of the affected population (Abay & Hirvonen, Citation2017; for example, Cutter, Citation2017; Grace, Davenport, Funk, & Lerner, Citation2012). At the same time, much of our current knowledge about climatic drivers of individual-level wasting is derived from single-country studies, and cross-country comparative assessments reveal significant cross-sectional heterogeneity in child malnutrition severity as well as its correlates (Akombi, Agho, Merom, Renzaho, & Hall, Citation2017).
To verify that climatic shocks influence child health across contexts, we estimate the average effect of drought severity on under-5 WHZ score in a pooled sample of 138,103 DHS-surveyed children, identical to the sample shown in , controlling for basic background factors. As revealed in , there is a statistically significant association between recent drought exposure and child wasting, whereby more severe droughts are linked to lower weight-for-height scores. According to this model, a severe drought, equivalent to 1.5 SD drier than normal meteorological conditions, reduces the predicted WHZ score by around 10 percentage points, all else constant. While this effect is hardly trivial, the magnitude of the effect is modest when compared to some of the controls. Overall, the average risk of wasting is highest among children residing in arid areas whereas temperate climate is associated with a lower prevalence of undernourishment than tropical areas (the reference category). We also see that child wasting risk peaks around the age of 1–2 years whereas the youngest children, most of whom benefit from breastfeeding, are the least likely to be undernourished (Alderman & Headey, Citation2018; Black et al., Citation2013). See Table S4 in Supplementary Materials for complete model output.
1.2. Health benefits of development aid
Few ODA projects have reduction in hunger as the main operational goal. Yet, since food security is closely linked to development, there is reason to anticipate that aid projects that facilitate local economic growth also reduce the rates of undernutrition in a recipient population, even if the macro-level effectiveness of development aid may be questioned (Addison, Morrissey, & Tarp, Citation2017; O’Connell & Smith, Citation2016).
Explanations for why foreign development assistance has a modest track record include arguments that recipients are unable to absorb capital flows, that aid attracts corruption and helps keeping bad governments in power, that it leads to currency depreciation, and that it reduces incentives to improve productivity, thus adversely affecting the local labour market. The temporal aspect of aid effectiveness is also a source of some controversy (Clemens, Radelet, Bhavnani, & Bazzi, Citation2012); how soon should one expect the benefits to materialise? Ultimately, aid effectiveness in terms of fostering long-term economic growth is likely to depend on the quality of governance and institutions in the recipient country and the size and persistence of investments (Asongu & Nwachukwu, Citation2016; Sumner & Glennie, Citation2015).
Macro-economic growth should not be the only yardstick of aid effectiveness, however. Because development projects often target specific sectors, expecting these investments to show up in a country’s GDP within a couple of years might be naïve, and the failure of such investments to directly boost national economic growth does not necessarily mean that the projects were unsuccessful. Indeed, recent research suggests that household-level socioeconomic status matters much more for child health than aggregate income and inequality measures (Harttgen, Klasen, & Vollmer, Citation2013; Reinbold, Citation2011).
Many ODA programmes also have a decidedly local or regional scope, again implying that country-aggregated statistics may be poorly suited to evaluate progress. Analyses that explore within-country variation in aid impacts provide more encouraging results. For example, Dreher and Lohmann (Citation2015) use remote sensing data on night-time light emissions to track local effects of World Bank projects on economic activity in Malawi. Although the study is unable to demonstrate a causal effect, the authors found a significant positive correlation between aid and luminosity growth at the lowest administrative level. Similarly, a recent micro-level study of child health in Nigeria found that being close to an active aid project is associated with reduced infant mortality rates (Kotsadam, Østby, Rustad, Tollefsen, & Urdal, Citation2018).
In summary, acute malnutrition is the main cause of child wasting in poor societies. Low food security, in turn, is determined by adverse socioeconomic and political conditions and market failure, but also by nature- and human-driven disruptions of food provision, such as drought and crop yield loss. To the extent that development aid programmes spur local economic activity and improve access to core public goods, they should also increase average welfare in the recipient population. This gives the following basic expectation:
H1: Development aid projects reduce the local risk of child wasting.
Regardless of the direct effect of ODA on child nutritional status, there are good reasons to expect that the inflow of human and monetary resources has beneficial consequences for communities’ ability to cope with climate-driven food security threats. Looking specifically at food aid across Ethiopia in the mid-1990s, Yamano, Alderman, and Christiaensen (Citation2005) reported that children exposed to severe crop failure experienced an average height growth loss of 0.9 cm over a 6-month period, compared to areas where only half as much of the crop was damaged. The inflow of food aid, on the other hand, was found to increase the growth of same-aged children at an average of 1.8 cm over the same period. Relatedly, Quisumbing (Citation2003) found that food aid in Ethiopia has a positive direct impact on drought-affected children’s weight-to-height rate. Thus, we propose:
H2: Development aid projects mitigate the effect of subsequent drought on local child wasting.
Since adverse nutrition-related outcomes, such as wasting and stunting, are tightly linked with low or highly variable food availability at the local level, aid projects that specifically target the agricultural sector should have near-immediate benefits for food and livelihood security. This link may be especially important in rural Sub-Saharan Africa, where rain-fed agriculture constitutes the dominant sector in terms of employment and income. Consistent with this view, Kaya, Kaya, and Gunter (Citation2013) found that agricultural aid projects recorded in the OECD Creditor Reporting System reduced poverty both directly and indirectly through a positive effect on economic growth. Other studies offer more sobering conclusions. For example, Petrikova (Citation2015) reports that agricultural aid is more context sensitive than multilateral and economic aid projects and only likely to improve food security in countries with well-functioning governance systems. A meta-analysis of 23 studies of local agricultural interventions failed to uncover a positive effect on child nutritional status ‘with any level of confidence’, although many of the assessed interventions were at a more local scale than conventional aid projects (Masset, Haddad, Cornelius, & Isaza-Castro, Citation2012, p. 1).
Development projects targeting the agricultural sector often have more than one specific aim. Yet, many agricultural aid projects explicitly address drought risk and seek to build resilience to future drought exposure. Climate adaptation has increasingly become a core component of agricultural development cooperation (De Roeck, Orbie, & Delputte, Citation2018). Our third expectation can be formulated as follows:
H3: Agricultural aid is especially effective in mitigating drought impacts on local child wasting.
Of course, the expectations formulated above implicitly assume that development aid succeeds in reaching the most-needy in the recipient population. It is entirely possible that aid interventions foster macro-economic growth without benefits reaching the rural poor. Just as access to food can sometimes be a political tool, so is the domestic allocation of development aid influenced by political considerations among donor and recipient governments alike. Ethnic and regional favouritism is prevalent in many parts of Africa, and examples of funds being diverted to the home region or supporters of the incumbent abound (Briggs, Citation2014; Hodler & Raschky, Citation2014).
2. Materials and methods
In order to assess the effect of official development assistance on recipient populations’ vulnerability to climatic extremes, we construct a comprehensive georeferenced dataset of individual respondents across Sub-Saharan Africa from four main sources of data: (i) survey data on child undernutrition and household characteristics from the Demographic and Health Surveys (DHS); (ii) location of World Bank-sponsored development aid projects from AidData; (iii) local drought severity from SPEIbase; and (iv) various location-specific controls. The unit of analysis is each child, aged 0–5 years, born by women interviewed in the DHS surveys.
We limit focus to rural respondents since this is where child malnutrition is the most rampant and where development projects have the greatest potential to boost food security, health conditions, and coping capacity. Our dataset contains information on 138,103 rural children from 32 geo-referenced DHS household surveys in 16 Sub-Saharan African countries, surveyed between 2001 and 2016 (rounds 4–7). To our knowledge, this constitutes the most comprehensive study of its kind and the first systematic, cross-country analysis of development aid effects on local coping capacity using micro-level data. Below follows a brief outline of the research design; see the Appendix for further details on the measurements and the Supplementary Materials for descriptive statistics and sensitivity analysis.
2.1. Dependent variable: under-5 WHZ score
The dependent variable captures extent of wasting of each child under the age of 5 at the time of the interview, born by female respondents in the DHS surveys. As an indicator of wasting, we use the standardised weight-to-height (WHZ) index, where lower values imply a greater risk of undernutrition. To ease interpretation of the regression coefficients, observed values are expressed in percentages of a standard deviation from the median.
As revealed in ), there is considerable variation in mean WHZ score across space. Part of this variation is due to corresponding differences in socioeconomic conditions and other determinants of food security, but part of the variation in aggregate scores may also be due to genetic differences between populations in different regions (Long et al., Citation1998). To minimise bias introduced by geographical heterogeneity in baseline body mass potential, the treatment-control analysis only compares respondents within the same country, and we further specify province-level fixed effects and controls for climate zones to account for systematic differences in baseline wasting risk across space.
2.2. Treatment: proximity to development aid project
The observed treatment in this study is an external intervention in the form of local development aid. To this end, we use geocoded data on World Bank-sponsored development aid projects provided by AidData (Citation2017). The main binary treatment variable [aid] identifies respondents who lived within 50 km of an aid project location, established between one and 4 years prior to the date of the survey. As a complementary treatment, we identify subsets of respondents exposed to agricultural aid projects [ag. aid]. For both variables, the control group is drawn from matched respondents in the same country who were not exposed to any aid project during the treatment period. See Supplementary Materials for an alternative specification of the treatment buffer.
In an ideal world, we would account for ODA from all major donors, but the World Bank aid dataset is the only that covers African countries at a sufficient level of spatiotemporal resolution to permit coupling with the DHS data in a treatment-control research design. While this implies that results should be interpreted with some caution, we believe the analysis has considerable merit for at least two reasons. First, the World Bank is one of the largest sponsors of international development assistance, whose projects may provide a representative insight into multilateral aid effectiveness. Second, the fact that we lack information on other aid projects, some of which may have targeted our control group populations, is likely to attenuate the estimated treatment effect of receiving aid. For this reason, our analysis should be considered a hard test, and the true effect of development assistance is probably considerably larger than that quantified here.
2.3. Post-treatment shock: drought
As a post-treatment shock, we consider the respondents’ exposure to drought during the 12 months immediately prior to the date of their survey participation – in other words, after the initiation (and possibly, closure) of the aid treatment. As an indicator of drought, we use the Standardised Precipitation-Evapotranspiration Index (SPEI-12) (Beguería, Vicente-Serrano, Reig, & Latorre, Citation2014), which measures, for every location and every month, the deviation in climatological conditions over the preceding 12-month period from the long-term norm for the given location, expressed in standard deviations. As the index is location-standardised, every location has the same probability of experiencing drought of a given magnitude over time, such that it can be considered an exogenous, random post-treatment shock.
In the main models, the SPEI index is used for specifying weather-specific subsamples, where binary drought is defined as more than one SD drier than normal conditions (SPEI < −1) over the past 12 months (). Normal conditions are conventionally defined as weather within one SD in either direction of the long-term norm, that is, excluding both unusually wet and unusually dry observations. In the interaction models () and the assessment of wasting determinants (), we use the continuous SPEI index [drought severity].
Table 1. Aid and under-5 WHZ score under various climatic conditions
Table 2. Interaction effect of aid and drought severity on under-5 WHZ score
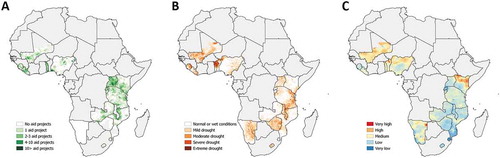
visualises spatial patterns of core variables across the African countries covered in this analysis. While some countries display a relatively even distribution of aid projects across space, others vary greatly in local aid provision (). Similar inter- and intrastate variations can be detected for recent drought exposure () and, notably, for average WHZ scores (). The clustering of high levels of wasting in arid areas (Sahel, the Horn of Africa, Namibia) is an indication that a substantial component of the weight-for-height ratio is informed by structural characteristics that are unlikely to change extensively in response to shifting weather conditions or the arrival of a new development project. While this has important implications for our modelling strategy, our challenge here is not to explain variation in baseline under-5 WHZ scores between population groups but rather to investigate whether ODA treatment can explain some of the observed individual-level variation in children’s nutritional status and their sensitivity to drought, ceteris paribus.
Figure 2. Aid treatment, drought exposure, and under-5 undernutrition. (a) Spatial distribution of development aid project sites, observed 1–4 years prior to the DHS survey. (b) spatial extent of SPEI-12 drought, averaged over the same grid, observed during the last 12 months prior to the DHS survey (‘normal or wet conditions’ refer to SPEI score > −0.5; ‘mild drought’ > −1; ‘moderate drought’ > −1.5; ‘severe drought’ > −2; ‘extreme drought’ ≤ −2). (c) Grid-cell average extent of under-5 wasting, derived from the DHS survey (‘very low’ denotes WHZ × 100 score ≥ 0; ‘low’ > −50; ‘medium’ > −100; ‘high’ > −180; ‘very high’ ≤ −180). Colour scales are smoothed to facilitate visual interpretation. Grey areas are not covered by the study.
2.4. Matching and causal identification
Development aid is not distributed at random, so an assessment of aid outcomes based on a direct comparison between aid recipients and a random control group would result in distorted estimates. To estimate unbiased causal effects, we must ensure that the control group matches the treated as closely as possible on covariates that predict aid inflow, such that the actual treatment is the only (or main) right-hand-side factor that differs between the samples. In order to achieve this, we implement coarsened exact matching (CEM) (Iacus, King, & Porro, Citation2012). CEM is a powerful monotonic, imbalance-reducing matching method that accounts for potentially confounding influence of pre-treatment factors.
Informed by past research on aid allocation, we consider five pre-treatment selection variables that are measured uniquely for each survey cluster: Aid history, political exclusion, local population size, local economic development, and travel time to nearest urban centre. For agricultural aid, we additionally match on arid climate zone. Importantly, we impose exact matching on country codes to ensure that treated DHS respondents are matched with control respondents from the same country only. The matching procedure means that considerable shares of non-treated as well as treated survey clusters are excluded due to systematic differences in pre-treatment characteristics for some observations, such that the valid number of observations in the regression models below is considerably lower than the complete DHS sample. See the Appendix for further details on the sequencing of factors and Supplementary Materials, Section C, for an assessment of the determinants of aid allocation.
When the data have been matched, we use the CEM weights to estimate the sample average treatment effect on the treated via robust ordinary least squares (OLS) regression, controlling for local climate characteristics [arid and temperate climate] as well as basic individual-level characteristics from the DHS surveys: age dummies [Age 0 … 3 years; children aged 4 serving as reference category], gender dummy [Male], and mother’s level of education [Mother’s education] on a scale from 0 (no education) to 3 (higher education). All models also include a common time trend and fixed effects on the first-order subnational administrative level to account for omitted stationary drivers of weight-for-height ratio.
3. Results and discussion
presents the main results of the analysis. Model 1 contains all matched observations, using proximity to any development aid project as the treatment. As evidenced by the small and insignificant regression coefficient, aid does not have a measurable, direct impact on child health – contrary to Hypothesis 1 but consistent with recent research that questions the effect of aid on economic growth and poverty reduction (for example, Page & Shimeles, Citation2015).
The controls behave as expected: extent of wasting is generally the lowest for the youngest children whereas 1- and 2-year olds appear to be most vulnerable to food security threats, compared to the reference category. We find solid evidence that the household’s socioeconomic conditions greatly affect child nutritional status; a shift from no education to higher education implies an estimated improvement in the child’s WHZ score of around one-fifth of a standard deviation, all else equal. The local climate also matters for average WHZ score whereas proximity to conflict events has an inconsistent effect and the gender gap is small. Lastly, we see a general improvement in child nutrition over time.
Next, we estimate the same set of variables on matched subsets of children, determined by their exposure to drought: Model 2 only considers respondents that endured at least moderate drought over the past 12 months whereas Model 3 only contains respondents that enjoyed normal weather conditions. The split-sample approach is a convenient way to assess the effect of ODA on coping capacity since the respondents already are matched on pre-treatment determinants of aid allocation and the SPEI index represents a random shock with equal baseline probability of occurrence across space.
As shown in Model 2, we find statistically significant evidence that past aid has a measurable positive effect on nutritional status among children exposed to drought, even if the magnitude of the effect is modest in comparison with some of the controls. Under normal environmental conditions (Model 3), however, aid treatment does not affect the WHZ score. Taken together, these results suggest that development aid does indeed strengthen recipient populations’ ability to cope with future weather anomalies. However, before we can conclude in favour of Hypothesis 2 we also need to consider the margins of error around the point estimates. , provides a visual comparison of the estimated effects in Models 2 and 3. Since there is no overlap in the error bars, we can conclude with 95 per cent confidence that development assistance improves local resilience to drought. Considering the real risk of control group contamination (that is, some respondents in the control group may have received aid dispersed by other agencies), this is a strong result.
Figure 3. Effect of aid on under-5 wasting for matched respondents. The plots show OLS regression coefficients with whiskers representing 95 per cent confidence intervals, expressed as per cent of a one standard-deviation change in WHZ score from aid intervention, under drought and normal climatic conditions. (a) All aid projects (Model 2 vs. 3); (b) agricultural aid projects (Model 5 vs. 6).
Interestingly, we find that the youngest age group, which normally suffers less from severe undernutrition than their older peers (Model 1), loses the advantage vis-à-vis the 4-year-old reference group in times of meteorological extremes. We interpret this result as a consequence of reduced health among breastfeeding women during drought. Lastly, we find indication that drought contributes to widening the gap in average WHZ scores between arid and temperate climate zones.
The remaining models in follow the same setup, but here the treatment is limited to agricultural aid projects. The results are mostly in agreement with the first set of models. However, comparing the effect of agricultural aid under drought (Model 5) with normal conditions (Model 6), we find a much weaker health benefit of aid, and the error bands around the point estimates are wide and overlapping, implying that these effects are not significantly different from each other ().
Judging from the results in and , it would seem that aid projects targeting the agricultural sector provide no added value in terms of strengthening local coping capacity to future climatic stress over other types of rural development projects. Such a deduction would be hasty and possibly false, however, since recipients of agricultural aid differ from hosts of other aid projects (Table S5 in Supplementary Materials). Among other things, agricultural aid projects tend to be implemented in more arid and less densely populated parts of recipient countries. Accordingly, the matched respondents comprising the sample in Models 4–6 also differ systematically from those included in the first models, obstructing direct comparison of effect sizes.
As a complementary assessment of the empirical merit of Hypothesis 3, we estimate interaction models of the joint effect of aid and drought severity on child wasting, using any aid project and agricultural aid as the treatment, respectively (). Model 7 reveals that drought can have a grave, short-term effect on child health; a severe drought (conventionally defined as 1.5 SD drop below normal SPEI values) is associated with a 0.14-point drop in WHZ score, other factors held constant. Development aid, while lessening the burden of future drought, does not fully insulate recipients from negative health externalities of extreme weather events. Among respondents in target areas for agricultural aid (Model 8), a severe drought leads to dramatic 0.25-point drop in WHZ.
The difference in the isolated impact of drought on child health between Models 7 and 8 indicates that agricultural aid projects more often are allocated to areas where the local population is especially vulnerable to weather extremes (notably more arid ecological conditions). Although this should mean that the potential gain of development intervention is correspondingly higher, the interaction term in Model 8 suggests that agricultural aid projects in combination with drought barely offsets the negative baseline effect of being an ODA recipient. Hypothesis 3 is not supported.
3.1. Sensitivity tests
The analysis presented here has been subjected to a large set of sensitivity tests, which are documented in the online Supplementary Materials. In summary, we have explored the relevance of (a) the monetary size and (b) number of projects, (c) other sector-specific projects, (d) an alternative treatment buffer, (e) limiting the sample to countries with widespread wasting, and (f) including a greater selection of controls. The overall conclusion from these tests is that ODA is robustly negatively associated with child wasting (that is, improving health) among respondents exposed to a recent drought. While concerns related to generalisability and balancing of the treatment-control samples command caution when interpreting the importance of this association, the consistency of the estimated treatment effect across specifications is reassuring.
4. Concluding remarks
To our knowledge, this study represents the first attempt to systematically assess the implications of official development assistance for recipient populations’ environmental coping capacity. Using 16 years of DHS survey data, in combination with geocoded World Bank development aid project locations and local weather data, we found limited evidence that development aid generates measurable child health gains for recipient populations in general. However, when focusing on the subsample of respondents exposed to recent drought, we found robust statistical results consistent with the notion that prior aid allocation reduces the extent of child undernutrition. Contrary to expectations, development assistance earmarked specifically for the local agricultural sector appears to perform less well. However, we should interpret the latter result with some care since agricultural aid projects are more likely to be allocated to hard cases and because potential control group contamination may lessen the point estimate unduly, increasing the risk of type II error (Torgerson, Citation2001).
While these findings are important in their own right, future research should seek to provide deeper insight into how aid projects improve local coping capacity. The fact that agricultural aid does not appear to outclass other types of development assistance in mitigating drought-related wasting suggests that important aid-sensitive drivers of malnutrition are found outside food production and provision systems. The link between climate resilience and quality of maternal and child health-care services should constitute a natural focal point in this endeavour.
A second priority for future research is to expand the scope beyond development aid provided by the World Bank. The need for comprehensive time-series, cross-national, georeferenced aid data in order to maximise the utility of the DHS data dictated a focus limited to World Bank-commissioned projects here. While this limitation moderates the generalisability of our findings, we are less concerned with the risk of bias. The main problem with having incomplete data in this context is the risk of control group contamination; that a significant share of the control population, in reality, has been exposed to the treatment (that is, development assistance from other donors). This is a very probable scenario, which would result in attenuation of the point estimate of the treatment effect and increasing the risk of rejecting a true hypothesis. However, our study has uncovered a consistent and statistically ‘significant’ treatment effect under drought, and the real effect is possibly considerably larger than what we are able to quantify.
A related limitation is our study’s inability, due to data constraints, to account for relevant emergency relief operations. For example, it may be that the control group in some locations includes recent recipients of emergency assistance. If this were a widespread pattern, it too would attenuate the estimated treatment effect. On the other hand, past development aid might also facilitate rapid response to emerging crises, such as drought and famine, such that some of the reported treatment effect, in fact, is a result of emergency assistance made possible through past ODA. While such a dynamic is entirely consistent with the overall conclusion of this article, the underlying explanation and driver of the aid effect would be qualitatively different. We defer this research challenge to future work.
The ambitious target of the 2015 Paris agreement on climate change mitigation should help ensure a faster transition to sustainable, carbon-neutral energy consumption, thereby limiting future warming. Even so, reducing human security challenges of increasingly devastating extreme weather events will largely depend on sustained local adaptation efforts and future development pathways. As succinctly summarised in a recent call for more research on the climate-health-security nexus, ‘poverty, state fragility, poor pre-existing health outcomes, and high susceptibility to climate change converge to amplify the effects of future famines, droughts, and neglected tropical diseases’ (Gupta, Mason-Sharma, Caty, & Kerry, Citation2017, p. e133). Official development assistance can be an important response to this challenge (IPCC, Citation2018, p. 29).
Supplemental Material
Download PDF (848.8 KB)Disclosure statement
No potential conflict of interest was reported by the authors.
Supplemental materials
Supplementary Materials are available for this article which can be accessed via the online version of this journal available at https://doi.org/10.1080/00220388.2019.1696958.
Additional information
Funding
Related Research Data
References
- Abay, K., & Hirvonen, K. (2017). Does market access mitigate the impact of seasonality on child growth? Panel data evidence from Northern Ethiopia. The Journal of Development Studies, 53(9), 1414–1429.
- Addison, T., Morrissey, O., & Tarp, F. (2017). The macroeconomics of aid: Overview. The Journal of Development Studies, 53(7), 987–997.
- AidData. (2017). World Bank geocoded research release, version 1.4.2. Retrieved from https://www.aiddata.org/data/world-bank-geocoded-research-release-level-1-v1-4-2
- Akombi, B. J., Agho, K. E., Merom, D., Renzaho, A. M., & Hall, J. J. (2017). Child malnutrition in sub-Saharan Africa: A meta-analysis of demographic and health surveys (2006-2016). Plos One, 12(5), e0177338.
- Alderman, H., & Headey, D. (2018). The timing of growth faltering has important implications for observational analyses of the underlying determinants of nutrition outcomes. Plos One, 13(4), e0195904.
- Asongu, S. A., & Nwachukwu, J. C. (2016). Foreign aid and governance in Africa. International Review of Applied Economics, 30(1), 69–88.
- Beguería, S., Vicente-Serrano, S. M., Reig, F., & Latorre, B. (2014). Standardized precipitation evapotranspiration index (SPEI) revisited: Parameter fitting, evapotranspiration models, tools, datasets and drought monitoring. International Journal of Climatology, 34(10), 3001–3023.
- Black, R. E., Victora, C. G., Walker, S. P., Bhutta, Z. A., Christian, P., de Onis, M., … Uauy, R. (2013). Maternal and child undernutrition and overweight in low-income and middle-income countries. The Lancet, 382(9890), 427–451.
- Briggs, R. C. (2014). Aiding and abetting: Project aid and ethnic politics in Kenya. World Development, 64, 194–205.
- Briggs, R. C. (2017). Does foreign aid target the poorest? International Organization, 71(1), 187–206.
- Clemens, M. A., Radelet, S., Bhavnani, R. R., & Bazzi, S. (2012). Counting chickens when they hatch: Timing and the effects of aid on growth*. The Economic Journal, 122(561), 590–617.
- Cutter, S. L. (2017). The forgotten casualties redux: Women, children, and disaster risk. Global Environmental Change, 42, 117–121.
- de Onis, M., & Habicht, J. P. (1996). Anthropometric reference data for international use: Recommendations from a World Health Organization expert committee. The American Journal of Clinical Nutrition, 64(4), 650–658.
- De Roeck, F., Orbie, J., & Delputte, S. (2018). Mainstreaming climate change adaptation into the European Union’s development assistance. Environmental Science & Policy, 81, 36–45.
- Doucouliagos, H., & Paldam, M. (2008). Aid effectiveness on growth: A meta study. European Journal of Political Economy, 24(1), 1–24.
- Dreher, A., & Lohmann, S. (2015). Aid and growth at the regional level. Oxford Review of Economic Policy, 31(3–4), 420–446.
- Ebi, K. L., & Bowen, K. (2016). Extreme events as sources of health vulnerability: Drought as an example. Weather and Climate Extremes, 11, 95–102.
- FAO, IFAD, UNICEF, WFP, & WHO. (2019). The state of food security and nutrition in the world 2019. Safeguarding against economic slowdowns and downturns. Rome: Food and Agriculture Organization of the United Nations.
- Feeny, S., & McGillivray, M. (2008). What determines bilateral aid allocations? Evidence from time series data. Review of Development Economics, 12(3), 515–529.
- Findley, M. G., Powell, J., Strandow, D., & Tanner, J. (2011). The localized geography of foreign aid: A new dataset and application to violent armed conflict. World Development, 39(11), 1995–2009.
- Fischer, E. M., & Knutti, R. (2015). Anthropogenic contribution to global occurrence of heavy-precipitation and high-temperature extremes. Nature Climate Change, 5(6), 560–564.
- Grace, K., Davenport, F., Funk, C., & Lerner, A. M. (2012). Child malnutrition and climate in Sub-Saharan Africa: An analysis of recent trends in Kenya. Applied Geography, 35(1), 405–413.
- Gupta, V., Mason-Sharma, A., Caty, S. N., & Kerry, V. (2017). Adapting global health aid in the face of climate change. The Lancet Global Health, 5(2), e133–e134.
- Harttgen, K., Klasen, S., & Vollmer, S. (2013). Economic growth and child undernutrition in sub-Saharan Africa. Population and Development Review, 39(3), 397–412.
- Hoddinot, J. (2006). Shocks and their consequences across and within households in rural Zimbabwe. The Journal of Development Studies, 42(2), 301–321.
- Hoddinott, J., & Kinsey, B. (2001). Child growth in the time of drought. Oxford Bulletin of Economics and Statistics, 63(4), 409–436.
- Hodler, R., & Raschky, P. A. (2014). Regional favoritism. The Quarterly Journal of Economics, 129(2), 995–1033.
- Iacus, S. M., King, G., & Porro, G. (2012). Causal inference without balance checking: Coarsened exact matching. Political Analysis, 20(1), 1–24.
- IPCC. (2018). Global warming of 1.5°C. Retrieved from World Meteorological Organization website: https://www.ipcc.ch/sr15/chapter/summary-for-policy-makers/
- Jablonski, R. S. (2014). How aid targets votes: The impact of electoral incentives on foreign aid distribution. World Politics, 66(2), 293–330.
- Kaya, O., Kaya, I., & Gunter, L. (2013). Foreign aid and the quest for poverty reduction: Is aid to agriculture effective? Journal of Agricultural Economics, 64(3), 583–596.
- Kotsadam, A., Østby, G., Rustad, S. A., Tollefsen, A. F., & Urdal, H. (2018). Development aid and infant mortality. Micro-level evidence from Nigeria. World Development, 105, 59–69.
- Kumar, S., Molitor, R., & Vollmer, S. (2016). Drought and early child health in rural India. Population and Development Review, 42(1), 53–68.
- Lentz, E. C., & Barrett, C. B. (2013). The economics and nutritional impacts of food assistance policies and programs. Food Policy, 42, 151–163.
- Lesk, C., Rowhani, P., & Ramankutty, N. (2016). Influence of extreme weather disasters on global crop production. Nature, 529(7584), 84–87.
- Long, A., Prewitt, T., Kaufman, J., Rotimi, C., Cooper, R., & McGee, D. (1998). Weight–Height relationships among eight populations of West African origin: The case against constant BMI standards. International Journal of Obesity, 22(9), 842–846.
- Martorell, R. (1999). The nature of child malnutrition and its long-term implications. Food and Nutrition Bulletin, 20(3), 288–292.
- Masset, E., Haddad, L., Cornelius, A., & Isaza-Castro, J. (2012). Effectiveness of agricultural interventions that aim to improve nutritional status of children: Systematic review. BMJ, 344, d8222.
- Mulmi, P., Block, S. A., Shively, G. E., & Masters, W. A. (2016). Climatic conditions and child height: Sex-specific vulnerability and the protective effects of sanitation and food markets in Nepal. Economics and Human Biology, 23, 63–75.
- Nelson, A. (2008). Travel time to major cities: A global map of accessibility. Retrieved from Global Environment Monitoring Unit - Joint Research Centre of the European Commission website: http://forobs.jrc.ec.europa.eu/products/gam/
- Nelson, G. C., Valin, H., Sands, R. D., Havlík, P., Ahammad, H., Deryng, D., … Willenbockel, D. (2014). Climate change effects on agriculture: Economic responses to biophysical shocks. Proceedings of the National Academy of Sciences, 111(9), 3274–3279.
- Nordhaus, W. D. (2006). Geography and macroeconomics: New data and new findings. Proceedings of the National Academy of Sciences of the United States of America, 103(10), 3510–3517.
- O’Connell, S. A., & Smith, C. (2016). Economic growth and child undernutrition. The Lancet Global Health, 4(12), e901–e902.
- Page, J., & Shimeles, A. (2015). Aid, employment and poverty reduction in Africa. African Development Review, 27(S1), 17–30.
- Paul, B. K. (2006). Disaster relief efforts: An update. Progress in Development Studies, 6(3), 211–223.
- Peel, M. C., Finlayson, B. L., & McMahon, T. A. (2007). Updated world map of the Köppen-Geiger climate classification. Hydrology and Earth System Sciences, 11(5), 1633–1644.
- Petrikova, I. (2015). Aid for food security: Does it work? International Journal of Development Issues, 14(1), 41–59.
- Quisumbing, A. R. (2003). Food aid and child nutrition in rural Ethiopia. World Development, 31(7), 1309–1324.
- Reinbold, G. W. (2011). Economic inequality and child stunting in Bangladesh and Kenya: An investigation of six hypotheses. Population and Development Review, 37(4), 691–719.
- Shively, G. E. (2017). Infrastructure mitigates the sensitivity of child growth to local agriculture and rainfall in Nepal and Uganda. Proceedings of the National Academy of Sciences of the United States of America, 114(5), 903–908.
- Smith, L. C., & Haddad, L. (2015). Reducing child undernutrition: Past drivers and priorities for the post-MDG era. World Development, 68, 180–204.
- Springmann, M., Mason-D’Croz, D., Robinson, S., Garnett, T., Godfray, H. C. J., Gollin, D., … Scarborough, P. (2016). Global and regional health effects of future food production under climate change: A modelling study. The Lancet, 387(10031), 1937–1946.
- Stott, P. (2016). How climate change affects extreme weather events. Science, 352(6293), 1517–1518.
- Sumner, A., & Glennie, J. (2015). Growth, poverty and development assistance: When does foreign aid work? Global Policy, 6(3), 201–211.
- Torgerson, D. J. (2001). Contamination in trials: Is cluster randomisation the answer? BMJ: British Medical Journal, 322(7282), 355–357.
- UN. (2015). The Millennium development goals report 2015. Retrieved from United Nations website: https://resourcecentre.savethechildren.net/library/millennium-development-goals-report-2015
- UNICEF, WHO, & The World Bank. (2018). Joint child malnutrition estimates—Levels and trends. Retrieved from http://www.who.int/nutgrowthdb/estimates2017/en/
- WHO, & UNICEF. (2009). WHO child growth standards and the identification of severe acute malnutrition in infants and children. Retrieved from World Health Organization and United Nations Children’s Fund website: http://www.who.int/nutrition/publications/severemalnutrition/9789241598163/en/
- Williamson, C. R. (2008). Foreign aid and human development: The impact of foreign aid to the health sector. Southern Economic Journal, 75(1), 188–207.
- Wilson, S. E. (2011). Chasing success: Health sector aid and mortality. World Development, 39(11), 2032–2043.
- Wucherpfennig, J., Weidmann, N. B., Girardin, L., Cederman, L.-E., & Wimmer, A. (2011). Politically relevant ethnic groups across space and time: Introducing the GeoEPR dataset. Conflict Management and Peace Science, 28(5), 423–437.
- Yamano, T., Alderman, H., & Christiaensen, L. (2005). Child growth, shocks, and food aid in rural Ethiopia. American Journal of Agricultural Economics, 87(2), 273–288.
Appendix
This appendix provides further details on the construction of the dataset. Descriptive statistics and documentation of sensitivity tests can be found in the online Supplementary Material.
Main variables
The empirical material builds on rounds 4–7 of the Demographic and Health Surveys (DHS), conducted between 2001 and 2016 across 16 countries in Sub-Saharan Africa. The unit of analysis is rural each child, under 5 years of age, born by women interviewed in the DHS surveys (N = 138,103 prior to matching). All observations are geolocated, which permits coupling the DHS data with other data sources.
The dependent variable is the standardised weight-for-height (WHZ) index, which gives the child’s deviation from the normative median weight in an international reference population, given age, sex, and height. To ease the interpretation of regression results, we multiply WHZ scores by 100.
The treatment variable, proximity to development aid projects, is based on AidData consortium v. 1.4.2 (AidData, Citation2017; Findley, Powell, Strandow, & Tanner, Citation2011). The AidData dataset tracks 5,684 World Bank projects across 61,243 locations globally between 1995 and 2014 and gives information about the type of project, date of opening and closing, total funding committed and dispersed, geographical coordinates, and the precision of the geocoding. We only consider project locations that have a spatial precision code of 3 or better, equivalent to second-level subnational administrative entity (district or municipality) or lower, in order to ensure reasonable confidence in treatment exposure and to allow sufficient within-country variation.
Treatment is determined by first imposing a 50 km buffer around each DHS cluster centroid and then identifying aid project locations that fall within the buffer zone. To be counted, development projects must have been established within the buffer between one and 4 years prior to the survey date (). From this we create two alternative treatment variables:
A binary variable [aid] coded 1 if the respondent belonged to a DHS cluster located within 50 km of one or more aid projects during the treatment period; and
A binary variable [ag. aid] coded 1 if the respondent belonged to a DHS cluster located within 50 km of one or more agricultural aid projects during the treatment period.
Since the geocoding of many aid project locations is accurate only at the level of districts, and the DHS coordinates are jittered to preserve respondent confidentiality, we believe a 50 km buffer constitutes a reasonable treatment threshold. See Supplementary Material Table S9 for results based on an alternative 25 km buffer.
As post-treatment shock, we categorise all respondents according to their recent drought exposure, based on georeferenced high-resolution meteorological data from SPEIbase v. 3.23 (Beguería et al., Citation2014). SPEI is a dominant meteorological drought indicator; it is superior to simpler precipitation-based indices because it also accounts for temperature and evapotranspiration potential, and unlike vegetation indices and consequence-based drought event data, SPEI is location-standardised, multi-scalar, and exogenous to characteristics of the affected society. We use the 12-month version (SPEI-12) to ensure that it covers the most recent growing season regardless of the date of the DHS interview. The SPEI raster is linked to the DHS respondents through spatial overlay, where respondents are assigned the observed weather pattern of the grid cell within which they reside.
In models using the continuous SPEI-12 index (), positive values, which imply wetter-than-normal conditions, are censored and the index is then reversed, such that higher values denote more severe drought.
Sequencing of variables
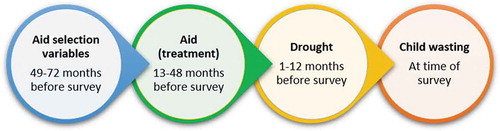
If development aid projects have a measurable effect on recipient communities’ ability to cope with future drought, they must be implemented prior to the experienced drought. Given that drought exposure is measured over the 12-month period immediately prior to each survey, the treatment variable captures ODA projects that were implemented during the preceding 3 years. The 3-year treatment window represents a pragmatic midpoint between maximising inclusiveness and maintaining a homogenous treatment group. Since ODA is not distributed at random, we account for important determinants of aid allocation through matching factors, measured five to 6 years prior to each DHS survey. visualises the sequencing of the variables.
Figure A1. Sequencing of variable measurements.
Matching factors
The CEM matching accounts for the following contextual variables:
a.(log) number of previous aid projects in the location [Aid history] from AidData (Citation2017), since aid allocation often exhibits a distinct path dependence (Feeny & McGillivray, Citation2008);
b.exclusion of local population from participation in national politics [Excluded] from the Ethnic Power Relations project (Wucherpfennig, Weidmann, Girardin, Cederman, & Wimmer, Citation2011), since aid distribution is sensitive to ethnopolitical dynamics in the recipient state (Jablonski, Citation2014);
c.(log) local population size [Population] from the Gridded Populations of the World v.4, since population size determines the overall potential impact of aid;
d.(log) gross cell product [GCP], a local variant of gross domestic product from G-Econ (Nordhaus, Citation2006), since the level of poverty reflects neediness and donor interests (though see, for example, Briggs, Citation2017);
e.(log) travel time by road to the nearest major urban centre [Periphery] from Nelson (Citation2008), since logistical barriers and quality of infrastructure affect the feasibility of ODA implementation; and
f.arid climate zone dummy [Arid climate], based on the Köppen–Geiger classification system (Peel, Finlayson, & McMahon, Citation2007), because marginal ecological areas may be especially amenable to development assistance. This factor is included in matching only when agricultural aid is the treatment (Supplementary Material Table S5).
It is not hard to imagine other factors that might affect aid allocation, but in order to preserve a sufficient number of observations for the empirical analysis, we need to limit the number of selection factors. For each additional pre-treatment factor that is included in the CEM matching procedure, the number of matched DHS respondents available for analysis drops significantly.