
Abstract
While much has been said in recent years about the importance of engaging rural youth in sub-Saharan Africa’s development, the factual data about how African youth currently engage in rural economies remain sparse. We use recent nationally representative household survey data from six countries to describe the patterns of such engagement. We find that young people participate in agriculture at similar rates to older people. However, participation in non-farm wage employment and business activity changes with age, peaking in the 30s. The likelihood of reporting no activity is greatest for people in their 20s. In more remote places, people leave school earlier and are less likely to engage in the non-farm sector, compared with people in more accessible places. We also find evidence that the non-farm economy is more diversified in relatively more accessible places, offering a larger set of options for economic engagement. We show that ‘landscapes of opportunity’ , defined by economic remoteness and agricultural potential, are an important way of assessing the choices available to young rural people. A key conclusion is that efforts to develop a ‘youth lens’ for rural development should not abandon the mainstays of rural investment strategies such as infrastructure, education, and agricultural R&D.
1. Introduction
Understanding and engaging with rural youth in the context of sub-Saharan Africa’s development has become a major concern in recent years (FAO, CTA and IFAD, Citation2014,; Filmer & Fox, Citation2014; IFAD, Citation2019). However, much of the policy-oriented discussion has been in the absence of robust empirical evidence about how young Africans actually engage with the subcontinent’s rural economies. As a consequence, many of the stylised assertions about young people in rural Africa – e.g. that they cannot access land or credit, they do not want to farm, they are particularly innovative, and that training promotes youth employment – are neither well-founded empirically nor sufficiently fine-grained to be policy-relevant (Fox & Kaul, Citation2017; Mabiso & Benfica, Citation2019; Mueller & Thurlow, Citation2019; Sumberg & Hunt, Citation2019).
These assertions are nevertheless important because they continue to (mis)inform discourse, policy, and investment. Specifically, they are used as the basis of an argument that youth are different – in effect, because of their age, they engage with the rural economy differently and face different constraints, and therefore require youth-focused policy and intervention. However, if production credit, for example, is not generally available to any rural economic operators, regardless of age, the argument for youth-focused credit provision is difficult to sustain unless you believe that young people play a special role in processes of technological change, employment creation, or rural transformation (Sumberg & Hunt, Citation2019). This is not to suggest that young people do not face challenges in building their livelihoods, or that there are no differences between youth and adults (e.g. experience). Rather, the argument is that it should not be assumed that these challenges and differences represent constraints that can be addressed through intervention.
There is a growing policy-oriented research literature on how African youth engage with rural economies. One strand draws from large scale, often nationally representative surveys to develop country and/or cross-country analyses of labour allocation, land access, farm size and productivity, migration, and so forth (Mueller & Thurlow, Citation2019; IFAD, Citation2019; Yeboah & Jayne, Citation2018). A second strand, addressing similar questions, draws on village or district surveys, focusing either on households or individuals, and sometimes accompanied by individual and/or group interviews (Andersson Djurfeldt, Kalindi, Lindsjö, & Wamulume, Citation2019; Berckmoes & White, Citation2014; Bezu & Holden, Citation2014; Kosec, Ghebru, Holtemeyer, Mueller, & Schmidt, Citation2018; Yeboah et al., Citation2020; Tadele & Gella, Citation2012). There are also survey data pertaining specifically to rural young people’s aspirations, and within these the importance of farming and rural areas (BMZ, Citation2017; Leavy & Hossain, Citation2014).
As to be expected, very different pictures emerge depending on the scale of the analysis, the characteristics of the study sites and the way in which ‘youth’ is defined as a category. There is as yet no coherent story of how young people across rural Africa engage with rural economies, or how they think about their futures. And to date, no analytical frame has been proposed that seeks to harness the diversity of rural contexts for more relevant policy towards rural youth.
In his article, we provide such a framework and use it to present new empirical evidence around ways in which young Africans in several countries engage with the rural economy. Using data from six countries we show that rural young people participate actively in rural farm and non-farm sectors. While participation in agriculture is roughly the same for young people and older people in most countries, rates of engagement in the rural non-farm sector, through both wage and self-employment, increase as young people move through their 20s and peak when they are in their 30s. People in their 20s are much more likely to report no economic activity, as compared with older people. However, we find that the patterns of labour allocation are even more strongly conditioned by economic geography: access to markets is positively associated with engagement in the non-farm sector through wage or self-employment, as well as with the age at which people leave school, with young people leaving school earlier in more remote places.
In framing and organising this new empirical evidence, we use the notion of a ‘landscape of opportunity’. This term is not meant to suggest that positive opportunities abound in any absolute sense, but rather to indicate that the opportunities which do exist vary, for example, in type and density, across geographic space in structured ways. Specifically, we argue that these landscapes of opportunity are shaped by economic remoteness and agricultural potential, and provide an important way of assessing the possibilities available to young (and non-young) rural people, and for guiding policy and investment decisions. Of course, within any given landscape, the set of economic opportunities that young people actually engage with is further limited by their family background and education, and their imaginations. Our analysis suggests, however, the utility of using geospatial indicators of access to markets and agricultural potential to partition the subcontinent’s rural economic space in ways that correspond with variation in observed economic outcomes. We show that this framework is a powerful way of organising and understanding labour allocation and other choices made by young people in rural sub-Saharan Africa.
The rest of the paper is organised as follows: Section 2 outlines a simple framework for organising our thinking about the spatial distribution of rural economic opportunity, and Section 3 describes the data we use to implement this framework. Section 4 presents descriptive statistics on the patterns of labour allocation and other economic decisions made by rural young people in our study countries. Section 5 concludes with implications for policy, programming, and further empirical research.
2. Conceptualising the distribution of rural opportunity
Much of the analysis of technological change and agricultural commercialisation in Africa – two critically important aspects of rural transformation (IFAD, Citation2016) – has been at the farm and/or household levels (Glover et al., Citation2016). However, rural economic opportunity spans both on- and (increasingly) off-farm activities (Dzanku, Citation2019; Jayne, Chamberlin, & Benfica, Citation2018; Van den Broeck & Kilic, Citation2019), and it has a strong spatial dimension. This suggests the need to enlarge the frame of analysis beyond the farm and household to encompass the local economy. This is appealing because rural opportunity emerges within the (spatially mediated) interplay between farm, non-farm, and other economic activity. The dynamics of this interplay is central to the literature on the non-farm rural economy and linkages (Davis, Di Giuseppe, & Zezza, Citation2017; Haggblade, Hazell, & Reardon, Citation2007; Reardon, Berdegué, Barrett, & Stamoulis, Citation2007), as well as livelihood diversification (Ellis, Citation2000) and de-agrarianisation (Bryceson, Citation2002; Bryceson & Jamal, Citation1997). An important challenge is that the nature of much (on- and off-farm) rural work – essentially self-employment that is largely informal, seasonal and (at least partially) subsistence-oriented – means that the value of standard labour market concepts and indicators like employment, unemployment, underemployment, and job creation needs to be carefully considered. It is also the case that opportunities within the local rural economy exist alongside, and in relation to, opportunities further afield. The landscape of opportunity extends well beyond what might be considered the local economy and encompasses other rural, small-town and urban settings, both within and across national borders.
2.1. Rural diversity and the geography of rural development
A long-term interest of geographers, economists and agricultural scientists has been to make sense of the diversity that characterises rural Africa. Some focused on the ‘system’ level including early efforts to classify agricultural and farming systems (Allan, Citation1965; Rutherberg, Citation1971). The spatial aspect of these classifications was often either very broadly drawn, or implicit. The use of ‘recommendation domains’ within farming systems research sought to group farms, farmers, or households with similar characteristics or facing similar conditions, and for whom the same technical recommendations were likely to be appropriate (Collinson, Citation2000; Hildebrand, Singh, Bellows, Campbell, & Jama, Citation1993). Again, the spatial distribution of and/or spatial relations among and between recommendation domains was often of secondary importance.
Agro-ecological zonation is an example of a more spatially explicit approach. Here physical and bio-physical characteristics like elevation, soil type, and rainfall are used to identify zones with a level of homogeneity sufficient to describe ‘potential’ and thus allow more effective planning and agricultural extension (for an example from Kenya see Jiitzold & Kutsch, Citation1982; Sombroek, Braun, & van der Pouw, Citation1982). Most exercises along these lines paid relatively little attention to the socio-economic or agrarian relations underpinning ongoing agricultural activities within the agro-ecological zones. The World Bank’s ‘sleeping giant’ analysis of Africa’s guinea savannah is a relatively recent example of this approach (The World Bank, Citation2009).
A simple framework for thinking about the diversity of rural areas that brings together elements of the agro-ecological and the socio-economic was proposed by Wiggins and Proctor (Citation2001). It uses differences in the quality of natural resources and access to markets to characterise current activities within different rural areas, and potential future agricultural and rural development trajectories (). Along similar lines the development domains’ literature (Chamberlin, Pender, & Yu, Citation2006; Pender, Jagger, Nkonya, & Sserunkuuma, Citation2004; Pender, Place, & Ehui, Citation2006) uses agricultural potential, access to markets and population density to understand ‘opportunities and constraints facing alternative rural livelihood options’ (Chamberlin et al., Citation2006).
Table 1. Economic geographies as opportunity structures
While spatial assessments have generally been used to frame hypotheses and organise empirical data on how the livelihood choices of rural households are shaped by their context, distinguishing between choices of different types of individuals has generally not been a feature of such analysis (exceptions to this include Arslan et al. Citation2020 and Dolislager et al. Citation2020 in this special section). However, a spatial framing of the opportunities faced by Africa’s rural young people is useful, given the generally undifferentiated assertions made about them – e.g. the young are abandoning agriculture and non-vibrant rural areas to seek their fortunes off the farm and in urban areas. In our implementation of the Wiggins–Proctor framework (), we note where we expect to see the various types of economic engagements that have been proposed as key actual or potential livelihood choices available to rural young people. In the summary statistics compiled in this paper, we focus on labour allocation decisions (e.g. on-farm work, self-employment, wage labour). We do acknowledge that there are other strategic economic livelihood decisions of importance – such as migration – which are not addressed here due to data constraints.
3. Data
The data we analyse are drawn from georeferenced, nationally representative household surveys from six countries: Ethiopia, Niger, Nigeria, Tanzania, Uganda, and Zambia ( and Appendix ). The data for the first five countries come from the Living Standard Measurement Study-Integrated Surveys on Agriculture (LSMS-ISA) programme, which strives to standardise survey instruments across countries to enable comparisons of outcomes across countries (and across time within countries). The LSMS-ISA initiative provides a unique opportunity to generate new insights into young people’s involvement in the rural economy. The LSMS-ISA is a collaborative project between the World Bank and national statistics offices of eight partner countries in SSA.Footnote1 The project supports multiple rounds of nationally representative panel surveys designed to improve the understanding of the links between agriculture, socioeconomic status, and non-farm income-generating activities. The innovation with the LSMS-ISA surveys is that they collect data on a wide range of activities of relevance to the rural economy. Unlike previous studies based on small samples, the large coverage of these datasets allows some disaggregation by geography, household type, and other factors. The Zambia data are from the Rural Agricultural Livelihoods Survey, a nationally representative household panel survey which is comparably comprehensive in scope as the LSMS-ISA data. Most of these data are georeferenced, enabling the incorporation of additional geospatial conditioning and defining factors into the analysis.Footnote2 We focus on the most recent rounds of these surveys in the interest of generating an up-to-date overview of how young people engage with, and contribute to, the rural economy.
Table 2. Household survey data used in this study
These six countries were selected on the basis of available data on indicators of interest. While we do not make any formal claims about their representativeness of SSA as a whole, we do note that together these countries account for approximately 45 per cent of the subcontinent’s estimated total rural population. Furthermore, these countries are well distributed across the subcontinent, and cover the predominant farming systems and agro-ecological conditions of West, East, and Southern Africa, although they differ in their history, agriculture, and development policy.
Our sample was restricted to rural households, defined as those located in enumeration areas defined as rural by the national statistical agency for each country, as well as households located in enumeration areas classified as urban, but having population densities below 1000 persons per square kilometre.Footnote3 Thus, we seek to address youth engagement across the spectrum of rural-to-periurban contexts.
Household rosters are used to identify ‘youth’ as any member aged 15–24 years. This, like all age-based categories, is crude because it takes no account of social age, level of responsibility, etc. (Ripoll et al., Citation2017). Nonetheless, it is what these data allow, and does correspond with definitions of youth which are widely used in the literature.
The LSMS-ISA data provide information relevant to individuals as well as to households. In particular, labour allocation decisions are elicited and analysed at the individual level, while income-orientation and related farming decisions are analysed at the household level. The LSMS-ISA data provide information on time use and hence labour allocation decisions for all adult household members for the last 7 days. Using these modules we can construct intensive and extensive margins of labour allocation decisions across various activities. These labour statistics are expected to suffer from measurement problems. Furthermore, the cross-country comparison of these statistics is challenging because of variations in contexts and definitions of activities. However, because of lack of alternative sources of labour data in many sub-Saharan Africa countries, these labour statistics are widely used in previous studies (e.g., Dillon et al., Citation2019; Djido & Shiferaw, Citation2018; McCullough, Citation2017; Palacios-Lopez, Christiaensen, & Kilic, Citation2017). We are cognizant of these limitations in our data and to minimise such errors arising from recording of time use, we construct and rely on the extensive margin of labour allocation, that is whether an individual has participated in some specific economic activities. This indicator is expected to be less susceptible to measurement error than continuous time allocation measured in hours.Footnote4
To complement these data, we define zones of economic geography based on the following variables. For market access (represented as the horizontal dimension of the framework: high-access, middle-countryside, and remote areas), we rely on estimated travel time to the nearest urban centre of 50,000 or more inhabitants, using data from the Malaria Atlas Project (Weiss et al., Citation2018). ‘Accessible’ areas are defined as locations within 30 minutes of travel time to an urban centre of 50,000+; areas are classified as middle-countryside if they are between 30 minutes and 2 hours; remaining areas are classified as remote. We further net out urban areas using the boundaries defined in the Global Human Settlements database (Pesaresi & Freire, Citation2016).
For agricultural potential, we use a simple measure of EVI (Enhanced Vegetation Index) as our primary indicator, using data from the MODIS sensor. As a measure of biomass, EVI effectively synthesises several agroclimatic, edaphic, and other conditioners of agricultural production potential. We define low-potential areas as those with less than 0.5 EVI at the peak of greenness over a three-year period. This threshold is fundamentally arbitrary but does provide a useful shorthand way of distinguishing between conventionally recognised high- and low-potential areas.
4. Young people and the rural economy in Africa
4.1. Distribution of Africa’s young people across economic geographies
Using geospatial estimates of average annual rainfall and distance to nightlights from the sources described above, shows the distribution of six economic geographies across Africa. We then overlay these mapped geographies with recent geospatial estimates of age-disaggregated population distributions (Wardrop et al., Citation2018) to quantify the number and shares of young people (aged 15–24) in each geography. Results are summarised in (also see Appendix for a larger selection of countries). It is striking that, overall, 56 per cent of young people live in areas with low agricultural potential, and 28 per cent in areas that have low potential and are also remote. The remaining young people are divided between Accessible (28%) and Middle-countryside (22%) areas, and a slight majority of these young people in areas with relatively low agricultural potential.
Table 3. Distribution of young Africans (aged 15–24) across economic geographies (1000s of individuals)
Figure 1. Map of economic geographies in Africa
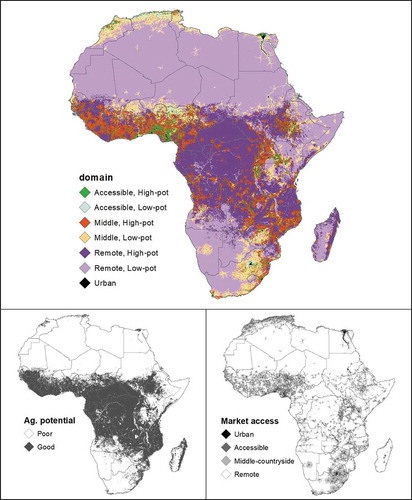
These findings would appear to have important implications for youth-focused agricultural and rural development strategies: is it realistic that the rural economy can generate meaningful employment for the 62 per cent of rural youth living in remote areas and low-potential middle-countryside areas?
4.2. Individual labour allocation by age
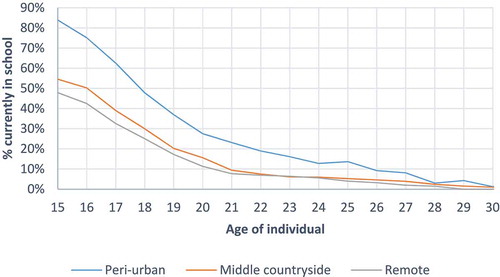
As a precursor to examining how economic engagement is shaped by geographic and other contexts, we examine available indicators of individuals’ labour allocation by age. Results indicate that patterns vary strongly by age. shows the percentage of individuals in Tanzania which report participation in wage employment, non-farm business (self-employment), family farm activities, and school. Those who report no participation in any of these categories are also tabulated. As expected, young people are much more likely to be in school. Of note, however, is the relatively low share of young people who are in school: only half of the sample aged 15–18 reports currently being in school. This share drops precipitously between the ages of 15 and 20. The difference between 15–19 and 20–24-year-olds also highlights some drawbacks of packaging information about ‘youth’ into the standard 15–24 age range, given the clear heterogeneity of labour allocation patterns within this range. Furthermore, there is a strong spatial dimension to this: individuals in more remote areas are less likely to report being in school at any age, signalling that average school-leaving ages are falling with remoteness (). Individuals’ labour allocation for other countries, presented in Appendix and Appendix , show similar patterns.
Figure 2. Individual labour allocation decisions by age (Tanzania)
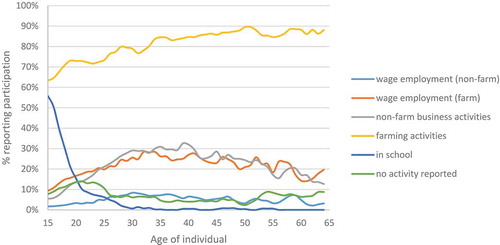
Figure 3. School participation rates, by age and remoteness category (Tanzania)
A second pattern to note is that younger people are somewhat less likely to participate in non-farm wage or business work than older people. A 35-year-old is about twice as likely to report non-farm activity than an 18-year-old. Furthermore, while 15–24-year-olds report slightly lower rates of family farm engagement than older individuals, they are still roughly comparable in magnitude across age groups, signalling the importance of farm work for young people. Appendix shows that these patterns are not unique to Tanzania but are found in the other study countries.
4.3. Individual labour allocation of young people varies by context
assembles further evidence on how individuals’ labour allocation patterns differ across economic geographies. Most strikingly, wage employment and non-farm business engagement increase with proximity to markets. In some countries (e.g. Ethiopia, Zambia), the relative importance of these non-farm activities decreases with remoteness more slowly in high-potential areas. In other words, in more remote areas, non-farm opportunities are greater in higher-potential areas. This likely reflects the role of agricultural surplus in enabling non-farm economic activities.
Table 4. Percentage of 15–24-year-olds reporting labour allocation to different activities
In a countervailing trend, the share of young people engaged in household farming activities generally increases with distance from markets. The relationship between farm engagement and agricultural potential (as currently defined) is less straightforward. In some countries (e.g. Niger) the share of young people engaged in family farming activities is larger in higher-potential areas, although in other countries (e.g. Nigeria) the opposite appears to be the case.
The share of young people in school is strongly positively correlated with proximity to markets; young people in more remote areas consistently show lower rates of school attendance for the same age groupings. These patterns also vary strongly across agricultural potential, with the difference between school attendance in low- versus high-potential areas increasing with remoteness. This pattern is interesting, although its drivers are unclear; it may be that public investments in education (and, thus, opportunities) are more limited in marginal areas. Alternatively, it may be that relatively higher household welfare levels in high-potential areas enable young people to stay in school longer, as there is a reduced need for them work to contribute to household income.
4.4. Distribution of employment opportunities
shows the distribution of wage employment across geography, in relation to the distribution of young people (aged 15–24). This table shows, for each of the six domains of economic geography, each zone’s share of (i) young people, (ii) employed young people, and (iii) employed young people in full-time equivalents (FTEs). Within each country, the top panel (a) shows the distribution of these numbers across domains. The bottom panel (b) shows the number of employed and employed-FTEs in each domain as a share of the number of people. The stark (although unsurprising) interpretation is that the distribution of employment opportunities for young people (as measured by the number of employed) is strongly skewed towards more accessible areas. For example, while accessible/good-potential areas in Ethiopia are home to 14 per cent of rural young people, they account for 23 per cent of all employed young people and 28 per cent of all employed young FTEs. Conversely, remote/poor-potential areas are home to 17 per cent of young people, but only 13 per cent of the employed young, and 1 per cent of employed young FTEs. The fact that these trends are even more pronounced when shown in per-FTE terms indicates that not only is the distribution of wage employment skewed to more favourable areas but also the distribution of full-time employment possibilities (which may be taken as one measure of employment quality).
Table 5. Distribution of young people, employed young people, and employed young FTEs
below shows the same distributions as above, but drops the agroclimatic potential dimension, so there are just three categories of economic geography: accessible, middle, and remote. These more streamlined patterns are possibly easier to interpret. (We omit panel b for simplicity.)
Table 6. Distribution of young people, employed young people, and employed young FTEs
There are several other measures of the distribution of quality employment opportunities that we might consider. provides a number of these measures for Tanzania. Comparing panels (a) and (b), we see that while the share of wage-earners in the young population declines strongly with remoteness (and more moderately so with agricultural potential), the share of young wage-earners with ‘skilled’ jobs (i.e. administrators, professionals, or technicians) declines even more precipitously across geography, particularly the access dimension. The share of young people with skilled and semi-skilled jobs (panel c) shows similar trends, as does the share of jobs which are non-agricultural (panel d). Interestingly, the relative share of these semi-skilled and non-agricultural jobs is larger in the low-potential remote and middle-countryside areas than in the high-potential remote and middle-countryside areas (although the overall share of wage jobs is lower). This may reflect out-posting of civil servants and other workers in sectors which are spatially distributed according to political or social motivations rather than in response to local economic vibrancy. In terms of diversity, both the diversity of sectors (panel e) and of employment types (panel f) shows strong gradients across the access dimension, with levels of diversity in the more accessible areas double in the magnitude of the diversity of in remote areas. These findings underscore the multidimensional ways in which employment opportunities for young people become more limited to economic remoteness.
Table 7. Distribution of wage employment quality indicators (Tanzania)
4.5. Alternative ways of capturing geographical context
So far, our classification of agricultural potential and accessibility has been discrete and based on thresholds to define agricultural potential and accessibility. These types of classifications have some limitations. Most importantly, agricultural potential and (market) accessibility are not potentially discrete outcomes, rather latent continuous outcomes that involve continuous variation in opportunities associated with the agricultural and non-agricultural sector. Thus, another slightly different and data-driven approach is to compile a number of attributes and spatial characteristics that are expected to influence and explain agricultural potential or market accessibility. Aggregating these various spatial and agro-ecological attributes of communities can provide more explanatory power along a continuous gradient of related conditions. One benefit of such an approach is it allows us to explore non-linear threshold effects or natural breaks in associations which may inform how we construct category thresholds.
For this purpose, we compile a set of geospatial attributes of survey locations, which describe different aspects of agricultural potential or market potential. For instance, in an attempt to explain the market potential of a locality, we complied the following spatial attributes: population density, distance to market, distance to the nearest paved road, nightlight intensity, and distance to the nearest non-zero nightlight. Similarly, considering spatial attributes that may explain agricultural potential we compile the following variables: EVI, annual rainfall, soil nutrient availability, and water-retention capacity. We then employed factor analysis to quantify the loadings of these variables into some unknown latent factors. Consistent with our intuition and classification above, those spatial attributes expected to explain market potential have higher factor loadings into the latent index that we refer to as the accessibility or market potential indicator. Similar patterns are observed with all other remaining variables. Based on these factor loadings, we then construct two continuous indexes that we interpret as capturing agricultural potential and market potential (or accessibility).
In , we explore whether these two indexes can meaningfully explain labour market outcomes of young people in Africa. We particularly estimate nonparametric polynomial regressions of young people’s labour allocation and outcomes on these two indexes. In these figures, panel a plots the predicted share of individuals participating in farming activities (in the vertical axis), plotted against the index representing agricultural potential (on the horizontal axis). Panel b plots the same dependent variable (predicted share of individuals participating in farming activities) against the index representing market access on the horizontal axis. Panels c-f show similar plots for non-farm business participation (c and d), and wage employment (e and f), against the same indices of agricultural potential and market access. The indices are constructed such that values on the horizontal access read from low (left-hand side) to high (right-hand side).
Figure 4. Individual labour allocation and generalised indices for Ethiopia (individuals aged 15–24)
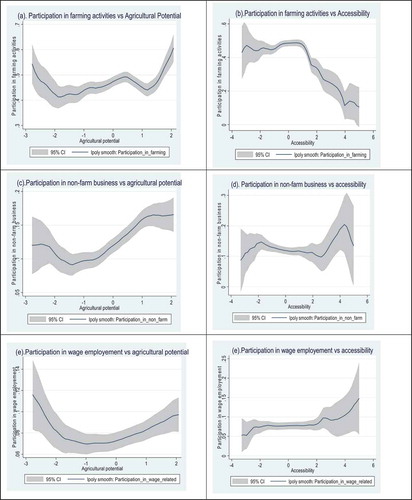
Figure 5. Individual labour allocation decisions and generalised indices for Niger (individuals aged 15–24)
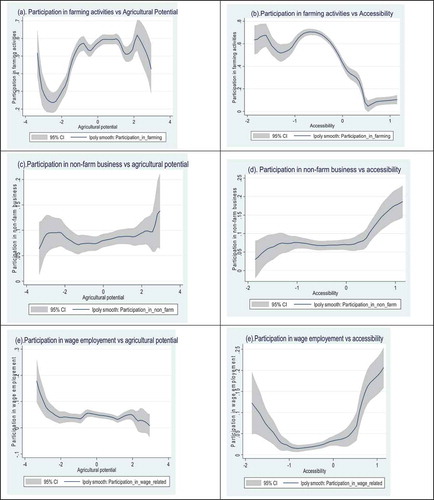
, for Ethiopia, shows that rates of participation in farming activities are positively and strongly correlated with agricultural potential, while negatively correlated with accessibility and proximity to urban areas. shows similar patterns are observed for Niger (results for Nigeria are given in Appendix ). Besides confirming the key empirical regularities from our previous tables, the nonparametric figures below provide some fresh insights into the linkage between agricultural potential and non-farm activities. We can observe, for example, that young people living in high-potential areas have higher rates of participation in both the farm and non-farm economy. This likely reflects that a vibrant farm economy in high-potential areas has important spillover impacts on the non-farm economy.
4.6. Income orientations of young households change over economic geographies
The structure of available survey data means that we are unable to build individual-level estimates of income orientation. Instead, we must aggregate income and income shares at the household level, which means the link with ‘young people’ is more tenuous. Nonetheless, by organising households by age of the head, we are able to say something about age-related patterns in household income. shows income orientations for households with heads aged 30 or younger, organised by economic geography. A number of observations stand out. First, farm orientation (particularly with respect to crop production) strongly increases with distance from markets, and increases with agricultural potential. These trends are consistent across alternative definitions of market access and agricultural potential.
Table 8. Income orientations of young households
Second, livestock income shares differ significantly across countries, reflecting different agro-ecologies and farming systems; but in those countries where livestock income is relatively important, its share is generally also increasing with market remoteness, probably reflecting relative land availability.
Third, non-farm business and non-farm wage income shares of total household income generally increase with proximity to markets, as expected. These shares also generally increase with agricultural potential, indicating the positive linkages between the farm and non-farm economies.
Finally, transfer incomes (remittances and gifts) differ highly across countries, but in many countries, they decline with remoteness. This may indicate that more remote areas are sending out fewer migrants, as has been reported for some countries, e.g. Wineman and Jayne (Citation2017) for Tanzania, and Chamberlin et al. (Citation2020) for Zambia), and/or migrants from remote areas are obtaining less remunerative employment than those from more accessible areas (which might be the case if large urban destinations are less accessible to migrants from more remote areas).
5. Conclusions
Understanding and engaging with rural youth in the context of sub-Saharan Africa’s development has become a major theme in policy-oriented discussion in recent years (Filmer & Fox, Citation2014; Fox, Citation2016). However, much of the discussion to date has been carried out in the absence of robust and comparable empirical evidence about how young Africans are actually engaging in the region’s rural economies. As a consequence, many of the stylised assertions about young people in Africa that are found in policy documents and related literature, are not well founded empirically (e.g. see Sumberg & Hunt, Citation2019, on poorly founded claims about youth innovativeness). One objective of this article is to summarise new empirical evidence around ways in which young Africans have been engaging with different aspects of the rural economy in recent years, using comparable indicators from recent, nationally representative household survey data. In so doing, one of our aims has been to evaluate the implied and explicit assumptions and claims about Africa’s youth rural and their economic engagement.Footnote5
While agriculture remains the dominant economic activity in rural Africa, the rural non-farm economy represents an important set of opportunities for the region’s rural young people. However, young people do not charge out of the starting gates into non-farm work: rates of wage employment and non-farm business activities do not peak until individuals are in their 30s in many countries, and the shares of individuals reporting no economic activity is generally the largest for 20- to 30-year-olds. This suggests that there may be important barriers to non-farm work that take time for school-leavers to overcome.Footnote6 Another important conclusion from these findings is a caution against overly dogmatic definitions of youth: while participation rates in the non-farm sector suggest that this dimension of rural economic transformation is driven by relatively young people, it is not driven by those in the 15–24 age range used by the UN and many other organisations as the primary filter for organising information about ‘young people’.
A key finding of our work is that context matters when considering the livelihood choices and economic options which are available to rural (young and non-young) people. Using a simple framework, we show that the economic opportunities in which young people engage are strongly conditioned by economic geography: in relatively more accessible areas, people are more likely to have non-farm work, are more likely to work full time, and the breadth of job types and employment sectors is larger, relative to more remote areas. Because the region’s young people are distributed across heterogeneous economic landscapes, the structure of opportunities available to them varies accordingly. For a large number of young people in remote rural areas, economic opportunities appear to be quite limited, at least at present.Footnote7 Such a spatial differentiation of opportunities for economic engagement is often missing in discussions of youth employment and economic engagement by African youth, which often treat rural youth as a homogeneous category facing the same generic set of opportunities and challenges (e.g. AGRA, Citation2015).
Importantly, these spatial patterns of economic opportunity are not unique to young people: the labour allocation patterns of older people vary in much of the same way across economic space. This point underscores the fact that the investments and policy interventions which may most benefit young people may not be those that target young people per se, but rather those which increase the overall economic potential of different areas, through improvements in infrastructure and access, or other traditional focal points of rural investment strategy, or which lower the barriers to labour mobility, including rural-rural movement into areas with the greatest opportunities.
Acknowledgements
The authors gratefully acknowledge comments from Aslihan Arslan, David Tschirley, Paul Winters, Constanza Di Nucci, Rui Benfica, Marjoke Oosterom, Justin Flynn, Barbara Crossouard, Dorte Thorsen, Mairead Dunne, Rachel Sabates-Wheeler, Seife Ayele, Catherine Gatundu, Victor Manyong and two anonymous reviewers. All data compiled for this paper will be made available upon request.
Disclosure statement
No potential conflict of interest was reported by the authors.
Additional information
Funding
Notes
1. The LSMS-ISA data have provided the basis for much recent analysis of rural household livelihoods, production and input use decisions in sub-Saharan Africa (Aguilar, Carranza, Goldstein, Kilic, & Oseni, Citation2015; Coromaldi, Pallante, & Savastano, Citation2015; Doss, Kovarik, Peterman, Quisumbing, & van den Bold, Citation2015; Jones, Shrinivas, & Bezner-Kerr, Citation2014; Karamba & Winters, Citation2015; Kidoido & Korir, Citation2015; McCarthy & Kilic, Citation2015; Oseni, Corral, Goldstein, & Winters, Citation2015; Slavchevska, Citation2015); Sheahan and Barrett (Citation2017); Palacios-Lopez et al. (Citation2017)
2. All of these surveys are in fact georeferenced, although not all of the publicly accessible datasets have the geographic coordinates and/or ancillary geographic variables included.
3. We tested a number of alternative measures and settled on the 1000 persons/km2 threshold because of distribution of such estimates in our datasets, which suggested that a large share of households in both urban and rural enumeration areas were in relatively high-density areas. As an example, 29 per cent of all individuals in the 2013 Tanzanian data were located in areas with densities greater than 1000 persons/km2, including 12.5 per cent of individuals in nominally rural areas. Population density measures were assigned to survey locations by the World Bank and distributed as part of the dataset. The source of these data is the WorldPop database (http://www.worldpop.org.uk/) which models the spatial distribution of population for the year 2010 within official reporting units (e.g. districts) on the basis of gridded covariates (see methods described in Stevens et al., Citation2015). In any case, the resulting distinction does not seem to matter much in practical terms: if we lower the threshold from 1000 to 300 persons/km2, we find only small differences in our resulting sample size (e.g. a 5% reduction in the sample of working-aged individuals in Tanzania) and negligible differences in the summary statistics calculated in this analysis.
4. However, these indicators may still not be free of errors and comparable across countries.
5. As an aside, we may note that the language used to describe labour engagement outcomes observed in survey data often represents these outcomes as being the result of ‘choices’ or ‘decisions’. While this is certainly true at one level, such choices are invariably constrained, and failure to acknowledge this may result in overly generous assessments of rural people’s agency in determining their economic outcomes. We would not want to suggest that the landscape of rural opportunity is like the stocked shelves of a sweet shop, with young people expressing their preferences by freely choosing to farm, choosing to engage in wage labour, and/or choosing to migrate. An alternative view, to which we subscribe, is that circumstances and life events, including parents’ economic activities, experience in school and childhood experiences of work, strongly channel young people towards some economic activities and away from others. While addressing such conditioning factors is beyond the scope of this paper, it would be a useful focus of further research and would add nuance to the results with present here.
6. An alternative explanation is that very young people have different priorities in term of their livelihood building, e.g. bearing children, or looking for further schooling/training opportunities.
7. As a postscript to this work, we note that the current COVID-19 pandemic is likely to have important further implications for the opportunities available to African youth, at least in the short term. While the specific impacts of the pandemic are still unfolding, it seems clear that economic opportunities for youth in both farm and non-farm sectors will be affected in spatially differentiated ways. Informal non-farm employment in urban areas may be the hardest hit, and will affect the work prospects for urban youth, as well as incentives for rural youth to migrate from rural areas. However, there is also consensus that farm activities in rural areas will be negatively impacted as value chains are disrupted in the short term, and demand for agricultural products diminishes with falling incomes by the urban poor and middle classes. These forces will likely mean fewer off-farm opportunities where they currently exist and will also reduce the scope of relying on agriculture to generate income.
References
- AGRA. (2015). Africa agriculture status report 2015: Youth in agriculture in Sub-Saharan Africa. Nairobi: Alliance for Green Revolution in Africa.
- Aguilar, A., Carranza, E., Goldstein, M., Kilic, T., & Oseni, G. (2015). Decomposition of gender differentials in agricultural productivity in Ethiopia. Agricultural Economics, 46, 311–334.
- Allan, W. (1965). The African Husbandman. London: Oliver & Boyd.
- Andersson Djurfeldt, A., Kalindi, A., Lindsjö, K., & Wamulume, M. (2019). Yearning to farm – Youth, agricultural intensification and land in Mkushi, Zambia. Journal of Rural Studies, 71, 85–93.
- Arslan, A., Tschirley, D., & Egger, E.-M. (2020). Rural youth welfare along the rural-urban gradient: An empirical analysis across the developing world. Journal of Development Studies This issue..
- Berckmoes, L., & White, B. (2014). Youth, farming and precarity in rural Burundi. European Journal of Development Research, 26(2), 190–203.
- Bezu, S., & Holden, S. (2014). Are rural youth in Ethiopia abandoning agriculture? World Development, 64, 259–272.
- BMZ. (2017). One world - No hunger: Future of the Rural World International G20 Conference, Berlin, 27–28 April 2017. Bonn: Author.
- Bryceson, D. F. (2002). The scramble in Africa: Reorienting rural livelihoods. World Development, 30(5), 725–739.
- Bryceson, D. F., & Jamal, V. (1997). Farewell to farms: De-agrarianisation and employment in Africa. Aldershot: Ashgate.
- Chamberlin, J., Jayne, T. S., & Sitko, N. J. (2020). Rural in‐migration and agricultural development: Evidence from Zambia. Agricultural Economics, 51(4), 491–504. https://doi.org/10.1111/agec.12567 doi:10.1111/agec.v51.4
- Chamberlin, J., Pender, J., & Yu, B. (2006). Development domains for Ethiopia: Capturing the geographical context of smallholder development options. Washington, DC: International Food Policy Research Institute.
- Collinson, M. (2000). FSR – Understanding farming systems. 3.2 Evolving typologies for agricultural R&D, Chapter 3. In M. Collinson (Ed.), A history of farming systems research (pp 51–58). Wallingford: CABI.
- Coromaldi, M., Pallante, G., & Savastano, S. (2015). Adoption of modern varieties, farmers’ welfare and crop biodiversity: Evidence from Uganda. Ecological Economics, 119, 346–358.
- Davis, B., Di Giuseppe, S., & Zezza, A. (2017). Are African households (not) leaving agriculture? Patterns of households’ income sources in rural Sub-Saharan Africa. Food Policy, 67, 153–174.
- Dillon, B., Brummund, P., & Mwabu, G. (2019). Asymmetric non-separation and rural labor markets. Journal of Development Economics, 139, 78–96. https://doi.org/10.1016/j.jdeveco.2018.12.008
- Djido, A. I., & Shiferaw, B. A. (2018). Patterns of labor productivity and income diversification–Empirical evidence from Uganda and Nigeria. World Development, 105, 416–427. https://doi.org/10.1016/j.worlddev.2017.12.026
- Dolislager, M., Reardon, T., Arslan, A., Fox, L., Sauer, C., Liverpool-Tasie, S., & Tschirley, D. (2020). Youth and adult agrifood system employment in developing regions: Rural (peri-urban to hinterland) vs. urban. Journal of Development Studies This issue.
- Doss, C., Kovarik, C., Peterman, A., Quisumbing, A., & van den Bold, M. (2015). Gender inequalities in ownership and control of land in Africa: Myth and reality. Agricultural Economics, 46, 403–434.
- Dzanku, F. M. (2019). Food security in rural sub-Saharan Africa: Exploring the nexus between gender, geography and off-farm employment. World Development, 113, 26–43.
- Ellis, F. (2000). Rural livelihoods and diversity in developing countries. Oxford: Oxford University Press.
- FAO, CTA and IFAD. (2014). Youth and agriculture: Key challenges and concrete solutions. Rome: Food and Agriculture Organization of the United Nations (FAO) in collaboration with the Technical Centre for Agricultural and Rural Cooperation (CTA) and the International Fund for Agricultural Development (IFAD).
- Filmer, D., & Fox, L. (2014). Youth employment in sub-Saharan Africa. Washington, DC: Agence Française de Développement and World Bank.
- Fox, L. (2016). What will it take to meet the Youth Employment Challenge in Sub‐Saharan Africa?. GLM/LIC Synthesis Paper No, 2. Growth, Gender and Labour Markets in Low-Income Countries Programme. Institute of Labor Economics (IZA) and the UK Government Department for International Development (DFID). IZA, Bonn, Germany.
- Fox, L., & Kaul, U. (2017). The evidence is in: How should youth employment programs in low-income countries be designed? Washington, DC: USAID.
- Glover, D., Sumberg, J. and Andersson, J. (2016). The Adoption Problem, or why we still understand so little about technological change in African agriculture. Outlook on Agriculture, 45(1), 3–6 https://doi.org/10.5367/oa.2016.0235
- Haggblade, S., Hazell, P., & Reardon, T. (2007). Transforming the rural nonfarm economy: Opportunities and threats in the developing world. Baltimore: Johns Hopkins University Press.
- Hildebrand, P. E., Singh, B. K., Bellows, B. C., Campbell, E. P., & Jama, B. A. (1993). Farming systems research for agroforestry extension. Agroforestry Systems, 23(2–3), 219–237.
- IFAD. (2016). Rural development report 2016: Fostering inclusive rural transformation. Rome: International Fund for Agricultural Development.
- IFAD. (2019). Creating opportunities for rural youth: 2019 rural development report. Rome: Author.
- Jayne, T. S., Chamberlin, J., & Benfica, R. (2018). Africa’s unfolding economic transformation. Journal of Development Studies, 54(5), 777–787.
- Jiitzold, R., & Kutsch, H. (1982). Agro-ecological zones of the tropics, with a sample from Kenya. Der Tropenlandwirt, Zeitschrift fur die Landwirtschaft in den Tropen und Subtropen, 83, 15–34.
- Jones, A. D., Shrinivas, A., & Bezner-Kerr, R. (2014). Farm production diversity is associated with greater household dietary diversity in Malawi: Findings from nationally representative data. Food Policy, 46, 1–12.
- Karamba, R. W., & Winters, P. C. (2015). Gender and agricultural productivity: Implications of the farm input subsidy program in Malawi. Agricultural Economics, 46, 357–374.
- Kidoido, M., & Korir, L. (2015). Do low-income households in Tanzania derive income and nutrition benefits from dairy innovation and dairy production? Food Security, 7, 681–692.
- Kosec, K., Ghebru, H., Holtemeyer, B., Mueller, V., & Schmidt, E. (2018). The effect of land access on youth employment and migration decisions: Evidence from rural Ethiopia. American Journal of Agricultural Economics, 100(3), 931–954.
- Leavy, J., & Hossain, N. (2014). Who wants to farm? Youth aspirations, opportunities and rising food prices. IDS Working Paper 439. Brighton: Institute of Development Studies.
- Mabiso, A., & Benfica, R. (2019). The narrative on rural youth and economic opportunities in Africa: Facts, myths and gaps. IFAD Research Series 61. Rome: IFAD.
- McCarthy, N., & Kilic, T. (2015). The nexus between gender, collective action for public goods and agriculture: Evidence from Malawi. Agricultural Economics, 46, 375–402.
- McCullough, E. B. (2017). Labor productivity and employment gaps in Sub-Saharan Africa. Food Policy, 67, 133–152. https://doi.org/10.1016/j.foodpol.2016.09.013
- Mueller, V., & Thurlow, J. (Eds). (2019). Youth and jobs in Rural Africa: Beyond stylized facts. Oxford: Oxford University Press.
- Oseni, G., Corral, P., Goldstein, M., & Winters, P. (2015). Explaining gender differentials in agricultural production in Nigeria. Agricultural Economics, 46(3), 285–310.
- Palacios-Lopez, A., Christiaensen, L., & Kilic, T. (2017). How much of the labor in African agriculture is provided by women? Food Policy, 67, 52–63.
- Pender, J., Jagger, P., Nkonya, E., & Sserunkuuma, D. (2004). Development pathways and land management in Uganda. World Development, 32(5), 767–792.
- Pender, J., Place, F., & Ehui, S. (2006). Strategies for sustainable land management in the East African highlands. Washington, DC: International Food Policy Research Institute.
- Pesaresi, M., & Freire, S. (2016). GHS Settlement grid following the REGIO model 2014 in application to GHSL Landsat and CIESIN GPW v4-multitemporal (1975-1990-2000-2015). European Commission, Joint Research Centre (JRC).
- Reardon, T., Berdegué, J., Barrett, C. B., & Stamoulis, K. (2007). Household income diversification into rural nonfarm activities. In S. Haggblade, P. Hazell, & T. Reardon (Eds.), Transforming the rural nonfarm economy: Opportunities and threats in the developing world (pp. 115–140). Baltimore: John Hopkins University Press.
- Ripoll, S., Andersson, J., Badstue, L., Büttner, M., Chamberlin, J., Erenstein, O., & Sumberg, J. (2017). Rural transformation, cereals and youth in Africa: What role for international agricultural research?. Outlook on Agriculture, 46(3), 168–177. https://doi.org/10.1177/0030727017724669
- Rutherberg, H. (1971). Farming systems in the Tropics. Oxford: Clarendon Press.
- Sheahan, M., & Barrett, C. B. (2017). Ten striking facts about agricultural input use in sub-Saharan Africa. Food Policy, 67, 12–25.
- Slavchevska, V. (2015). Gender differences in agricultural productivity: The case of Tanzania. Agricultural Economics, 46(3), 335–355.
- Sombroek, W. G., Braun, H. M. H., & van der Pouw, B. J. A. (1982). Exploratory soil map and agro-climatic zone map of Kenya, 1980. Scale: 1:1ʹ000ʹ000. Exploratory Soil Survey Report No. E1. Kenya Soil Survey. Nairobi, Kenya: Ministry of Agriculture, National Agricultural Laboratories.
- Stevens, F. R., Gaughan, A. E., Linard, C., & Tatem, A. J. (2015). Disaggregating census data for population mapping using random forests with remotely-sensed and ancillary data. PloS one, 10(2), e0107042.
- Sumberg, J., & Hunt, S. (2019). Are African rural youth innovative? Claims, evidence and implications. Journal of Rural Studies, 69, 130–136.
- Tadele, G., & Gella, A. A. (2012). ‘A last resort and often not an option at all’: Farming and young people in Ethiopia. IDS Bulletin, 43(6), 33–34.
- The World Bank. (2009). Awakening Africa’s sleeping giant: Prospects for commercial agriculture in the Guinea Savannah zone and beyond. Washington, DC: Author.
- Van den Broeck, G., & Kilic, T. (2019). Dynamics of off-farm employment in sub-Saharan Africa: A gender perspective. World Development, 119, 81–99.
- Wardrop, N. A., Jochem, W. C., Bird, T. J., Chamberlain, H. R., Clarke, D., Kerr, D., … Tatem, A. J. (2018). Spatially disaggregated population estimates in the absence of national population and housing census data. Proceedings of the National Academy of Sciences of the United States of America, 115, 3529–3537.
- Weiss, D. J., Nelson, A., Gibson, H. S., Temperley, W., Peedell, S., Lieber, A., ... & Mappin, B. (2018). A global map of travel time to cities to assess inequalities in accessibility in 2015. Nature, 553(7688), 333–336.
- Wiggins, S., & Proctor, S. (2001). How special are rural areas? The economic implications of location for rural development. Development Policy Review, 19(4), 427–436.
- Wineman, A., & Jayne, T. S. (2017). Intra-rural migration in Tanzania and pathways of welfare change. FSP Research Paper 60. Feed the Future Innovation Lab for Food Security (FSP), Michigan State University, East Lansing.
- Yeboah, F. K., & Jayne, T. S. (2018). Africa’s evolving employment trends. Journal of Development Studies, 54(5), 803–832.
- Yeboah, T., Chigumira, E., John, I., Anyidoho, N. A., Manyong, V., Flynn, J., & Sumberg, J. (2020). Hard work and hazard: Young people and agricultural commercialisation in Africa. Journal of Rural Studies, 76, 142–151.