
 ?Mathematical formulae have been encoded as MathML and are displayed in this HTML version using MathJax in order to improve their display. Uncheck the box to turn MathJax off. This feature requires Javascript. Click on a formula to zoom.
Abstract
This paper examines the short-term impact of better access to improved water available at newly built boreholes on children’s health, schooling, and time allocation in rural Zambia. We employed a difference-in-differences estimation using a dataset collected under a quasi-experimental setting. We observed significant effects of better access to improved water sources on the reduced incidence of diarrhea for pre-school children but not for school-age children. We found no significant effect on school attendance. To understand the mechanism behind this pattern, we examined any changes in time use by children who had better access to improved water sources. For girls, particularly those who lived near the boreholes, we found a significant decrease in time spent on schooling and homework and a significant increase in time spent on water-related household chores including fetching water. We did not find any significant changes for boys. Alongside a significant decrease in time spent on water-related chores by female adults, better access to improved water supply shifts the burden of water-related household chores from female adults to girls while the net burden of water collection alone for girls was unchanged.
1. Introduction
This paper examines the short-term impacts on children of better access to improved water at newly built boreholes within rural villages in terms of the incidence of waterborne diseases, schooling, and the use of time in northern Zambia.
Access to improved water is a basic need for all people and forms an essential part of improving their well-being. The United Nations Sustainable Development Goals (SDGs) aim to ‘ensure access to water and sanitation for all’ by 2030 (Goal 6) and call for the achievement of universal and equitable access to safe and affordable drinking water for all (Goal 6.1) (United Nations, Citationn.d.). However, the situation in 2020 is far below the goal and is particularly unsatisfactory in rural areas. In 2017, 579 million people globally did not have access to water from improved sources, while 80 per cent of those without even basic drinking water services (safely managed or basic water services) lived in rural areas (United Nations Children’s Fund [UNICEF] & World Health Organization [WHO], Citation2019).
Access to improved water is most limited in sub-Saharan African countries. According to UNICEF and WHO (Citation2019), the proportion of people in this area enjoying basic drinking water or above increased from 46 per cent in 2000 to 61 per cent in 2017, but this was still below the worldwide average of 90 per cent. Worldwide, 207 million people still used sources where the process of water collection exceeded 30 min per day in 2017, with 135 million of these living in sub-Saharan countries. Only 45 per cent of people in rural areas in these countries have access to at least basic water facilities, far below the 84 per cent in urban areas (UNICEF & WHO, Citation2019).
The adverse effect of lacking access to improved water sources is disproportionally concentrated on children. First, lack of access to improved water sources is a major cause of waterborne diseases, which can be deadly to children. Indeed, nearly 1000 children die every day due to preventable water and sanitation-related diarrheal diseases (United Nations, Citationn.d.). Second, children are often forced to carry heavy loads when collecting water (Graham, Hirai, & Kim, Citation2016). Third, the high prevalence of diarrhea and the heavy burden of water collection may have a negative effect on schooling outcomes (Nauges & Strand, Citation2017), together with poverty, imperfect capital markets, lack of access to school, and low quality of education (Jensen & Nielsen, Citation1997; Roby, Erickson, & Nagaishi, Citation2016). In 2018, 258 million school-age children were not in school, and 38 per cent of these were concentrated in sub-Saharan African countries (UNESCO, Citation2020).
This study provides new evidence about the short-term and extensive impact of better access to improved water from newly built boreholes on children’s livelihoods in terms of health, schooling, and their use of time in rural Zambia. We build on three strands of the literature. The first strand is the large volume of evidence on the effect of access to improved water sources on health. These studies have not reached a consensus on whether any improvement of water sources has a positive impact on the quality of the water used or on the health of the target population (Kremer, Leino, Miguel, & Zwane, Citation2011; Pickbourn & Ndikumana, Citation2019; Waddington & Snilstveit, Citation2009; Wayoro & Ndikumana, Citation2020; Wright, Gundry, & Conroy, Citation2004; Zwane & Kremer, Citation2007). These studies consistently show that improvement of water quality at point of use is generally effective in reducing waterborne diseases (Arnold & Colford, Citation2007; Clasen et al., Citation2015; Fewtrell et al., Citation2005; Gundry, Wright, & Conroy, Citation2004; Fewtrell et al., Citation2005; Arnold & Colford, Citation2007; Waddington & Snilstveit, Citation2009). These two findings imply that access to improved water sources enhances water quality at the point of collection but may not change it at the point of use. The quality of the water deteriorates between the points because of recontamination due to the mishandling of improved water sources (Fewtrell et al., Citation2005; Günther & Schipper, Citation2013) or the mixed use of water of unknown quality (Kremer et al., Citation2011).
The second group of previous related studies examines the impact of access to improved water sources on educational outcomes. Better access to water sources may help to improve children’s school attendance by reducing the number of those who suffer from waterborne diseases. Furthermore, better access to improved water sources may gain time that can be used for prolonged schooling for girls since female children are more likely to be responsible for water collection than male children (Graham, Hirai, & Kim, Citation2016; Ray, Citation2007; Sorenson, Morssink, & Campos, Citation2011). While Koolwal & van de Walle (Citation2013) found a positive correlation between school enrolment and time reduction of traveling to water sources for both boys and girls in non-African countries,Footnote1 Devoto et al. (Citation2012) found that private connection to the public water system did not have any impact on school completion, on the intensive margin of schooling, or on time spent on homework, but the increased time saved was spent on leisure. Gross, Günther, and Schipper (Citation2018) also showed little impact of public water provision on schooling because the time saving from better access to water sources was small and suggested that boys, not girls, are more likely to go to school in this situation.
The third strand of the relevant literature is on the time burden in fetching water.Footnote2 Better access to improved water may reduce the distance from the house to water sources. The shortened distance, nonetheless, does not necessarily lead to a reduction in time spent on collecting water. In fact, there is a smaller volume of empirical literature on the impact of improved access to water sources on the water collection time. Most studies in sub-Saharan African countries use cross-sectional data on a limited number of villages and show that the estimated time saving by better access to water sources ranges widely from 30 to 300 min (Bevan, Collier, & Gunning, Citation1989; Blum et al., Citation1990; Cairncross & Cliff, Citation1987).
Two recent papers use longitudinal data to examine the time-saving effect rigorously. Using an experimental design, Devoto et al. (Citation2012) examined the impact of private piped water connections to the water mains in Morocco’s urban areas and found that 27 min were saved per day if households switched from a public to a private connection. Gross et al. (Citation2018) found that the provision of new public water points saved 41 min per day for water collection activities on average in rural Benin. These estimates are among the lowest among previous studies, partly because the reduced distance to water sources motivated households to increase their water requirements, necessitating additional trips to the water source.Footnote3
This study examines the impact on children under age 18 of a groundwater development project to provide better access to improved water that is free from contamination in rural Zambia. In line with Devoto et al. (Citation2012) and Gross et al. (Citation2018) we use longitudinal data to analyze better access to improved water sources by children. We employ a difference-in-differences estimation using a dataset collected under a quasi-experimental setting. Since the interval of our longitudinal dataset is one year and the period of use of new boreholes averages six months, we aim to capture the short-term impact of better access to improved water sources.
In this study, we add new insights in three ways. First, we examine the impact of better access to improved water from newly constructed boreholes whose depth is approximately 60 meters. There is no concern about the water quality at source, and we therefore exclude the possibility that our results are susceptible to potential contamination at source, including Escherichia coli (E. coli). To the best of our knowledge, most previous studies do not provide evidence on the impact of completely uncontaminated water confirmed by a variety of quality tests.
Second, we consider the distance from the house to water sources using information on the location of each household, a factor that has largely been ignored in other studies. Naturally, the impact of access to improved water sources may differ across households at different locations. We measure the distance from the house to water sources in terms of physical distance and time, which allows us to examine the burden of water collection in a more subtle way.
Third, we employ a time use survey to explore any possible change in time allocation on a variety of activities. We utilize an exhaustive timetable for the entire day to investigate the mechanism of the impact of better access to improved water sources on time allocation by children.
This paper proceeds as follows. The next section describes the target project and our research design. Section 3 illustrates the dataset. Section 4 explains our empirical strategy. Section 5 presents the estimation results and discusses the findings. Section 6 provides our conclusions and offers some considerations for future studies.
2. Background and context
Zambia is a landlocked sub-Saharan African country whose population was 17 million in 2019. As is the case with surrounding countries, expanding the coverage of water supplies in Zambia is considered one of the most important policy challenges for the community. In 2015, 67.7 per cent of households had access to improved sources of drinking water, a slight improvement on 62 per cent in 2010, but there was a wide regional variation between urban (89.2%) and rural areas (51.6%) (Central Statistical Office, Republic of Zambia, Citation2016).
We focus on Luapula Province as a case study of rural Zambia, which is located in the northern territory and has a population of one million living in an area of 30 thousand square kilometers. Luapula Province is economically isolated from the rest of the country and the poverty rate in 2010 was 80.5 per cent, the highest among the provinces. By 2015, it had worsened to 81.1 per cent, the second highest in the country (Central Statistical Office, Republic of Zambia, Citation2016). Geographically, more than 40 per cent of Luapula Province is occupied by lakes and wetland areas (Japan International Cooperation Agency [JICA], Citation2014). Despite these rich water sources, the proportion of people with access to improved water sources was the second lowest among the provinces, only 30.7 per cent in 2010, but had substantially improved to 52.9 per cent by 2015, which is close to the average among rural areas (Central Statistical Office, Republic of Zambia, Citation2016).
Diarrhea is among the top ten major causes of morbidity in Zambia, and a higher incidence has been observed in more recent years (Ministry of Health, Republic of Zambia, Citation2014). There is a growing concern that a lack of access to improved water sources is a major cause of waterborne diseases, including diarrhea. The average national diarrhea incidence per 1000 population increased from 7.9 per cent in 2010 to 8.6 per cent in 2012, while the hospital case fatality rates for diarrhea (non-bloody) slightly decreased from 74 deaths per 1000 admissions to 65 during the same period. For children under age 5, the case fatality rates for children under age 5 decreased from 78 to 49 deaths. Turning to Luapula, the incidence of diarrhea increased from 6.0 per cent in 2010 to 8.3 per cent in 2012, slightly below the national average. The hospital case-fatality rates deteriorated from 54 deaths (60 deaths for children under age 5) per 1000 admissions in 2010 to 69 deaths (62 deaths for children under age 5) in the same period (Ministry of Health, Republic of Zambia, Citation2014). The proportion of individuals reporting diarrhea without blood during the two weeks was 2.2 per cent for those aged 0–4 and 5–9, and 1.8 per cent for those aged 10–14 (Central Statistical Office, Republic of Zambia, Citation2016).
The national average school attendance rate in Zambia in 2015 was 29.8 per cent for pre-primary school-age children, 83.1 per cent for primary school age, and 75.7 per cent for secondary school age, followed by 29.4 per cent for a higher education age (Central Statistical Office, Republic of Zambia, Citation2016). There is a large disparity in school attendance between rural and urban areas.Footnote4 We observed a gap in school attendance by gender. The school attendance rate at primary school was 81.3 per cent for boys, which was smaller than girls (84.8%), while the rate was higher for boys beyond the primary school level (78.4% for boys and 73.4% for girls in secondary and 36.3% for boys and 22.5% for girls in higher education). School attendance in Luapula was lower than the average in other rural areas in Zambia: 70.9 per cent for primary school age, 72.4 per cent for secondary school age, and 25.4 per cent for higher-level education.
3. Research design and data description
3.1. Research design
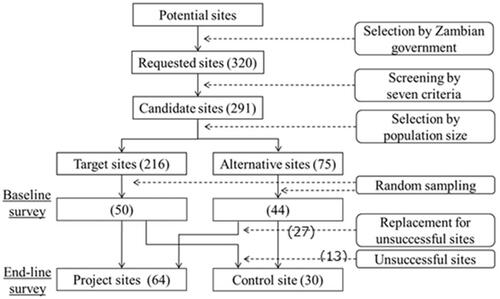
The target project in this study is the second phase of the grant aid project for groundwater development by the Japan International Cooperation Agency (JICA) conducted in four districts of Luapula province: Nchelenge, Mwense, Mansa, and Milenge.Footnote5 The project constructed borehole water supply facilities with hand pumps between February 2012 and May 2013 (). The target sites were selected from among 320 sites in the four districts specified by the Government of Zambia and 291 sites were examined. From these, 216 sites were selected as target sites for this project, and the remaining 75 sites served as alternatives when drilling was unsuccessful at target sites because there was still a risk of failing to find underground water. In the end, the project constructed 216 facilities at 214 sites, but 31 target sites were replaced because it was impossible to obtain groundwater even after two drillings ().
Figure 1. Timeline of the project. Source: JICA (Citation2014).
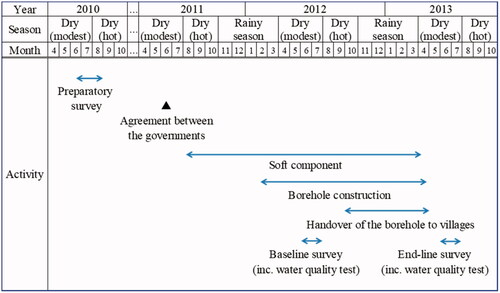
Figure 2. Procedure of site selection and sampling. Source: JICA (Citation2014).
A distinctive feature of the facilities in the project is that the water was not contaminated at the source, at least on completion, and thus the examination results in this study would be unaffected by any potential contamination at source. Before the boreholes were handed over to villagers, it was confirmed that the quality of water passed a variety of tests, including electrical conductivity, pH, iron, manganese, and fluorine content, in addition to the amount of E. coli.
The data used in this study consists of the results of two rounds of surveys. The first round (baseline) was conducted from June–July 2012, and the second round (end-line) was conducted from June–August 2013. Both surveys were implemented in the dry season (April–October) within a mostly no rain period (June–August) because it is practically impossible to travel on roads in the project area in the rainy season (JICA, Citation2014).Footnote6
The survey was conducted in three districts (Milenge, Mwense, and Nchelenge).Footnote7 At the baseline survey, in Milenge District, 14 target sites were randomly selected from the list of villages where the project was to be implemented as a treatment group. Then, from the list of villages where the project was not to be implemented, 12 control sites were purposefully selected as a control group by examining the demographic and socio-economic conditions of the villages so that we could have treatment and control groups with similar underlying attributes. The total number of sample sites in Milenge was 26. In addition, 19 target sites and 17 control sites were selected in Mwense District (36 in total), and 17 target sites and 15 control sites were selected in Nchelenge District (32 in total). The total in the sample was 94 sites, each of which was in a different village. Hence, each village corresponds to each site.
However, the project was not able to obtain water from new boreholes at some target sites because they did not strike water-bearing strata; it is difficult to predict the possibility of obtaining water successfully when blind-boring. Those sites without water can also be regarded as control sites at the end-line survey, and new sites were converted from control sites into target sites where it was possible to get water from new boreholes. After those conversions, we ended up with 21 ‘project sites’ with water access and five control sites without water access in Milenge, 24 project sites and 12 control sites in Mwense, and 18 project sites and 14 control sites in Nchelenge. The conversions resulting from the unexpected failures eventually created an ideal situation for impact evaluation because we could regard this situation as being one where construction of the new borehole had been randomly assigned to the project sites.
For the baseline survey in each sampled village, eight households were randomly selected, and thus 752 households in total across the 94 sites were interviewed. From the sample, 117 households (15.6% of the total) were excluded and could not be revisited in the end-line survey. The total number of households that were surveyed both at baseline and end-line was 635.Footnote8 After excluding six households for which important variables were missing or likely to be outliers, the number of effective households for our analysis was 629 (424 in the treatment group and 205 in the control group).
There are two points to note regarding the interval of two rounds of the survey. The first point is that the interval is short (only one year), which enabled us to examine the short-term impact of better access to improved water sources on a variety of outcomes. The second point is that no facilities were available at the timing of the first survey. Those facilities were constructed between February 2012 and April 2013 and villagers started to use the first facilities in October 2012. Villagers living around different sites started to use them at different times and the period for using new facilities in the project sites averaged six months (varying from two months to ten months). In the project sites, almost 80 per cent of the sampled households used the boreholes, and the distance between household and borehole ranged from 1 meter to 1 kilometer (the median is 100 meters).
Both rounds of the survey employed household and community questionnaires, and these contained a wide variety of socio-economic variables of individuals, households, and communities. The same questionnaire was used in both surveys with minor revisions after another pre-test in the end-line survey. The survey revealed three distinct features. First, access to existing water sources outside houses was confirmed by both community and household questionnaires. The community questionnaire checked the presence of existing water sources in the community and also their accessibility, while the household questionnaire asked respondents to provide information about the distance from their house to each water source and the practice of fetching water per day from each water source for the day before the interview.
Second, the household questionnaire collected information about episodes of illness/injury for each individual family member over the past 30 days, as well as any diarrhea-related symptoms over the past two weeks and over the past 30 days.
Third, the survey collected detailed use of time information and asked respondents to fill in a timetable for an entire day according to 18 types of activities.Footnote9 The time use survey allowed us to measure the time spent on a variety of activities, including that spent collecting water, and to understand the impact of better access to improved water sources on behavioral changes in children.
shows a balance test of the main outcome variables between the project sites and control sites at the baseline survey. Although there was a slight difference in the distance to the closest water source, we do not see any statistical differences in the practice of water collection in terms of water volume per day (one day before the interview) or the number of trips over the previous week. We also see no difference in diarrhea incidence for either pre-school or school-age children. While there is no significant difference in school attendance for girls, the proportion is higher for boys in the project sites. Moreover, we see statistical differences on time allocation in some activities. Girls in the project sites spent fewer hours fetching water and cooking but spent more hours on other household chores and traveling/walking/commuting. Boys in the project sites spent less time on cooking, social activities, eating/drinking, and sleeping but spent more time traveling/walking/commuting.
Table 1. The main outcome variables (baseline)
4. Empirical strategy
This study employs a difference-in-differences (DID) approach to estimate the impact of the project. The DID methodology combines before/after and with/without comparisons. The central assumption for the DID methodology to be valid is the ‘parallel trend.’ We assume that any change between baseline and end-line surveys without the intervention caused by unobserved characteristics is common between the project and control sites. Under the ‘parallel trend’ assumption, the DID methodology can identify the impact of the project by subtracting the common trends from the change at the project sites.
We performed a balance test of the observed characteristics between the project and control sites at the baseline survey (see Appendix A). It is desirable for the parallel trend assumption that people in both sites live in similar circumstances before the project starts. We confirmed that there was no statistically significant difference in the characteristics between the project and control sites, with the only exception being longer years of schooling among working age women in the project sites. We also conducted a balance test of village-level characteristics between the project and control sites. The project sites might have larger populations than the control sites because one of the most important criteria for a village to be a target site is its population, which determines the demand for water. However, we found no significant difference in population between the project and control sites.Footnote10 Thus, we judged the initial conditions of the project and control sites in our dataset to be well balanced.
We examined the impact of the project on the practices of water collection, the incidence of diarrhea and school attendance, and the use of time spent on specific activities. The basic specification is as follows:
(1)
(1)
where: i refers to a household (or individual), j points to a site (or village), and t is time (t = 0 for baseline and t = 1 for end-line). Yijt is the dependent variable and takes four forms: First, Yijt is a continuous variable of the distance to the closest water source, water volume in liters carried per day, and the number of trips to fetch water over the previous week. Second, Yijt is a binary variable that takes the value of 1 if a child had diarrhea in the past two weeks and 0 otherwise. Third, Yijt is an indicator that takes the value of 1 if a child attends school currently and 0 otherwise. Fourth, Yijt is a continuous variable of time in hours spent on a variety of activities. Turning to the right-hand side variables, Sj is a binary variable that takes the value 1 if the site has a successful borehole and 0 otherwise.
to
are the parameters to be estimated.
is the parameter of our interest and measures the impact of the project on the outcomes.
is an iid error term. We employ an ordinary least squared (OLS) estimation to obtain the coefficients. Since a binary variable is the dependent variable for the incidence of diarrhea and school attendance, our estimation model is a linear probability model (LPM) in these cases.
The ‘parallel trend’ assumption in the DID methodology may be violated if changes in covariates are not common between the project and control sites. Thus, we also employed an empirical model with some covariates since it was necessary to examine whether this was the case. The covariates take two forms: is a vector to include a set of household (individual) characteristics and
is a vector containing a set of site j’s characteristics other than the success of facility construction (Sj).
contains two dummy variables that capture seasonal differences in the survey months, July or August, with reference to June. We included these dummies since school attendance may decline over the course of the year and be affected by the agricultural cycle in the area, even though the surveys were conducted in the same season.
refers to village fixed effects. By adding those covariates, we write another version of our empirical model:
(2)
(2)
where: the notations are the same as in (1) except that
and
are vectors of the parameters to be estimated.
We need to be careful in interpreting the coefficient that measures the impact of the project on the outcomes since not all households in the project used the newly built project boreholes, although the use rate was almost 80 per cent. Thus, those models estimate the intention-to-treat (ITT) impact of the project at the village level. Further, we employ the following specification to consider the difference in the project impact relying on the distance from each house to boreholes in the project sites:
(3)
(3)
where: Di stands for the distance to the newly constructed borehole. Di takes two forms: physical distance in kilometers and time t taken in minutes. All the regression models in the following section control for the covariates at the individual, household, and village level. In addition, we replace the term
with village fixed effects because each village corresponds to each site. All standard errors are clustered at the village level.
5. Estimation results and discussion
presents the estimation results for the impact of the project on the distance to the closest water source, the total volume of water carried from various sources, and the number of trips made to fetch water at the household level.Footnote11 We focus on the coefficients of our interest: the interaction term between project sites and the year dummy (end-line). Column (A) shows that the distance to the closest water source in the project sites becomes shorter by about 150 meters than that in the control sites, thanks to the construction of the new boreholes in the project sites. The larger and significantly negative point estimates near the boreholes in Columns (B) and (C) confirm that the reduction is indeed the impact of the project. Next, Column (D) shows that the point estimate of the impact on the water volume carried per day is positive and close to four and that in Columns (E) and (F) is positive and close to six or seven, although they are statistically insignificant partially because the water volume carried per day is self-reported with large measurement errors. Households in the project sites tended to fetch a larger volume of water per day, and households living near the borehole might carry an even larger volume, whereas the average water carried per day was approximately 60 liters in total.
Table 2. Impact on fetching water (household level)
Similarly, Columns (G) and (H) show that the point estimates of the impact on the number of trips for fetching water in the previous week are positive but insignificant. We found that households living near the borehole on average had made almost four more trips to fetch water in the previous week, which is statistically significant (Column (I)) and large, given that there were about 20 trips per week to fetch water on average. These results show that the distance to the closest water source was shortened and that the demand for improved water from the new boreholes appeared to increase, leading to an increase in the number of trips per week for fetching water.Footnote12
reports the estimation results of the impact on the incidence of diarrhea symptoms over the last two weeks in children. Column (A) shows that the point estimate of the impact is -0.049 and statistically significant, suggesting that the project on average reduced the incidence of diarrhea by 4.9 percentage points for pre-school age children.Footnote13 Columns (B) and (C) report that the point estimates are negative and significant, which are larger than those in Column (A), implying that the impact is larger among households living near the borehole. In contrast, Columns (D) to (F) show that the point estimates are small and not significant for school-age children, implying that the projects did not contribute to a reduction of diarrhea for those children.
Table 3. Impact on incidence of diarrhea symptoms
These results confirm the distinct impact on the reduction of diarrhea by better access to improved water at new boreholes for pre-school children but not for school-age children. This reduction due to access to improved water sources for pre-school children is consistent with the findings of Kremer et al. (Citation2011), for instance, that the protection of spring water significantly reduced diarrhea in children under age 3. We therefore suggest that our positive results can be attributed to the quality of water in the project. The distinctive feature of the project in this study is that water is free from contamination, which contributed to the reduction of the incidence of diarrhea in circumstances where beneficiary households lived within 1 kilometer of the new boreholes, within a short period after handover to residents. Moreover, we need to be cautious in interpreting the non-significance for school-age children. The incidence of diarrhea for those children is much lower than that for pre-school age children, which is coincident with the well-documented literature. However, parents might not know all the symptoms of diarrhea or may have overlooked them while children attended school.Footnote14 In other words, it is possible that the incidence of diarrhea is underreported in school-age children, which might lead to underestimation of the impact.
reports on the estimation results relating to educational outcomes for school-age children. For girls, Columns (A) to (C) show that the point estimates for the impact are negative and insignificant. For boys, Column (D) shows it is negative, and Columns (E) and (F) report that they are positive but not statistically significant. These estimation results suggest that the projects did not stimulate school attendance for either girls or boys. We examined the impact on other schooling outcomes such as educational progression and attendance days and did not find any significant impacts.Footnote15 More than half of the boreholes constructed by the projects were handed over to residents after January, when the academic year started. The average number of months using the new boreholes was six, which may be too short to change children’s behavior towards attending school.
Table 4. Impact on school attendance and time spent on schooling and homework
To understand the mechanism behind no impact on school attendance, we further investigated any changes in time allocation. Columns (G) to (I) report the project impact on time spent on schooling and homework for girls. The point estimates are negative but insignificant in Columns (G) and (I), but the point estimate is -1.188 and statistically significant in Column (H), suggesting that the projects reduced time spent on schooling and homework by more than 1 h per day for girls if they lived near the borehole. For boys, Columns (J) to (L) show that the point estimates are all positive but insignificant, suggesting that the projects did not change time spent on schooling and homework for boys.
reports the impact on the time taken to fetch water. There are two channels if boreholes installed by the project affect school attendance positively. One is improvement of the health status by reducing the incidence of diarrhea, which is not confirmed for school-age children in . The other is the time gained by reducing the time taken to collect water, which is investigated here. For girls, Columns (A) to (C) report that all the point estimates of the impact are positive but insignificant, suggesting that time spent on water collection alone was not affected by the projects. For boys, Columns (D) to (F) report that all the point estimates are positive but insignificant, suggesting that there was no significant impact for boys either. As a result of the construction of boreholes through the project, villagers were able to gain access to improved water sources near their houses. Thus, water collection time per round was reduced compared to the period before the new boreholes were set up. At the same time, with better access, households might increase their demand for the improved water available at the boreholes (). As a result, total time spent fetching water might not decrease because the number of trips to collect water increased.
Table 5. Impact on time spent on fetching water and washing/cleaning/cooking
We now examine the time used on other activities. Columns (G) to (L) report the impact on the total time spent on water-related household chores such as washing clothes, cleaning dishes, and cooking, as well as fetching water. For girls, Columns (G) to (I) report that the point estimates are positive and significant, showing that girls in households in the project sites spent approximately 0.5 more hours per day on water-related household chores. We found that girls in households in the project sites spent about half an hour more per day on water-related household chores, which is statistically significant. For boys, the point estimates in Columns (J) and (K) are positive but they are insignificant, suggesting that the projects did not make any difference to time spent on the water-related household chores for boys. Since girls are more responsible for these activities than boys, these findings are intuitively understandable. Further, showed that the new boreholes constructed by the project reduced the time spent on water-related household chores, including fetching water, by around 0.4–0.5 h among female adults aged between 19 and 70. This shift may reflect a shorter trip to a new borehole and a reduced water collection burden per trip.
Table 6. Impact on time spent by female adults
Lastly, we move to robustness checks of our estimation results. First, we examined how our empirical findings can be affected by attrition since the attrition rate was 15.6 per cent.Footnote16 We analyzed how initial conditions of the sampled households and villages observed at the baseline survey were associated with attrition in the end-line survey by estimating the Probit model and found some systematic patterns that result in attrition. Hence, we employed several bias correction techniques (Wooldridge, Citation2010) such as an inverse probability weighting (IPW) regression and Heckman’s two-step selection model. Nonetheless, our estimates were intact and thus we concluded that our findings are robust against any attrition.Footnote17
Second, a difference-in-differences (DID) approach is notoriously vulnerable to bias stemming from confounding variables. However, it was not possible for us to conduct a test of the ‘common trend’ assumption by using the lead-in period data because we conducted only one round of the survey before the implementation of the project. In addition, the availability of other external data such as Demographic and Health Surveys is also limited in our study area. Therefore, we performed additional robustness checks by including various (observable) variables in addition to those used in our main analysis, along with showing the balance tests of the underlying characteristics of households and villages at the time of the baseline survey. We confirmed that our findings are robust against the inclusion of a number of other covariates.
Third, one concern that the ‘common trend’ assumption had been violated arose from changes in water sources in the control sites. In fact, new boreholes were constructed by other organizations and residents themselves dug new shallow wells in the control sites. It was impossible for us to prevent such construction of water facilities in the control sites. However, the boreholes in the project sites are differentiated from other water facilities, which were shallower and the quality of water was uncertain. Moreover, the distance to the nearest water sources changed from 454 meters to 159 meters in the project sites and 548 meters to 395 meters in the control sites between baseline and end-line surveys. The influences of the construction of the other water facilities in the control sites are highly likely to underestimate the impacts of the JICA project by providing a lower bound of estimates.
6. Conclusions
We examined the short-term impact of better access to improved water in rural Zambia on children in terms of health, schooling, and time allocation. We observed significant effects of better access to improved water sources on the reduction of the incidence of diarrhea for pre-school children but not for school age children. On the other hand, we found no positive effect on school attendance, as reported by most relevant previous studies (Devoto et al., Citation2012; Gross et al., Citation2018). The analyses using the time use survey found a significant decrease in time spent on schooling and homework, particularly for girls who live near the boreholes.
We furthermore confirmed that there was no change in the time spent on fetching water alone, yet there was a significant increase in the total time spent on water-related household chores including water collection. Alongside a significant decrease in time spent on water-related chores by female adults, better access to improved water supply shifts the burden of water-related household chores from female adults to girls.
The nexus of better access to improved water sources, burden of water collection, and health and schooling outcomes of children is complicated. This study, to the best of our knowledge, is the first trial to disentangle the issue by investigating the short-term impact of groundwater development projects on the burden of water collection and schooling outcomes jointly under a quasi-experimental setting, empowered by the information on time use and distance to water source. Future research should explore the longer-term effects of better access to improved water sources. In particular, the longer-term effects on educational attainment, especially for school-age children who bear an increased burden of water-related household chores, including water collection, must be examined.
Supplemental Material
Download PDF (379.2 KB)Acknowledgements
This study was conducted as part of the project ‘Empirical Research in Africa’ at the JICA Ogata Sadako Research Institute for Peace and Development, which sponsored our data collection and gave us formal permission to use these data. We thank the Ministry of Local Government and Housing of Zambia and the Japan International Cooperation Agency for permission to conduct the study. We also thank Nobuhide Hayashi, Ryuji Ogata, Etsuko Masuko and Eiji Yamada for their constructive comments on the draft. The views expressed in the paper are those of the authors and do not represent the official positions of either the JICA Ogata Sadako Research Institute for Peace and Development or JICA. The data and code for replication purpose are available upon request from the authors. The authors are responsible for any errors or omissions.
Disclosure statement
No potential conflict of interest was reported by the author.
Notes
1 Nauges and Strand (Citation2017) show a significantly negative relation between girls’ school attendance and time spent fetching water in Ghana. Zhang and Xu (Citation2016) show a long-term and positive effect of water treatment programs on girls’ school attainment in rural China.
2 See Table A1 of Gross et al. (Citation2018) for a literature review.
3 In addition, Graham et al. (2016) report that girls were more likely to be responsible for water collection than boys in sub-Saharan African countries.
4 The school attendance rate is defined as the proportion of the population by age group attending school (Grades 1–12) at the time of the survey for the Central Statistical Office, Republic of Zambia (Citation2016). The rate is 18.2% (48.8%) for pre-primary school age children, 79.1% (90.2%) for primary school age, and 72.7% (80.3%) for secondary school age, followed by 25.4% (34.0%) for a higher education age.
5 See Appendix B for a detailed description of the project and summary statistics of the main variables used in this study.
6 We obtained formal permission to use the data used in this study from the Ministry of Local Government and Housing, Republic of Zambia on 20th March 2013. The survey required written consent from respondents in advance. Moreover, the survey was approved by the Institutional Review Board, Institute for Economic Studies, Keio University (No. 20002).
7 Mansa was excluded from the survey since the facilities in some sites were handed over to the villagers before the baseline survey.
8 Households with fewer family members were more likely to move away, but this attrition pattern did not significantly differ between the project and control sites (JICA, Citation2014). The number of households and the attrition rate in each district are available in Appendix B.
9 The most knowledgeable person was made responsible for providing information on time use, but when they were absent, their spouses were responsible for the responses. We acknowledge the limitations of our time use data collection from a respondent about the average time spent on different activities and the use of diaries and the collection of data for several days or weeks allows for better quality data than our approach.
10 We confirmed that residents in the project and control sites had similar access to natural resources and that their communities had similar infrastructure conditions, access to shops/markets, schools, and health facilities at the time of the baseline survey (see Appendix A).
11 The rate of use of a new borehole is 79% in the treatment group. An additional analysis confirms that the borehole users on average carried approximately 40 liters from the new boreholes by making an average of three round trips per day.
12 The coefficient on the year 2013 dummy is negative and significant in Colum (D), (E), and (F), showing that the general level of water collected decreased in 2013. The decline can be partly attributed to lower temperature: the maximum temperature in 2013 was much lower than that of 2012 during the survey period. Therefore, we conjecture that cooler climate conditions were highly likely to have reduced demand for water, particularly for drinking purposes. Moreover, our time use survey suggests that farmers expected that the rainy season would come soon after the end-line survey and were engaged in land preparation earlier than usual, which increased the time spent on income-generating activities (including farming) and decreased time spent on water collection.
13 Conventional studies on diarrhea among children distinguish infants and older children. However, our sample includes only a small number of infants less than 12 months old. Therefore, even though the point estimate of the project impact is larger for infants less than 12 months old, the point estimate is insignificant at any conventional level. We also tried various different categorizations of the age groups and found that the point estimates tend to be larger for younger age groups, yet the point estimates tend to be insignificant due to the smaller sample size. Moreover, we have compared the point estimates for children under 5 and all pre-school age children aged 6 or less and confirmed that they are very similar.
14 School-age children spent longer hours in school and used water sources other than the borehole near their house, which might explain the project’s lack of impact on school-age children. To examine this hypothesis, we conducted the same estimation for children who attended school and those who did not separately. Nonetheless, the estimation results were similar for the two groups.
15 The results are available upon request from the authors.
16 The attrition rate in the project sites was 14.9% and that in the control sites was 17.0%, which do not differ significantly.
17 The results using an inverse probability weighting (IPW) regression are available in the Supplemental Materials. The result using Heckman’s two-step selection model is available upon request from the authors.
References
- Arnold, B., & Colford, J. Jr.(2007). Treating water with chlorine at point-of-use to improve water quality and reduce child diarrhea in developing countries: A systemic review and meta-analysis. American Journal of Tropical Medicine and Hygiene, 76(2), 35–364.
- Bevan, D., Collier, P., & Gunning, J. W. (1989). Peasants and governments: An economic analysis. Oxford: Clarendon.
- Blum, D., Robert, N., Emeh, S., Huttly, R. A., Dosunmu-Ogunbi, O., Okeke, N., … Feachem, R. G. (1990). The Imo State (Nigeria) drinking water supply and sanitation project: Description of the project, evaluation methods, and impact on intervening variables. Transactions of the Royal Society of Tropical Medicine and Hygiene, 84(2), 309–15. doi:10.1016/0035-9203(90)90299-T
- Cairncross, S., & Cliff, J. L. (1987). Water use and health in Mueda, Mozambique. Transactions of the Royal Society of Tropical Medicine and Hygiene, 81(1), 51–54.
- Central Statistical Office, Republic of Zambia. (2016). Living conditions monitoring survey report 2015. Lusaka: CSO.
- Clasen, T. F., Alexander, K. T., Sinclair, D., Boisson, S., Peletz, R., Chang, H. H., … Cairncross, S. (2015). Interventions to improve water quality for preventing diarrhoea. Cochrane Database of Systematic Reviews, 10, CD004794. doi:10.1002/14651858.CD004794.pub3
- Devoto, F., Duflo, E., Dupas, P., Parienté, W., & Pons, V. (2012). Happiness on tap: Piped water adoption in urban Morocco. American Economic Journal: Economic Policy, 4(4), 68–99.
- Fewtrell, L., Kaufmann, R. B., Kay, D., Enanoria, W., Haller, L., & Colford, J. M. Jr. (2005). Water, sanitation, and hygiene interventions to reduce diarrhoea in less developed countries: A systematic review and metaanalysis. Lancet Infectious Diseases, 5, 42–52.
- Graham, J., Hirai, M., & Kim, S. (2016). An analysis of water collection labor among women and children in 24 sub-Saharan African countries. PLoS One, 11(6), e0155981.
- Gross, E., Günther, I., & Schipper, Y. (2018). Women are walking and waiting for water: The time value of public water supply. Economic Development and Cultural Change, 66(3), 489–517.
- Gundry, S., Wright, J., & Conroy, R. (2004). A systematic review of the health outcomes related to household water quality in developing countries. Journal of Water and Health, 2(1), 1–13.
- Günther, I., & Schipper, Y. (2013). Pumps, germs and storage: The impact of improved water containers on water quality and health. Health Economics, 22(7), 757–74.
- Japan International Cooperation Agency. (2014). Basic research for impact evaluation trial on grant aid: A case from rural groundwater development project in Zambia. Tokyo: JICA.
- Jensen, P., & Nielsen, H. S. (1997). Child labour or school attendance? Evidence from Zambia. Journal of Population Economics, 19(4), 407–424.
- Koolwal, G., & van de Walle, D. (2013). Access to water, women’s work and child outcomes. Economic Development and Cultural Change, 61(2), 369–405.
- Kremer, M., Leino, J., Miguel, E., & Zwane, A.P. (2011). Spring cleaning: Rural water impacts, valuation, and property rights institutions. Quarterly Journal of Economics, 126, 145–205.
- Ministry of Health, Republic of Zambia. ( 2014). Annual health statistical bulletin 2012. Lusaka: MOH.
- Nauges, C., & Strand, J. (2017). Water hauling and girls’ school attendance: Some new evidence from Ghana. Environment and Resource Economics, 66, 65–88.
- Pickbourn, L. & Ndikumana, L. (2019). Does health aid reduce infant and child mortality from diarrhoea in sub-Saharan Africa? Journal of Development Studies, 55, 2212–2231.
- Ray, I. (2007). Women, water and development. Annual Review of Environment and Resources 32, 421–49.
- Roby, J. L., Erickson, L., & Nagaishi, C. (2016). Education for children in sub-Saharan Africa: Predictors impacting school attendance. Children and Youth Services Review, 64, 110–116.
- Sorenson, S., Morssink, C., & Campos, P. (2011). Safe access to safe water in low income countries: Water fetching in current times. Soc Sci Med, 72(9), 1522–26.
- Townsend, R. (1994). Risk and insurance in village India. Econometrica, 62(3), 539–591. doi:10.2307/2951659
- United Nations Children’s Fund & World Health Organization. (2019). Progress on household drinking water, sanitation and hygiene 2000-2017. Special focus on inequalities. New York: UNICEF.
- United Nations Educational, Scientific and Cultural Organization (UNESCO). ( 2020). Global Education Monitoring Report. Inclusion and Education: All Means All. Paris: UNESCO. https://en.unesco.org/gem-report/allreports
- United Nations. (n.d.). Sustainable development goals, goal 6 water and sanitation. https://www.un.org/sustainabledevelopment/water-and-sanitation/
- Waddington, H., & Snilstveit, B. (2009). Effectiveness and sustainability of water, sanitation, and hygiene interventions in combating diarrhoea. Journal of Development Effectiveness, 1(3), 295–335.
- Wayoro, D., & Ndikumana, L. (2020). Impact of development aid on infant mortality: Micro-level evidence from Côte d'Ivoire. African Development Review, 32(3), 432–445.
- Wooldridge, J. M. (2010). Econometric analysis of cross section and panel data (2nd ed.). Cambridge, MA: MIT Press.
- Wright, J., Gundry, S. & Conroy, R. (2004). Household drinking water in developing countries: A systematic review of microbiological contamination between source and point-of-use. Tropical Medicine & International Health, 9(1), 106–117.
- Zhang, J., & Xu, L. (2016). The long-run effects of treated water on education: The rural drinking water program in China. Journal of Development Economics, 122, 1–15.
- Zwane, A. P., & Kremer, M. (2007). What works in fighting diarrheal diseases in developing countries? A critical review. World Bank Research Observer, 22(1), 1–24.
Appendix A: Balance test
Appendix B. The project and data description
1 Overview of the project
The target project of this study is the Project for Groundwater Development in Luapula Province Phase 2 (the grant agreement was made in 2010), which aimed to reduce water-related diseases – especially diarrhea – by ensuring reasonable access to safe and stable water sources.
The project consists of both hardware and software components. The hardware component comprised the construction of borehole water supply facilities with hand pumps at 216 sites between February 2012 and May 2013. A distinctive feature of the facilities installed in the project is the depth of the boreholes. These have a designed average depth of 63 meters below ground level, which ensures that water is free from ground contaminants (JICA Citation2014). The quality of water at each borehole was tested to satisfy the national standards of Zambia.
The software component included (re)organization of the Village Water, Sanitation and Health Education (V-WASHE) Committee, which is responsible for general and daily operations and maintenance at the village level. In addition, a variety of training programs were provided to stakeholders. These programs offered knowledge and techniques for the operation and maintenance of the facilities and management of the organization for V-WASHE members and administration officers. They also promoted hygiene and sanitation practices at the target sites for villagers (JICA Citation2014).
2 Summary statistics
shows the number of households surveyed in each district. reports on the summary statistics of the variables used in the multi-variate regression analyses. The sample is confined to households that were surveyed in both baseline and end-line periods. The number of households is 635 in both years. The number of children under 18 is 1850 at the baseline and 1710 at the end-line.
The proportion of females is slightly over half and their average age is eight years. The proportion of female-headed households is about 20 per cent and the age of the head of household is about 43. The highest years of schooling among females above 18 is about five years, which is lower than that among males above 18. The number of household members is about five. The proportion of dependent members whose age is younger than 15 or older than 65 is about 45 per cent. The monthly real consumption per capita using the adult equivalence scale is 156 and 174 thousand Zambian kwacha in 2012 and 2013, while the value of durable assets is 1.4 and 1.6 million Zambian kwacha in 2012 and 2013 (1 US dollar was equal to 5.2 thousand ZMK as of June 2012. The equivalent scale is calculated based on Townsend (Citation1994)).
The lower table for 2013 shows that the proportion of households at the project sites is close to 67.4 per cent and 78 per cent of those households used newly built boreholes. In other words, about 80 per cent of the households used the new boreholes but the remaining households did not. The average distance to the new borehole is about 200 meters from participants’ houses, or about a 4-min walk. Village characteristics (population and average assets per household) are also shown in the table.
Table B1. Number of households in each district
Table B2. Summary statistics