
Abstract
The quantitative development of Rwanda’s agriculture in recent years has been widely regarded as a success story. However, a simple statistical analysis of publicly available data shows that food crop production volumes and yields actually stagnated over the last fifteen years. Moreover, agricultural output was significantly overestimated from 2008 to 2013 and then adjusted without explanation in Rwandan and international datasets. As a result, the country’s economic growth numbers are inflated as well. After presenting substantial evidence for these claims, this article discusses why massive food production overestimation occurred. It argues that it likely proliferated due to a flawed performance contract system that incentivized bureaucrats and farmers to tweak the numbers instead of compelling them to achieve actual results. Even more, this inflation prevented early detection of agricultural stagnation and the required policy adjustment. The article concludes that despite its failure to raise yields and the flaws in its governance system, the Rwandan government has achieved a fair amount of progress in state-building and socio-economic development, and that this may eventually lead to more effective policy implementation.
1. Introduction
In academic scholarship and international development, Rwanda stands out as a country that emerged from the apocalyptic tragedy of the Genocide against the Tutsi in 1994 to become a paragon of state effectiveness and socio-economic development (Booth & Golooba-Mutebi, Citation2012; Chemouni, Citation2018), while simultaneously maintaining a dismal record on political and human rights (Reyntjens, Citation2013; Straus & Waldorf, Citation2011).
Rwanda’s exceptional record of almost eight per cent annual economic growth over the last two decades (and over five per cent per capita growth) made it rank in Africa’s top three in this time period. Regarding agricultural development, there is a consensus among academics that Rwanda has succeeded in substantially raising its total agricultural production volume and that this was largely driven by substantial yield growth. An often-used summary is that between 2007 and 2011 production volumes of cassava, maize, and wheat tripled, those of beans doubled, and rice and Irish potato output rose by 30 per cent. This statement appears in lauding (Golooba-Mutebi, Citation2014), agnostic (Harrison, Citation2016), and condemning (Cioffo, Ansoms, & Murison, Citation2016) articles on Rwanda’s agricultural policies. Reports of international organizations use similar formulations (Diao, Bahiigwa, & Pradesha, Citation2014; IFAD, Citation2013; World Bank, Citation2014). Virtually all other publications concerned with post-genocide Rwandan agriculture at least implicitly acknowledge the general notion of the country’s agrarian macro-level success.
To evaluate whether a particular country’s agricultural policies are effective, an obvious analytical starting point is its agricultural statistics. Unfortunately, crop production and yield data in developing countries are often of poor quality (Jerven, Citation2014). Incompatible estimates from different data sources for the same crop and year as well as unrealistic one-year jumps within a time series are common (Carletto, Jolliffe, & Banerjee, Citation2015). Also, non-standardized methods and units provide large space for ‘negotiation’ of data that can lead to highly distorted numbers. Regularly, a range of competing, mutually exclusive data sources exist, allowing governments and international organizations to ‘choose’ the most convenient one (Jerven, Citation2014). All this warrants a careful and detailed analysis of different available datasets on agricultural development before concluding the success or failure of agricultural reforms.
At its core, this paper conducts such a data analysis for the agricultural sector of Rwanda from 2005 to 2018. To that end, publicly available data from various Rwandan sources and the Food and Agriculture Organization (FAO) are used. Simple descriptive statistics methods suffice to reveal compelling data patterns. The data section’s merit comes from very cumbersome data compilation and careful cross-examination of a plethora of distinct and partially inconsistent Rwandan and international sources. Besides scrutinizing all available documents, additional evidence was obtained from interviewing two former Rwandan government employees as well as from email correspondence with the FAO statistics department (FAOSTAT) and the National Institute for Statistics of Rwanda (NISR). The Rwandan Ministry for Agriculture and Animal Husbandry (MINAGRI) did not reply to two written inquiries.
Analyzing the data patterns in Rwanda’s official agricultural statistics reveals a significant break in the time series from 2014 to 2015, disproving the prevailing narrative of Rwanda’s exponential agricultural production and yield growth from 2008 to 2013. The only document (of any kind) studying Rwandan agricultural data in detail is an academic article by Desiere, Staelens, and D’Haese (Citation2016), which compared Rwanda’s official crop yield data from FAOSTAT’s database with two disparate Rwandan sources between 2006 and 2013 and found remarkable discrepancies, letting them conclude that ‘[official yield] numbers in Rwanda are too optimistic and may even be plainly wrong’ (p. 1384). While their study is recapitulated in the synthesis article of Ansoms et al. (Citation2018), in which Desiere is a co-author, more recent evidence is not included. In fact, not a single academic study, report, or other analysis could be identified via in-depth internet searches that assesses Rwandan food crop statistics over the time series break 2014–2015.
The remainder of the article is structured as follows. Section 2 describes the composition and evolution of Rwanda’s agricultural governance and statistics system. Section 3 presents Rwandan agricultural production and yield data from 2005 to 2018 by dissecting both Rwandan and FAO datasets. Section 4 discusses potential political economy explanations for the revealed data patterns of systematic overestimation. Section 5 concludes.
2. Rwanda’s agricultural governance and statistics system
Agriculture still accounts for 24 per cent of Rwanda’s national income, with close to 70 per cent of the working age population engaged in it (World Bank, Citation2019). Almost two-thirds of agricultural value come from food crops. Average annual agricultural growth was reported as 5.4 per cent over the last two decades, of which nearly two-thirds were attributed to food crop growth. Virtually all Rwandan farmers are smallholders and engage fully or partially in subsistence agriculture. Agricultural activity is coordinated by MINAGRI and its agencies. Additionally, NISR commissions agricultural surveys and collects agricultural data. The most important administrative units of local government are Rwanda’s 30 districts, which organize agricultural activity via their district agronomists and cash crop officers as well as government-appointed personnel in the country’s 416 sectors (Chemouni, Citation2014). Over the past years, Rwanda’s main policy regarding agricultural growth has been the Crop Intensification Program which ran from 2007 to 2020. At its heart was the creation of regional monocropping zones based on agro-climatic conditions (Harrison, Citation2016). For this endeavor, six priority crops were selected (beans, cassava, Irish potatoes, maize, rice, and wheat) and various technocratic ‘Green Revolution’ measures and technologies were introduced to boost crop yields (Kathiresan, Citation2011).
There exist two distinct and only loosely connected agricultural data collection systems in Rwanda: a constantly evolving agricultural survey system that provides data for official statistics and a local agronomist production estimation system present in most developing countries and usually known as ‘routine system’ (Carletto et al., Citation2015). The two systems are described in turn as follows.
After the genocide, the comparatively high-quality pre-civil war agricultural data collection system had been destroyed (Kelly & Donovan, Citation2008). In the emergency period after 1994, rough harvest estimates were needed to calculate the required food aid (FAO & WFP, Citation1997) and to that end, so-called crop forecasting surveys were conducted from 1997 onwards (Nyabyenda & Niyonsaba, Citation2009). While their methodology was refined over the years and they were later known as crop assessments (CAs), the Rwandan statistics institute highlighted in a 2012 stock-taking exercise that they never amounted to ex-post output estimates but remained ‘forecasts of potential production produced before the end of every season’ (NISR, Citation2012, p. 3, emphases added). However, up to the fiscal year 2013/14, official agricultural statistics were solely based on these biannualFootnote1 CA forecast surveys, even though other complementary and partially more professional and reliable agricultural surveys were carried out over the years. The CAs were eventually discontinued after season 2014B. There is no public information available on the methods of pre-2008 CAs.
Being aware of the poor quality of its statistics at the time (MINECOFIN, Citation2002), the Rwandan government established NISR in late 2005, which became jointly responsible for the production of agricultural statistics in collaboration with MINAGRI’s statistics department. Authorities realized the need for a large-scale agricultural baseline survey and thus, the National Agricultural Survey (NAS) was carried out in 2008. It was in several regards an important milestone towards the professionalization of Rwanda’s agricultural statistics system. First, it used a representative sampling methodology coming from earlier nationwide general surveys. Second, it moved from estimating predicted to actual production and applied rather professional data collection methods (standardized measurement tapes, spring balances, and buckets). Hence, it arguably produced more accurate evidence than previous surveys. Third, since its results are publicly available, they provide an important reference for the simultaneously conducted CAs constituting official numbers. From then on, all post-2008 CAs surveyed a 25 per cent sub-sample of the 10,040 household sample of the NAS (MINAGRI, Citation2009a). However, post-2008 CAs did not adopt the improved data collection methods but remained with less precise pre-harvest eye estimates (MINAGRI, Citation2009a; NISR, Citation2012).
A few years later, it was decided to completely overhaul the agricultural data collection system and to set up a modern state-of-the-art statistical framework (NISR, Citation2012). External consultants were hired, and they set up a seasonal agricultural survey (SAS) that was initially conducted in season 2013A, became the sole source of official agricultural statistics from the fiscal year 2014/15, and has been carried out in each season ever since. The SAS uses a multiple frame survey design (area and list sampling), which was more professional than in the NAS 2008 (Manzi, Citation2013; NISR, Citation2013). While the survey reports and accompanying documents are very transparent on sampling methods and content of questionnaires, they hardly mention area and yield measurement techniques. It is, however, clear that area was measured by using satellite data and yield metering was conducted via a mixture of standardized weighing procedures and directly asking farmers. Thus, the SAS still partially relies on farmers’ recall. However, surveying occurred immediately after or even during harvesting, thus significantly reducing potential recall biases (Wollburg, Tiberti, & Zezza, Citation2021). Even more, splitting data collection into two phases and surveying production results in the second phase during or after the harvest eliminated the likely error in crop assessments resulting from production volume anticipation before harvesting began.
Largely independent of the survey system’s evolution, the distinct Rwandan routine system of agricultural data collection carried out by local government representatives and reported to MINAGRI operated in parallel. In Rwanda, where state reach and political control are extreme, this administrative system was rebuilt quickly after the genocide, and a detailed network of district- and sector-level agronomists responsible for both monitoring and strictly enforcing farmers’ policy compliance was established throughout the country. Logistically, farmer controlling was embedded in the ‘decentralized’ district-level governance system of performance contracts initiated in 2006 and locally known as imihigo (Ansoms, Citation2009). Given the designation of food crop agriculture as a key development area for almost all of Rwanda’s thirty districts, ambitious district-specific objectives were set within this system according to the priorities of the country’s agricultural transformation strategy. In particular, annual crop-specific targets for the consolidation of land as well as for yields within these consolidated areas were formulated in district performance contracts.Footnote2
In 2011, annual performance contracts were introduced for national ministries and a few years later, joint sector contracts, for example, the Joint Agriculture Imihigo signed by the Minister of Agriculture as the lead and several other ministers and district mayors, were added. Overarching annual objectives are taken from national strategy documents and more detailed targets are negotiated between everyone involved. While initial baselines came from actual values, those of subsequent years did not represent past achievements but targets of the previous year. Thus, performance contract documents usually do not contain any actual values, only past, present and future targets. Actual results of districts and ministries are submitted in publicly unavailable imihigo reports to the Ministry of Finance and Economic Planning (MINECOFIN). However, realized values of joint sector imihigo are publicly available in so-called Backward-looking Joint Sector Review Reports (BLJSRRs) compiled by responsible lead ministries. The system’s vulnerability to data tweaking as well as its interaction with the agricultural survey system is discussed in section 4.
3. Data analysis
Examining Rwanda’s agricultural statistics up to 2018, this section offers substantial evidence for four claims about the evolution of Rwandan food crop production and yields over the last one and a half decades. First, according to all available data sources, Rwandan food crop production and yields stagnated over the whole period 2005–2018, a finding clearly at odds with the prevailing consensus (3.1). Second, Rwanda massively overestimated its agricultural production and yields from 2008 to 2013, a finding not discussed elsewhere. This claim is investigated by firstly scrutinizing Rwandan data sources and dissecting both the strong rise (2007–2013) and the massive drop (2013–2014) of food production levels (3.2), secondly comparing FAO and Rwandan statistics to identify the origins of the unusual discrepancies between the two sources (3.3), and thirdly analyzing individual crop data to corroborate the findings (3.4). These sub-sections conclude that neither Rwandan nor FAO data is reliable. Third, the dismantling of agricultural production data suggests that Rwanda’s GDP is very likely overreported by several percentage points (3.5). Fourth, district-level food crop production data as reported in performance contracts was even more overestimated from 2008 to 2013, and—in contrast to official statistics—output volumes in the national performance monitoring system remain at strongly inflated levels, demonstrating the ineffectiveness of imihigo contracts in the agricultural domain (3.6).
3.1. Food crop production volume and yield
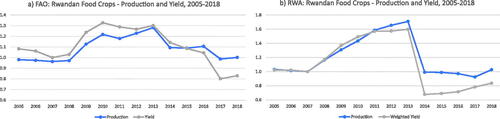
FAO data on Rwandan food production and yields between 2005 and 2018 paints a peculiar picture (). Production volume increased by 33 per cent from 2007 to 2013, only to fall back to 2007 levels in subsequent years. For yields, the trend looks even worse: food crop productivity jumped by 33 per cent in only three years (2007–2010), stayed at this level until 2013, and then slowly deteriorated to values 17 per cent below initial levels in 2018. If considering Rwandan data sources,Footnote3 a similar but significantly more extreme trend appears (). Production levels rose by over 70 per cent from 2007 to 2013 and then crashed to initial levels in 2014 where they remained. Yields increased by 60% in the same period and then dropped to values 33 per cent below 2007 volumes in 2014. From there, they slowly rose again but did not reach pre-reform levels in 2018. The FAO and Rwandan time series for food crop production and yields significantly differ, which is uncommon (see section 3.3), but they did converge in recent years. Thus, according to both FAO and Rwandan sources, Rwandan food crop production and yields did not increase permanently but rather exhibited a hump from 2007 to 2014. In both datasets, production and yield levels in 2018 are at or below 2007 levels, implying stagnation.Footnote4 This result is clearly at odds with the consensus in the literature as summarized above.
Figure 1. Rwandan food crop production and yields 2005–2018 (indexed to 2007 Rwandan data). (a) FAO data. (b) Rwandan data.
3.2. Overestimation 2008–2013
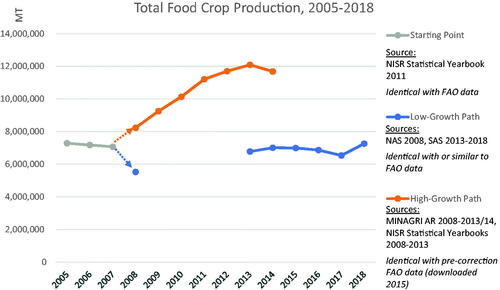
Rwandan food crop production data from 2000 to 2007 is internally consistent and was adopted by the FAO without changes. Data inconsistencies between different publicly available Rwandan sources emerge for the first time in 2008 () when NISR conducted the NAS. This survey estimated production levels for 2008 to have decreased by 22 per cent from 2007. In parallel, MINAGRI continued to conduct its CAs in 2008 and reported a 16 per cent increase from 2007. As both the sampling and the measurement methods of the NAS were much more sophisticated than those of the early CAs, it is highly likely that the low NAS estimate was more accurate than the high CA result. The 2008 NAS numbers might therefore be understood as a correction of already inflated food crop numbers of 2007 and before. From 2009 to 2014, MINAGRI continued to conduct CAs, which exhibited significant annual growth in production levels (henceforth labelled high-growth path). All government documents, e.g. all annual reports (AR) of MINAGRI from 2008 to 2013/14, the statistical yearbooks 2008–2013, as well as other strategies and reports use these high-growth path numbers. The lower production level measured by the NAS in 2008 was picked up again by the first seasonal agricultural survey in 2013, and subsequent SASs from 2014 to 2018 were in line with it (henceforth labelled low-growth path).
Figure 2. Divergence of low-growth and high-growth paths in Rwandan food crop production statistics 2005–2018.
In its AR 2013/14, MINAGRI still reported the high-growth path CA numbers, while the SAS 2013 and SAS 2014 conducted by NISR already reported much lower production levels. MINAGRI’s AR 2014/15 then started to source its data from the SAS, such that numbers for both of its reported years were then much lower. This means that for the year 2014, the two corresponding MINAGRI ARs 2013/14 and 2014/15 document fundamentally different numbers for identical items. Unfortunately, no document mentions or explains the change in methodology or the jumps in production levels. For the purpose of this paper, high 2013 numbers and low 2014 numbers have been used, making the sharp drop ‘occur’ from 2013 to 2014. Alternatively, it would appear in the data from 2014 to 2015, but it is clear that a real one-time drop did not happen of this magnitude or at all. Rather, the more sophisticated survey methodology showed that real production and yield numbers were much lower than reported in the crop assessments. However, Rwanda has not adjusted its overestimated 2008–2013 agricultural data so far.Footnote5
The analysis at hand has established that even pre-2008 reports may have suffered from a fair degree of overestimation, as revealed by the NAS 2008. If taking the still shakyFootnote6 NAS 2008 production estimates as a base, food crop production actually increased by 31 per cent from 2008 to 2018, constituting an average annual growth rate of 3.1 per cent. According to this calculation, Rwanda’s agricultural reform would at least have produced medium output growth. However, a transformational outcome of skyrocketing yield growth, as reported in both academic articles and non-academic reports a few years ago, can be ruled out.
3.3. Differences between FAO and Rwandan data
Discrepancies between FAO and country data are unusual, as the FAO gets its numbers by sending annual questionnaires to country governments asking for production and area data of each crop and then calculates the resulting yield. If data is missing, the FAO imputes these values using an ensemble approach (FAO, Citation2016). However, it does not have the mandate to assess data validity (Desiere et al., Citation2016).
Initially, the FAO adopted Rwanda’s high-growth food crop data from 2008 to 2013. In their comparative analysis, Desiere et al. (Citation2016) used this original FAO data (which was identical to official Rwandan data). However, as confirmed by the FAO statistics department, their interaction with NISR revealed the 2014 break in Rwanda’s agricultural time series due to its updated survey methodology (FAOSTAT employee, email communication, June 24, 2020). This is why, at some point in time between early 2015 and late 2019, the FAO—based on Rwanda’s advice—significantly decreased the country’s production and yield data of three food crops from 2008 to 2013 (), thus leading to significant differences between FAO and country data.Footnote7 For cassava, the subtracted amounts lay between almost exactly 1 million (m) metric tons (MT) in 2008 and almost exactly 2m MT in 2012 and 2013. For Irish potatoes, 1m MT was subtracted in each of the years 2011–2013. Wheat production levels were corrected downwards by 90 per cent from 2008 to 2013.Footnote8 However, none of the other ten crops listed individually each year by Rwandan sources were changed. According to the FAO, these corrections allowed them to link the pre- and post-2014 Rwandan agricultural time series (FAOSTAT employee, email communication, June 24, 2020). Moreover, this significant downwards adjustment of Rwanda’s agricultural production data confirmed Desiere et al.’s (Citation2016) conclusion about pre-correction FAO data being much too high.
Table 1. Difference between FAO and Rwandan data in cassava, Irish potato and wheat production 2007–2014
3.4. Development of individual crops
To assess whether FAO data was made sufficiently reliable by manually correcting production levels of cassava, Irish potatoes, and wheat downwards, production statistics of four other important crops are considered. These are the remaining three priority crops rice, beans, and maize, as well as bananas, which are grown in large quantities in Rwanda. Together, these seven crops accounted for 96 per cent of the rise and 88 per cent of the fall in Rwandan data during the period in question.Footnote9 The production volume patterns of the four selected crops reveal two distinct patterns (). For rice and beans, annual volumes grew moderately and continuously, and FAO and Rwandan data are almost identical. Consequently, there is no evidence of production overestimation for these two crops. This looks entirely different for maize and banana production. For both crops, there is a massive drop in production levels within one or two years in both datasets, exhibiting the same pattern as identified in overall food crop production. In Rwandan data, maize production fell by 47 per cent from 2013 to 2014, while a two-year drop (2013–2015) of virtually the same size occurred in FAO data. Regarding bananas, the production level decreased by 44 per cent from 2013 to 2014 in Rwandan data, while an almost identical abrupt decline occurred in FAO data from 2016 to 2017. Interestingly, the massive drop in maize production occurred after a 5-fold multiplication from 2007 to 2013, thus ending with a net growth of 314 per cent, whereas the large drop in banana production was only preceded by a minor growth spurt, thus resulting in a net decline of 29 per cent.
Figure 3. Rwandan production development of rice, beans, maize, and bananas according to FAO and Rwandan data 2005–2018.
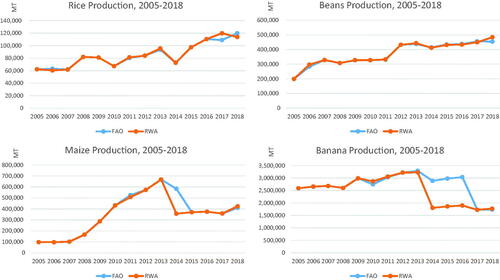
These graphs illustrate that Rwandan food crop production overestimation was not limited to the three crops manually corrected by the FAO, but also encompassed maize and banana production. Since the FAO did not retrospectively correct the inflated maize and banana production numbers from 2008 to 2013, whose rapid declines jointly constitute 29 per cent of the total fall in food crop production, the post-correction FAO dataset is not reliable either. Dissecting the production level data patterns for the most important Rwandan food crops has shown that it cannot be clarified whether there was any overall food crop production growth between 2005 and 2018. Hypothetical real growth was overshadowed by massive overestimation and potential real decline was overshadowed by the massive one-time correction of this overestimation in 2014.
3.5. Impact on GDP
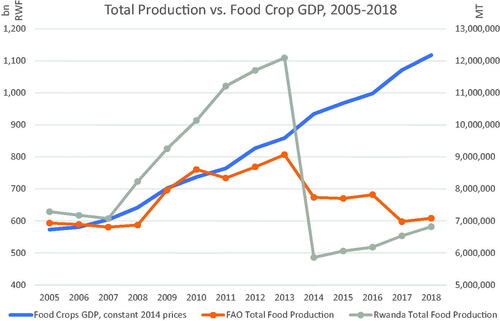
In Rwandan national accounts, food crops are listed as a sub-category of agricultural GDP. Plotting food crop GDP (as value-added) from 2005 to 2018 against food production volumes (in metric tons) shows that the two time series are incompatible (). While the strong rise in production levels from 2007 to 2013 corresponds with food crop GDP growth during these years, the drop of the former must eventually occur in the latter as well, even if the composition of agricultural output shifted towards higher-value crops, relative food crop prices changed, and input subsidies raised the value-added per output unit. The conducted analysis does not allow any other conclusion than that Rwanda’s food crop GDP (and by implication, also its agricultural and total GDP) has been overreported for several years.Footnote10 Since food crop GDP accounted for 16–19 per cent of overall GDP between 2007 and 2018 and was responsible for 13 per cent of all GDP growth in this period, its manual correction would likely have a significant negative effect on previous GDP growth. If it were adjusted proportionate to food crop volume development, this would reduce average annual growth by 0.7 per cent, total GDP in 2017 by 7.1 per cent, and GDP per capita in 2017 from 784 USD to 728 USD.Footnote11
Figure 4. Comparison of Rwandan food crop GDP (as value-added) and total food crop production volumes (in metric tons) 2005–2018.
3.6. Performance contract data
As elaborated above, the routine system of agricultural data collection by local agronomists in Rwanda exists in parallel to the agricultural survey system feeding official statistics. It turns out that during the period of massive crop assessment overestimation from 2008 to 2013, performance contract data was even more inflated. Assessing the nine publicly available district imihigo from 2012 to 2014 shows that the annual baselines and targets (i.e. referring to 2011–2013) of consolidated area and yields on these aggregated sites for the six priority crops result in a total production volume that is already 21 per cent higher than the grossly overestimated CA numbers. This is, however, a lower bound of production estimation from performance contracts, as they only include production on consolidated sites, while a large portion of farming still occurred on unconsolidated plots.Footnote12 Direct evidence for imihigo numbers surmounting the inflated high-growth path is provided by a government evaluation, which found that district agronomists overstated consolidated area by 18.3 per cent relative to official numbers in season 2013A (Dusengemungu et al., Citation2013).
Interestingly, while the reform of the agricultural survey system led to the detection and correction of overestimated numbers from 2014 onwards, national and district-level agriculture performance contracts continued to work with vastly overstated numbers. This can be demonstrated by comparing 2018 food crop data from imihigo result reports with official numbers from NISR’s seasonal agricultural surveys (). For all six priority crops, area and yield results are much higher in the former than in the latter, resulting in massively overreported production levels (ranging from a 76% excess for rice to a 790% overhang for wheat) in 2018 imihigo data.Footnote13 In total, food crop production for these six crops within consolidated sites is reported to be 192 per cent higher than equivalent food harvests as officially indicated. The continued simultaneous existence of the two distinct and diverging food crop data systems is also evident in MINAGRI’s AR 2017/18, which reproduces the incompatible consolidated crop area from performance contracts (MINAGRI, Citation2018, p. 1, Table 3) and the total crop area from the SAS (MINAGRI, Citation2018, pp. 6–8, Table 9), where the former is often higher than the latter, which is by definition impossible.
Table 2. Difference between reported food crop data of national performance contracts and agricultural surveys
To summarize, from 2008 to 2013, both the agricultural survey and the administrative data collection system produced grossly overestimated food crop estimates. In 2014, the overhaul of the agricultural survey system led to a correction of the inflated numbers that were adopted in official statistics. Simultaneously, the detached administrative data collection system propelled by imihigo targets continued to report ever increasing land use consolidation and yield growth within these sites without being seriously questioned. Even more, the irreconcilable results of joint imihigo reports (BLJSRR) and seasonal agricultural surveys were depicted next to each other in official ministry reports.
4. Discussion
The established findings regarding stagnating and overreported food crop production in Rwanda from 2005 to 2018 raise several questions, of which only one is discussed in this article: what were the causes and mechanisms that led to the proliferation and eventual correction of systematic overreporting?
It is well-known that agricultural statistics in developing countries are often of poor quality (Jerven, Citation2014). Depending on the employed data collection methodology (and after assuming a proper sampling method), several biases might be at work. However, this section does not assess or explain general reporting errors and biases in Rwanda’s food crop statistics system that existed already before 2008 and might or might not have been eradicated by the introduction of the SAS. Rather, the relevant question is why and how the time- and crop-specific massive production and yield overestimation from 2008 to 2013 did occur. In other words, there must have been reasons for the strongly rising food crop production numbers in these years (irrespective of general biases and errors applying throughout the years), when in fact actual production was (almost) stagnating.
4.1. Possible explanations for overreporting
The data patterns presented in section 3 in combination with the information about the data collection systems illustrated in section 2 essentially leave three possible explanations for overreporting. Either farmers reported ever increasing area, yield, and production data to crop assessment field enumerators while most numbers were in fact stagnating. Or crop assessment report data did not solely come from crop assessment surveys but was amended upwards by merging it with MINAGRI’s administrative reporting system, and then, that amended data became the official statistics. Or crop assessment report data was deliberately fabricated. The third explanation can be dismissed, as such a fabrication would have required the manual change of thousands of internally consistent individual crop- and district-specific production, yield, and area data points.Footnote14
Examining the likelihood of the two other outlined possibilities, there is only scarce written evidence regarding the compilation of crop assessment data (i.e. official agricultural statistics) from 2008 to 2013. Of the fourteen undertaken crop assessment surveys from season 2008A to season 2014B, only four corresponding reports (season 2009B, 2010A, 2010B, and 2012A) could be found online. According to all of them, sampling occurred by making use of the NAS sampling methodology and surveying a 25 per cent sub-sample (e.g. MINAGRI, Citation2009a). Moreover, the 2012A crop assessment explicitly states that the reported data (which is identical to official statistics) is only based on the surveyed sample (MINAGRI, Citation2012). Furthermore, two interviewed former MINAGRI employees confirmed this approach. A former intern in the MINAGRI statistics department during the 2008–2013 period, who was responsible for the compilation of crop assessment survey data of a few districts into provincial aggregates, confirmed that they received the original data collection sheets from field enumerators and transferred and added up the microdata in specific spreadsheets. A former MINAGRI senior manager explicitly stated that local administrative agricultural data and crop assessment survey data (i.e. the two distinct data collection systems) were not put together and that official statistics were only based on survey results. While acknowledging that experienced Rwanda researchers note that the country has ‘a cultural environment in which concealing or distorting the truth are traditionally regarded as both a virtue and an art’ (Lemarchand 1970 as cited in Jones, Citation2014, p. 12), it seems unlikely that the evidence presented above is entirely distorted to conceal a broadly conceived effort of amalgamating crop assessment survey and administrative agronomist data or even complete data manipulation. As a result, these scenarios are dismissed as explanations for massive overreporting.
4.2. Two channels of farmer overreporting
This leaves the possibility of the existence of a particular mechanism that led farmers to accidentally overestimate or deliberately overreport their seasonal food crop production on a massive and annually accumulating scale to field enumerators conducting interviews for the biannual crop assessment surveys. There are two (potentially synergistic) channels through how this could have proliferated, which both come from the general political economy of post-genocide Rwanda. The Rwandan ruling elite has very ambitious plans for the complete reconfiguration of rural space and has implemented several far-reaching policies, such as a rural resettling program (Newbury, Citation2011) and the introduction of performance contracts that in theory even branch out to the level of individual households (Huggins, Citation2014). Peasants, who are widely affected by various government actions that have increased in number and intensity over the years, might attempt to mitigate state interference by complying with policies wherever deemed harmless and also by telling officials (including crop assessment field enumerators) what they want to hear. As farmers were aware of strong government interest in raising food crop yields and production levels from 2008 onwards (top-down communication is well-organized, occurs regularly, and is effective in reaching people), they might have ‘played along’ by reporting strong food crop growth. As the targeted results were reported to have been achieved each year, there was no incentive for responsible bureaucrats to further investigate whether the findings were correct.
The second channel concerns the distinct agricultural data collection system of local government agronomists and the performance contract system which governs their actions. It was shown in section 3.6 that imihigo reports strongly overreported achieved crop-specific land use consolidation and realized yields within these sites (even significantly more than the already inflated crop assessments) and that this continued even after official statistics were adjusted downwards in 2014. This type of false reporting is known to occur in general due to ‘perverse incentives […] connecting data to financial incentives without checks and balances’ (Sandefur & Glassman, Citation2015, p. 129). In particular, from 2008, district governments were given very ambitious land use consolidation as well as yield growth targets. To keep their jobs, local government employees have to perform well (Versailles, Citation2012), which is measured solely in imihigo achievement reports. As a result, public officials often only care about quantified imihigo targets bar any reasonable deliberations (Kathiresan, Citation2012) and are incentivized to tweak the numbers wherever necessary and possible. While there is a thorough annual district imihigo auditing process, auditors have very limited time to check the veracity of reported accomplishments. Both the amount of consolidated land and harvested yields on these sites are hence impossible to verify or falsify. Therefore, district governments had a particularly high incentive to overreport their achievements in this area (and in particular to report full achievement of targets). The Rwandan government was aware of structural problems in the performance contract system, namely unrealistically high targets, inadequate funding and poorly defined indicators, as early as 2010 (Republic of Rwanda, Citation2010). Over the years, evidence of deliberate performance overreporting has been uncovered in various sectors (Huggins, Citation2014, p. 375; Linek, Citation2020, p. 30; Williams, Citation2017, p. 555) and in 2019, systemic imihigo data fabrication by districts was raised as a critical problem by the Rwandan prime minister (Sabiiti, Citation2019).
Now, local government agronomists were aware of biannually conducted crop assessment surveys that independently estimated food crop production, area, and yield, which would allow to compare results of both systems on the district level. The interviewed former senior manager at MINAGRI remarked that district and sector agronomists cannot overreport their achieved results (too strongly), as this would be detected when crop assessment surveys found much smaller production in their area. While it is not clear whether there was a mechanism to actually cross-check results and hold local governments accountable for deviations, the general possibility of such an examination provides an incentive for agronomists to influence crop assessment surveys in their area.
Field enumerators of crop assessment surveys relied on rough eye estimates as well as farmer recall and forecasting estimates regarding yields and production. Peasants were also directly asked for the size of their crop-specific area. Local agronomists who visit peasants regularly can easily tell them how large the area of each crop (supposedly) is and what yield and production they have reached or are about to achieve during each season, relying on their ‘expert’ status. Their estimation results might have even been partially driven by a semi-conscious bias based on the expectation of rising yields due to the increased application of inputs (Desiere et al., Citation2016). Then, both the well-known tendency in Rwanda to not question authority and farmers’ self-interest in telling the government what it wants to hear (and what the local government wants them to say) would result in peasants strongly overreporting (consolidated) area, yield and production.
Additionally, it is easy for district and sector agronomists (and some of their representatives on lower administrative levels) to be informed in real-time which farmers are visited by field enumerators. This is because of the very high population density and the particularity of rural political and societal structures in Rwanda, described by Prunier (Citation1997) as exhibiting an ‘almost monstrous degree of social control’ (p. 3). In particular, there are informal government representatives on the local level that are responsible for the administration of ten households, which means that virtually any relevant event occurring in any rural place can always be known instantaneously by someone connected to the government. This would allow agronomists to remind peasants about their estimates of crop-specific area, yield and production before they answer the questions of field enumerators.
4.3. Potential driver exacerbating overreporting
It is obvious and hardly accidental that the start of the structural overestimation in 2008 coincided with the start of the Crop Intensification Program (CIP) in season 2008A. Furthermore, it is possible that parts of the program were not carefully planned in agricultural strategies beforehand (which is usually the case for well-organized Rwanda) but arose rather spontaneously from the President himself. A special auditor general report on the CIP illustrates that in 2007, Rwanda was suffering from severe food insecurity and that as a result, the President demanded from all ministers involved in rural development to ‘launch […] the green revolution in Rwanda’ and to ‘immediately end hunger’ (Auditor General, Citation2010, p. 8). There appear to exist a few internal government documents describing specific agricultural plans, but only in 2011, i.e. four years after the launch, and only as a result of the auditor general’s lament about the lack of any written text, a CIP strategy document was produced by an external consultant and published by MINAGRI (Kathiresan, Citation2011). Even more, the second Strategic Plan for the Transformation of Agriculture in Rwanda finalized in December 2008 and published in February 2009 hardly mentions the CIP (which started in late 2007) and its main rationales of regional crop specialization and land use consolidation but sets different priorities and goals instead (MINAGRI, Citation2009b). Therefore, it might well have been the case that the President made an ad-hoc decision about extremely ambitious goals and potentially about some measures to achieve them and that the Rwandan governance apparatus rushed to both implement land use consolidation and other reform pillars as thoroughly as possible and to tweak the result reports where necessary.
4.4. Eventual detection and correction
In an ideal world, agricultural statistics and performance monitoring of district imihigo would have immediately detected that reform measures were not effective in raising production and yields. However, the data output of both systems created the illusion that priority crop production levels and yields skyrocketed. Only the introduction of seasonal agricultural surveys by NISR in 2013 revealed massive overestimation. Official statistics were eventually corrected in 2014, meaning that grossly false numbers proliferated for ‘only’ six years. This revision was a result of the transformation of the agricultural data collection and compilation system from a simplistic crop production forecasting exercise highly vulnerable to manipulation into a state-of-the-art seasonal agricultural survey with a sophisticated sampling technique, GPS area measurement, produce weighing, and very timely questionnaires for yield metering. This development was arguably propelled by continuous improvement efforts based on the pursuit of technocratic excellence. Even more, despite all secretiveness deployed in external communication, the inconvenient truth of failing to engineer an Asian-style Green Revolution was internally accepted. Notwithstanding the parallel existence of an imihigo system that still had not adjusted massive overreporting in land use consolidation and yields by 2018 as well as continuously rising food crop GDP numbers, official Rwandan agricultural statistics can be deemed reliable and sufficiently accurate since 2013. The FAO adopts all Rwandan numbers without changing them manually since 2014, and overall as well as crop-specific production, area, and yield numbers have all converged and are now identical for most indicators in Rwandan and FAO datasets.
Without having access to internal communication, the exact process of detection and correction cannot be traced. However, a few interesting things can be pointed out. First, the results of NISR’s initial SAS 2013 were not included in any other document, neither in official MINAGRI numbers (reported to the FAO) nor in the statistical yearbook (even though it is published by NISR as well). Even more, the SAS 2013 report itself tiptoed around the meaning of its results. In its executive summary, it omits its most important results (i.e. production levels and yields) and concentrates on less relevant summary statistics, such as the relative share of different crops across seasons. It also never compares its results with the NAS 2008 or official statistics of 2012. Second, when MINAGRI accepted the SAS 2014 numbers as official, leading to a major break in the time series, this was mentioned nowhere. On the contrary, both MINAGRI annual reports and NISR statistical yearbooks, both of which had published easily comparable time series of the evolution of food crop production and yields in tables and graphs for years, abruptly discontinued them. In its annual report 2014/15, MINAGRI reported low SAS 2015 numbers and compared them to low SAS 2014 numbers, while the statistical yearbooks stopped to contain production numbers at all. Third, Agnes Kalibata, the widely celebrated agriculture minister since 2009, was sacked in July 2014 (around the time the meaning of SAS results would have become clear) and the Rwandan government newspaper associated the firing with dismal performance (Munyaneza, Citation2014).
5. Conclusion
This article has provided new evidence in on-going academic debates on the political economy of post-genocide Rwanda. It has been established that food crop production levels and yields (almost) stagnated in the country from 2005 to 2018. Additionally, substantial evidence for the massive overestimation of production volumes and yields of key food crops from 2008 to 2013 by Rwandan authorities has been provided. This overreporting, it has been argued, originated in the country’s performance contract system that compelled local agronomists to report target achievement in land use consolidation and yield growth independent of actual success. The ruling elite’s unrealistically high expectations coupled with its uncompromising enforcement may have encouraged agronomists to command peasants to report high yield growth results and led farmers to report the numbers that were expected of them on their own account.
It would be incorrect, however, to paint Rwanda’s agricultural reform as a general or total failure. Based on the low-growth path composed of NAS 2008 and SAS 2013–2019 numbers, food crop production volumes and yields were increasing moderately after all. The Rwandan government designed and implemented its agricultural transformation program based on its modernization ideology and by applying performance contracts as a military-style enforcement instrument that does not allow failure or discretion. While this approach was tremendously successful in several other domains, most importantly re-asserting political and social control in the country and impressive state-building (Jones, Citation2014), it has turned out to be inappropriate to handle the complex intricacies of transforming traditional intensive hill-side subsistence agriculture. Nevertheless, the particular practices of the government led to the development of a state-of-the-art agricultural statistics system that endogenously discovered massive food crop overreporting (which, however, was an endogenous product of the Rwandan governance system itself). The authorities built strategic food reserves, heavily invested in and constructed infrastructure for post-harvest storage, transport, and logistics, built agro-processing factories, and devised and implemented value-based export strategies regarding the traditional cash crops coffee and tea as well as new opportunities in horti-, flori-, and sericulture. Many endeavors have not (yet) worked out, but it would be unjust to deny the genuine and enormous efforts of an institutionalized state system to make them work (Chemouni, Citation2019). Furthermore, administrative and decentralization reforms, the universal land titling program, and other measures did make the Rwandan countryside more ‘legible’, which—despite all justified critique on the overzealous social engineering of the country’s ruling elite—is a necessary ingredient of holistic socio-economic development.
Similarly, this article did not argue that Rwanda’s government and its governance system were ineffective or dysfunctional per se. The relevant benchmark cannot be the most successful transforming Asian countries but Rwanda’s own immediate post-genocide situation. When comparing its prospects at that point in time with its current status quo, many accomplishments (not its political and human rights situation) do indeed come close to a miracle. However, the presented evidence on serious flaws in the Rwandan performance contract system regarding agricultural transformation is in line with case studies on Rwanda’s industrial development where the government did not learn from failure and fell short of adapting its policies accordingly as well (Behuria, Citation2018). Therefore, it appears that regarding the complex processes of economic transformation (including agricultural modernization and industrial development), the current imihigo system does not constitute a political economy where organizations, companies, and individuals are encouraged or compelled to learn through failure and adaptation, but rather to pretend to have succeeded. Whether the important but so far cautious developments concerning less rigid policy implementation will transform into a necessary structural reform of Rwanda’s governance and performance contract system is uncertain. Such a revised system would need to allow more deliberation and entail a more effective policy correction mechanism, including the possibility to discuss and criticize processes and goals and to allow occasional failure to learn. Nothing less might be needed if Rwanda wants to achieve its ambitious target of becoming a middle-income country within a generation.
Supplemental Material
Download MS Excel (15.4 KB)Supplemental Material
Download PDF (108.7 KB)Acknowledgements
The author would like to thank Hannah Bargawi, An Ansoms, and three anonymous reviewers for useful comments on earlier drafts. All original data is available upon request.
Disclosure statement
No potential conflict of interest was reported by the author.
Notes
1 There are two main agricultural seasons in Rwanda, which are almost equal in production volume: season A, for which planting starts in mid-September and harvesting takes place from mid-December to mid-February, and season B, where sowing commences in March and harvesting occurs from early June to mid-July (WFP, Citation2016).
2 Many district imihigo can be found online, for example, on the Rwandan Ministry of Finance’s website (MINECOFIN, Citation2021). Additionally, each district has its own website, usually with several performance contracts uploaded.
3 As a result of the rapidly evolving statistics system in Rwanda, there is no single publicly available Rwandan data source that covers the entire period 2005–2018. The data analysis at hand mostly uses numbers from annual reports of MINAGRI (reproducing official crop assessment data) and seasonal agricultural surveys of NISR. For earlier years, data is taken from statistical yearbooks and a report from the Rwanda Environment Management Authority. In general, for most years, statistics from more than one Rwandan source exist, and in the course of this analysis, they have been thoroughly cross-checked regarding internal consistency. Therefore, the herein used numbers robustly represent Rwandan production data sources. A full list of all studied data sources is provided in the appendix.
4 NISR dismissed this conclusion referring to official Rwandan GDP data as evidence for growing food crop production (Senior NISR employee, email communication, May 22, 2021). However, strongly growing food crop GDP data rather points to its unreliability than being proper evidence for high food crop production growth (see section 3.5).
5 NISR stated that they ‘advise to use the 2012 onward level of production data for the concerned crops [i.e. from the SAS 2013] and adjust the series backward to adjust the overestimation in previous years’ (Senior NISR employee, email communication, May 22, 2021). However, they do not do that in any document.
6 The survey itself states that it did not report yields at all because their measurement turned out to be too unreliable (NISR, Citation2008, p. 19).
7 FAO data is available for download on the FAOSTAT website. The original FAO dataset on Rwanda containing old numbers already downloaded in February 2015 was gratefully obtained from Sam Desiere, while the updated one was downloaded in December 2019 by the author. The old version is not available anymore and no explanation on the changes made could be found on the website or in the dataset. The only note that a change has occurred was that the data source for some crops and years was ‘FAO estimate’ instead of ‘Official data’. used the updated FAO data.
8 According to correspondence between NISR and FAOSTAT, the wheat production overestimation in Rwandan data originated from a digit error (FAOSTAT employee, email communication, June 24, 2020). While this is highly doubtful (see section 4), it is remarkable that a significant part of Rwanda’s reputation of agricultural success is supposedly based on a typographical mistake.
9 Sweet potatoes are the only ‘large’ crop that is omitted here but its production output evolution is very similar to the one of beans and does not provide additional insights.
10 NISR rejected this finding, arguing that GDP data compilation, additionally to production data, requires consumption, trade and inventories data (Senior NISR employee, email communication, May 22, 2021). However, this generic statement about the national accounts system does not refute the argument brought forward here.
11 However, as indicated above, there are several factors that weaken the correlation of food crop production volumes and food crop GDP values over time, which means that more precise adjustments cannot be calculated with the available data.
12 See the Supplemental Material for a more detailed analysis and a table of the actual numbers.
13 Annual imihigo targets were set for consolidated area per priority crop and yields on these sites in Joint Agriculture Performance Contracts. MINAGRI’s Backward-Looking Joint Sector Review Report (BLJSRR) 2017/18 contains actual 2018 yield data for the six priority crops and MINAGRI’s annual report 2017/18 depicts realized numbers for consolidated acreage, referring to its ministry imihigo report as source.
14 Crop- and district-specific production microdata of the crop assessments 2007–2009 could be retrieved by using the internet archive Wayback Machine (MINAGRI, Citation2011). This data fit official aggregated crop statistics quite well. In particular, while some data points were off, the large majority fit official national statistics almost perfectly. As a consequence, a deliberate manipulation would have not just required the adaptation of national level data, but of 390 (30 districts × 13 individual crops) data points per season.
References
- Ansoms, A. (2009). Re-engineering rural society: The visions and ambitions of the Rwandan elite. African Affairs, 108(431), 289–309. doi:10.1093/afraf/adp001
- Ansoms, A., Cioffo, G., Dawson, N., Desiere, S., Huggins, C., Leegwater, M., … Van Damme, J. (2018). The Rwandan agrarian and land sector modernisation: Confronting macro performance with lived experiences on the ground. Review of African Political Economy, 45(157), 408–431. doi:10.1080/03056244.2018.1497590
- Auditor General. (2010). Value for money audit report on management of agricultural inputs utilised within crop intensification programme By RADA. Period August 2007–April 2010. Kigali: Office of the Auditor General of State Finances of the Republic of Rwanda.
- Behuria, P. (2018). Examining effectiveness and learning in Rwandan policymaking: The varied outcomes of learning from failure in productive sector policies. Journal of International Development, 30(6), 1023–1043. doi:10.1002/jid.3375
- Booth, D., & Golooba-Mutebi, F. (2012). Developmental patrimonialism? The case of Rwanda. African Affairs, 111(444), 379–403.
- Carletto, C., Jolliffe, D., & Banerjee, R. (2015). From tragedy to renaissance: Improving agricultural data for better policies. The Journal of Development Studies, 51(2), 133–148.
- Chemouni, B. (2014). Explaining the design of the Rwandan decentralization: Elite vulnerability and the territorial repartition of power. Journal of Eastern African Studies, 8(2), 246–262. doi:10.1080/17531055.2014.891800
- Chemouni, B. (2018). The political path to universal health coverage: Power, ideas and community-based health insurance in Rwanda. World Development, 106, 87–98. doi:10.1016/j.worlddev.2018.01.023
- Chemouni, B. (2019). The rise of the economic technocracy in Rwanda: A case of a bureaucratic pocket of effectiveness or state-building prioritisation? (ESID Working Paper Series No. 120). Manchester: The University of Manchester.
- Cioffo, G. D., Ansoms, A., & Murison, J. (2016). Modernising agriculture through a ‘new’ green revolution: The limits of the crop intensification programme in Rwanda. Review of African Political Economy, 43(148), 277–293.
- Desiere, S., Staelens, L., & D’Haese, M. (2016). When the data source writes the conclusion: Evaluating agricultural policies. The Journal of Development Studies, 52(9), 1372–1387.
- Diao, X., Bahiigwa, G., & Pradesha, A. (2014). The role of agriculture in the fast-growing Rwandan economy: Assessing growth alternatives (IFPRI Discussion Paper Series No. 01363). Washington, DC: International Food Policy Research Institute.
- Dusengemungu, L., Dushimimana, J., Mwangi, L., Gasana, A. P., Niyibeshaho, A., & Musabyimana, I. (2013). Monitoring and evaluation of crop intensification program activities in Rwanda. Kigali: Rwanda Agriculture Board.
- FAO. (2016). Revision of the agriculture production data domain in FAOSTAT. Rome: Food and Agriculture Organisation.
- FAO & WFP. (1997). Special report—FAO/WFP crop and food supply assessment mission to Rwanda. Rome, Italy: FAO Global Information and Early Warning System on Food and Agriculture/World Food Programme.
- Golooba-Mutebi, F. (2014). Political economy of agricultural policy in Africa: Has CAADP made a difference? A Rwanda case study (FAC Working Paper Series No. 078). Brighton: Future Agricultures Consortium Secretariat, University of Sussex.
- Harrison, G. (2016). Rwanda: An agrarian developmental state? Third World Quarterly, 37(2), 354–370. doi:10.1080/01436597.2015.1058147
- Huggins, C. D. (2014). ‘Control Grabbing’ and small-scale agricultural intensification: Emerging patterns of state-facilitated ‘agricultural investment’ in Rwanda. The Journal of Peasant Studies, 41(3), 365–384. doi:10.1080/03066150.2014.910765
- IFAD. (2013). Climate resilient post-harvest and agribusiness support project (PASP) including blended adaptation for smallholder agriculture programme grant (ASAP) (No. 1497). Rome: International Fund for Agriculture Development.
- Jerven, M. (2014). The political economy of agricultural statistics and input subsidies: Evidence from India, Nigeria and Malawi. Journal of Agrarian Change, 14(1), 129–145. doi:10.1111/joac.12025
- Jones, W. (2014). Murder and create: State reconstruction in Rwanda since 1994 [Doctoral dissertation]. University of Oxford, Oxford, UK.
- Kathiresan, A. (2011). Strategies for sustainable crop intensification in Rwanda—Shifting focus from producing enough to producing surplus. Kigali: Ministry of Agriculture and Animal Resources.
- Kathiresan, A. (2012). Farm land use consolidation in Rwanda—Assessment from the perspectives of agriculture sector. Kigali: Ministry of Agriculture and Animal Resources.
- Kelly, V., & Donovan, C. (2008). Agricultural statistics in Sub-Saharan Africa: Differences in institutional arrangements and their impacts on agricultural statistics systems. A synthesis of four country case studies. East Lansing, MI: Michigan State University.
- Linek, M. (2020). Measures to influence individual behavior: Four essays in economics [Doctoral dissertation]. Hertie School, Berlin, Germany.
- Manzi, S. (2013). The overview of the multiple frame sample survey in Rwanda. Kigali: National Institute of Statistics Rwanda.
- MINAGRI. (2009a). Crop assessment—2009B season final report. Kigali: Ministry of Agriculture and Animal Resources.
- MINAGRI. (2009b). Strategic plan for the transformation of agriculture in Rwanda—Phase II (PSTA II). Kigali: Ministry of Agriculture and Animal Resources.
- MINAGRI. (2011). Production quantity of primary crops by administrative level 2, commodity, year and season. Retrieved from https://web.archive.org/web/20120513124226/http:/www.countrystat.org/rwa/cont/pxwebquery/ma/184spd311/en/vType/quick
- MINAGRI. (2012). Crop assessment—2012A season final report. Kigali: Ministry of Agriculture and Animal Resources.
- MINAGRI. (2018). Annual report 2017–2018. Kigali: Ministry of Agriculture and Animal Resources.
- MINECOFIN. (2002). Strategic plan for the development of national statistics system 2003–2007. Kigali: Ministry of Finance and Economic Planning.
- MINECOFIN. (2021). IMIHIGO. Retrieved from https://www.minecofin.gov.rw/1/publications/reports?tx_filelist_filelist%5Baction%5D=list&tx_filelist_filelist%5Bcontroller%5D=File&tx_filelist_filelist%5Bpath%5D=%2Fuser_upload%2FMinecofin%2FPublications%2FREPORTS%2FNational_Development_Planning_and_Research%2FIMIHIGO%2F&cHash=ad46c88d815cc9bd563f53081dafddd4
- Munyaneza, J. (2014, July 25). What does the new cabinet bring to the table? The New Times. Retrieved from https://www.newtimes.co.rw
- Newbury, C. (2011). High modernism at the ground level: The Imidugudu policy in Rwanda. In S. Straus & L. Waldorf (Eds.), Remaking Rwanda: State building and human rights after mass violence (pp. 223–239). Madison, WI: University of Wisconsin Press.
- NISR. (2008). National agricultural survey 2008. Kigali: National Institute of Statistics Rwanda.
- NISR. (2012). The system of agricultural statistics in Rwanda (improvement action plan). Kigali: National Institute of Statistics Rwanda.
- NISR. (2013). Seasonal agricultural survey 2013. Kigali: National Institute of Statistics Rwanda.
- Nyabyenda, J. M. V., & Niyonsaba, I. (2009). Rapport PANORAMA I – Sur les Statistiques Agricoles et Alimentaires—RWANDA. Rome: Food and Agriculture Organisation.
- Prunier, G. (1997). The Rwanda crisis: History of a genocide. London: C. Hurst & Co.
- Republic of Rwanda. (2010). Districts Imihigo evaluation report 2009–2010. Kigali: Republic of Rwanda.
- Reyntjens, F. (2013). Political governance in post-genocide Rwanda. Cambridge: Cambridge University Press.
- Sabiiti, D. (2019, January 8). Local leaders ‘lying’ about performance indicators – Premier. KT Press. Retrieved from https://www.ktpress.rw
- Sandefur, J., & Glassman, A. (2015). The political economy of Bad Data: Evidence from African survey and administrative statistics. The Journal of Development Studies, 51(2), 116–132.
- Straus, S., & Waldorf, L. (2011). Remaking Rwanda: State building and human rights after mass violence. Madison, WI: The University of Wisconsin Press.
- Versailles, B. (2012). Rwanda: Performance contracts (Imihigo). London: Budget Strengthening Initiative, Overseas Development Institute (ODI).
- WFP. (2016). Rwanda 2015|Comprehensive food security and vulnerability analysis. Rome: World Food Programme.
- Williams, T. P. (2017). The political economy of primary education: Lessons from Rwanda. World Development, 96, 550–561. doi:10.1016/j.worlddev.2017.03.037
- Wollburg, P., Tiberti, M., & Zezza, A. (2021). Recall length and measurement error in agricultural surveys. Food Policy, 100, 102003.
- World Bank. (2014). Program appraisal document on a proposed credit in the amount of SDR 65.9 million (US$100 million equivalent) to the Republic of Rwanda for the transformation of agriculture sector program phase 3 (No. 89984-RW). Washington, DC: World Bank.
- World Bank. (2019). Future drivers of growth in Rwanda—Innovation, integration, agglomeration, and competition. Washington, DC: World Bank.
Appendix List of Data Sources
Bugesera District Imihigo 2011–2012
Bugesera District Imihigo 2012–2013
FAOSTAT Dataset Rwandan Agricultural Production, Area & Yield Data 2000–2018 (downloaded 10 February 2015)
FAOSTAT Dataset Rwandan Agricultural Production, Area & Yield Data 2000–2018 (downloaded 13 December 2019)
Gakenke District Imihigo 2011–2012
Gakenke District Imihigo 2012–2013
Gakenke District Imihigo 2013–2014
Huye District Imihigo 2011–2012
Huye District Imihigo 2012–2013
Huye District Imihigo 2013–2014
Kicukiro District Imihigo 2011–2012
Kicukiro District Imihigo 2012–2013
Kicukiro District Imihigo 2013–2014
MINAGRI Annual Report 2007
MINAGRI Annual Report 2008
MINAGRI Annual Report 2009/10
MINAGRI Annual Report 2010/11
MINAGRI Annual Report 2011/12
MINAGRI Annual Report 2012/13
MINAGRI Annual Report 2013/14
MINAGRI Annual Report 2014/15
MINAGRI Annual Report 2015/16
MINAGRI Annual Report 2016/17
MINAGRI Annual Report 2017/18
MINAGRI Annual Report 2018/19
MINAGRI Backward Looking Joint Sector Review Report 2008–2009
MINAGRI Backward Looking Joint Sector Review Report 2014–2015
MINAGRI Backward Looking Joint Sector Review Report 2015–2016
MINAGRI Backward Looking Joint Sector Review Report 2017–2018
MINAGRI Backward Looking Joint Sector Review Report 2018–2019
MINAGRI Crop Assessment 2009B
MINAGRI Crop Assessment 2010A
MINAGRI Crop Assessment 2010B
MINAGRI Crop Assessment 2012A
MINAGRI Imihigo 2017–2018
MINAGRI Strategic Plan for Agricultural Transformation in Rwanda (PSTA I)
MINAGRI Strategic Plan for the Transformation of Agriculture in Rwanda—Phase II (PSTA II)
MINAGRI Strategic Plan for the Transformation of Agriculture in Rwanda—Phase III (PSTA III)
MINAGRI Strategic Plan for Agriculture Transformation 2018–2024 (PSTA IV)
MINECOFIN Rapport Final Enquête Intégrale Sur les Conditions de Vie des Ménages au Rwanda (2000–2001) (EICV I)
Muhanga District Imihigo 2011–2012
Muhanga District Imihigo 2013–2014
NISR Agricultural Household Survey 2017
NISR EICV Poverty Analysis for Rwanda’s Economic Development and Poverty Reduction Strategy Final Report (EICV II)
NISR EICV3 Thematic Report Agriculture
NISR Integrated Household Living Conditions Survey 2013/2014 Main Indicators Report (EICV IV)
NISR Integrated Household Living Conditions Survey 2016/2017 Main Indicators Report (EICV V)
NISR National Agricultural Survey 2008
NISR Seasonal Agricultural Survey 2013 version 1
NISR Seasonal Agricultural Survey 2013 version 2
NISR Seasonal Agricultural Survey 2014
NISR Seasonal Agricultural Survey 2015
NISR Seasonal Agricultural Survey 2016
NISR Seasonal Agricultural Survey 2017
NISR Seasonal Agricultural Survey 2018
NISR Seasonal Agricultural Survey 2019
NISR Statistical Yearbook 2008
NISR Statistical Yearbook 2009
NISR Statistical Yearbook 2010
NISR Statistical Yearbook 2011
NISR Statistical Yearbook 2012
NISR Statistical Yearbook 2013
Nyabihu District Imihigo 2012–2013
Nyabihu District Imihigo 2013–2014
Nyamagabe District Imihigo 2011–2012
Nyamagabe District Imihigo 2013–2014
REMA Agricultural Report (n.d.)
Republic of Rwanda Agriculture Joint Imihigo 2015–2016
Republic of Rwanda Agriculture Joint Imihigo 2016–2017
Republic of Rwanda Agriculture Joint Imihigo 2017–2018
Republic of Rwanda Agriculture Joint Imihigo 2018–2019
Republic of Rwanda Districts Imihigo Evaluation Report 2009–2010
Republic of Rwanda Districts Imihigo Evaluation Report 2010–2011
Republic of Rwanda Districts Imihigo Evaluation Report 2011–2012
Republic of Rwanda Districts Imihigo Evaluation Report 2012–2013
Republic of Rwanda Districts Imihigo Evaluation Report 2014–2015
Republic of Rwanda Districts Imihigo Evaluation Report 2015–2016
Republic of Rwanda Districts Imihigo Evaluation Report 2016–2017
Republic of Rwanda Districts Imihigo Evaluation Report 2017–2018
Ruhango District Imihigo 2011–2012
Ruhango District Imihigo 2012–2013
Ruhango District Imihigo 2013–2014
Rusizi District Imihigo 2011–2012
Rusizi District Imihigo 2012–2013