Abstract
In turbulent free-surface flows, the deformation of the surface leads to air bubble entrainment and droplet projections when the turbulent shear stress is greater than the surface tension stress that resists to the interfacial breakup. These complex processes at the water–air interface have been the focus of extensive experimental, numerical and theoretical studies over last two decades and this paper reviews the key advancements. It is highlighted that the recent progress in metrology enables the detailed measurements of a range of air–water flow properties under controlled flow conditions, representing the sine qua non requirement for the development of improved physical understanding and for validating phenomenological and numerical models. The author believes that the future research into aerated flow hydraulics should focus on field measurements of high quality, development of new measurement approaches and data analyses tools, computational fluid dynamics modelling of aerated flows, and the mechanics of aerated flows in conduits.
1. Introduction
In high-velocity free-surface flows, large quantities of air are exchanged at the free-surfaces and the air–water flow becomes a compressible fluid with density ρ w (1−C)+ρ a C ≈ ρ w (1−C), where ρ w is the water density, ρ a is the air density and C is the void fraction. Such flows are encountered in a wide range of applications in chemical, civil, environmental, mechanical, mining and nuclear engineering. In hydraulic engineering, the flow aeration may induce some flow bulking (Falvey 1980, Wood 1985, 1991, Brocchini and Peregrine Citation2001b) and turbulence modulation which might lead to some drag reduction or enhanced turbulent kinetic energy dissipation depending on the flow characteristics. Drag reduction in aerated flows was documented for chute spillways (Jevdjevich and Levin 1953, Wood Citation1983, Chanson Citation1994, Citation2004a) as well as for high-speed submerged bodies with micro-bubble injection (Bogdevich et al. Citation1977, Madavan et al. Citation1984, Marié Citation1987). The aeration of the flow may enhance the rate of energy dissipation in plunging breaking waves (Führboter 1970, Chanson and Lee Citation1997, Hoque and Aoki Citation2005a), and reduce the breakup length of water jets discharging into atmosphere (Héraud 1966, Ervine and Falvey 1987, Augier Citation1996). The air entrainment may also prevent or lessen the damage caused by cavitation (Peterka 1953, Russell and Sheehan Citation1974, Falvey 1990). In relation to environmental processes, it does substantially contribute to the air–water mass transfer of atmospheric gases (Wilhelms and Gulliver 1989, Gulliver 1990, Toombes and Chanson Citation2005). Altogether, it is acknowledged that design engineers must take into account the effects of flow aeration: “Consideration of the effects of entrained air upon water flow may be essential to provide for the safe operation of a hydraulic structure” (Wood 1991); “Self-aeration is by far the most important feature of supercritical flow” (Novak et al. Citation2001).
Since the first successful experiments by Ehrenberger (1926), some major contributions included Straub and Anderson Citation(1958) for supercritical flows, Rajaratnam Citation(1962) and Resch and Leutheusser Citation(1972) for hydraulic jumps, Hoyt and Taylor Citation(1977) for high-speed water jets, Ervine et al. Citation(1980) for plunging jets. Although there have been several experimental studies over the recent decades (see reviews in Wood 1991, Chanson Citation1997a), there have been only a few detailed field measurements. Among these are milestone studies at the Aviemore dam spillway (Keller Citation1972, Cain 1978, Cain and Wood Citation1981a,Citationb) and near-full-scale laboratory experiments of Arreguin and Echavez Citation(1986), Xi (1988) and Chanson Citation(2007a). Importantly, all the experimental investigations highlighted the strong interactions between entrained bubbles and turbulence (Brocchini and Peregrine Citation2001a,Citationb, Citationb) and near-full-scale laboratory experiments of Arreguin and Echavez Citation(1986), Xi (1988) and Chanson Citation(2007a). Importantly, all the experimental investigations highlighted the strong interactions between entrained bubbles and turbulence (Brocchini and Peregrine Citation2001a,Hanratty et al. 2003, Balachandar and Eaton Citation2010). Despite a number of significant advances (Rao and Kobus Citation1971, Wood 1991, Chanson Citation1997a, Brocchini and Peregrine Citation2001b), there are some fundamental issues related to the modelling of aerated flows, turbulence modulation by air bubbles and extrapolation of laboratory and numerical results to full-scale prototype structures (Ervine Citation1998). There are significant needs for detailed field measurements. In this paper, a brief review of aerated flows is first presented. Then, the basic equations and latest advances in the modelling of aerated flows are identified, and the metrology of air–water flows in hydraulic engineering is discussed. The findings emphasize the complexity of the aeration process and address some misunderstandings (qui pro quo). A vision for future research developments concludes the paper.
1.1. Aerated flows in hydraulic engineering
Aerated flows are often observed in low-, medium- and high-head structures, including storm waterways, culverts, dropshafts, spillway chutes, water jets taking off from flip bucket and stilling basins. and illustrate some typical hydraulic engineering applications. Aerated flows are observed in small-scale as well as large-scale flows: from a water jet in a fountain (Q w ∼ 10−3 m3/s, d ∼ 5 mm) to a large spillway during a major flood (Q w >50, 000 m3/s, d>10 m), where Q w is the water discharge and d is the flow thickness. In all cases, the interactions between the entrained air and the flow turbulence are very significant. In –c, the maximum discharge capacity of the three dam spillways is about 65,000, 12,000 and 93,000 m3/s, respectively.
Figure 1. Aerated flows in hydraulic engineering. (a) The Burdekin Falls Dam (Australia) on 3 February 2007 (Courtesy of QLD Department of Environment and Mineral Resources and David Li), (b) the Wivenhoe dam spillway (Australia) on 17 January 2011, (c) the Paradise Dam spillway (Australia) on 30 December 2010 (Courtesy of Bernard Chanson) and (d) the flooding in Marburg (Australia) on 11 January 2011 (Courtesy of Nicole Chanson)
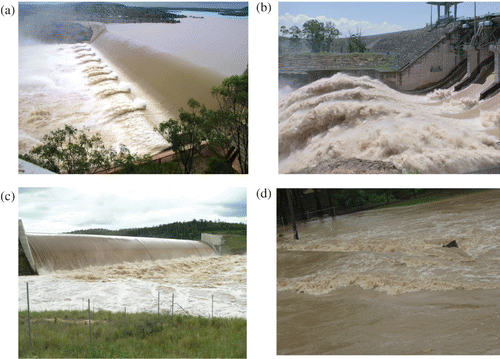
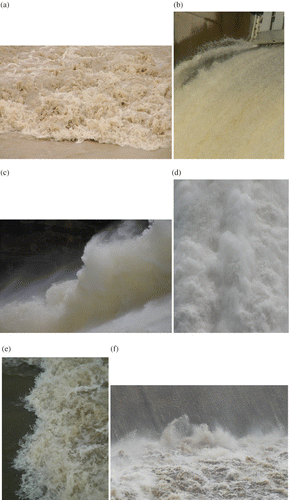
Figure 2. Small-scale flow features of aerated flows in hydraulic engineering: (a) hydraulic jump along Blake Snake Creek at Marburg (Australia) looking downstream on 11 January 2011, (b) the North Pine dam spillway flow (Australia) on 22 May 2009, (c) upper jet free-surface downstream of the Wivenhoe dam spillway flip bucket on 18 October 2010 (Australia) (shutter speed: 1/8,000 s), (d) upper free-surface of bottom outlet flow at the Three Gorges project (China) on 20 October 2004 (V=35 m/s, flow direction from bottom to top), (e) hydraulic jump roller in the Norman Creek culvert at the Ridge Street (Australia) on 20 May 2009 (flow direction from left to right) and (f) hydraulic jump at the toe of the Paradise Dam spillway (Australia) looking upstream on 30 December 2010 (Courtesy of André Chanson)
Most hydraulic engineering applications involve turbulent flows characterized by quasi-random unpredictable behaviour, strong mixing properties and a broad spectrum of velocity fluctuations (Bradshaw 1971, Tennekes and Lumley Citation1972). Aerated flows in hydraulic engineering are extremely complicated with a broad range of relevant length and time scales. The time scales range from less than 1 ms for the turbulence dissipation in a white-water stream to about 24 h and 50 min for the tidal cycle in coastal processes and to more than 50 years for the deep-sea oceanic currents controlling the balances between oxygen and carbon dioxide (Chanson Citation2004b, Bombardelli and Chanson Citation2009).
At the free-surface, the exchange of air and water is driven by the turbulence next to the air–water interface. The free-surface breakup and air entrainment occur when the turbulent shear stress is greater than the surface tension force per unit area resisting the interfacial breakup (Ervine and Falvey 1987, Chanson Citation2009). Once some air is entrained within the bulk of the flow, the break-up of air pockets occurs when the tangential shear stress is greater than the capillary force per unit area (Hinze Citation1955, Chanson Citation2009). As bubbles and droplets are advected by the flow, particle collisions may lead to their coalescence. The entire process is extremely complicated and experimental observations showed a broad range of air and water particle sizes in aerated flows (Halbronn et al. 1953, Thandaveswara Citation1974, Volkart Citation1980, Cummings and Chanson Citation1997b).
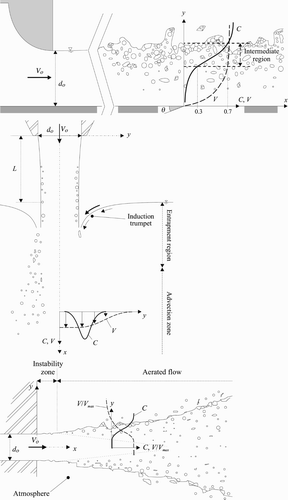
The entrainment of air may be either localized at some flow discontinuity or continuous along the free-surface: i.e. defined, respectively, as singular or interfacial aeration (Chanson Citation1997a). illustrates some seminal interfacial and singular aeration processes, i.e. a self-aerated chute flow downstream of a gate outlet, a vertical plunging jet and a water jet discharging into atmosphere (from top to bottom). shows an example of interfacial aeration above the Wivenhoe dam spillway. Examples of singular aeration are shown in hydraulic jumps at spillway toe and in rivers in flood (, 2a, 2e and 2f). In some applications, the free-surface aeration is maximized (e.g. for re-oxygenation in aeration cascades, drag reduction in naval applications). In other cases, aeration must be minimized or prevented: e.g. industrial jet cutting, fire-fighting. In most hydraulic engineering applications, the aeration is un-controlled ( and ), but the amount of entrained air and its mixing within the flow must be accurately predicted to optimize the system performance and to ensure a safe operation: “For many hydraulic structures, safe operation can only be achieved if not only the characteristics of the water flow are considered, but due attention is also given to the simultaneous movement of air in the system” (Wood 1991).
Figure 3. Sketch of a high-velocity free-surface flow. Top: interfacial aeration downstream of a bottom outlet; Middle: singular aeration at a vertical plunging jet; Bottom: interfacial aeration at a water jet discharging into the atmosphere
Over the last two decades, an increasing number of scientific contributions were published on aerated flow hydraulics. They reflect (a) a broader range of experimental configurations at laboratory scales, (b) availability of advanced off-the-shelf-instrumentation and (c) advancements in signal processing. The development of commercial instrumentation, with manufacturers in America, Asia and Europe, reflects the increased demand from the chemical and nuclear industries, enhancing capabilities of hydraulic laboratories. This trend has been complemented by some developments in basic signal processing (Chanson Citation2002, Chang et al. Citation2003, Chanson and Carosi Citation2007a). These advances provide a greater range of measured parameters (see below), thus improving capabilities for novel experiments and validation of numerical models.
2. Theoretical framework of aerated flows
When there is a sharp interface between immiscible fluids, i.e. air and water herein, the equations governing the multiphase gas–liquid flows at the micro-scale may be derived for each phase, and combined with some interface tracking (Tryggvason et al. 2011). Within a minimum set of restrictions, the equations of fluid motion in a conservative form are
An alternative approach is based upon ensemble-averaged forms Equation(3) and Equation(4)
of the conservation Equationequations (1)
and Equation(2)
for water and air (Drew and Passman 1999):
Although the averaging of the conservation equations for each phase appears to give simpler expressions, a comparison between EquationEqs. (2) and Equation(4)
shows that the ensemble-averaging process adds two new terms in the right-hand side of EquationEq. (4)
. It is necessary, therefore, to derive a number of closure relationships, also called constitutive relationships, which imposes some significant consequences on the mathematical structure of the problem and represents an active research area (Drew and Passman 1999, Bombardelli 2012).
3. Modelling of aerated flows
The analytical and numerical studies of aerated flows in hydraulic engineering are difficult considering the large number of relevant equations, parameters and their complexity. Numerical simulations, which are typically based upon the two-phase N–S equations (i.e. TFM), are very demanding in terms of CPU time and computing facilities. Any solution of the (full) N–S equations in a free-surface air–water flow configuration is a real challenge because of the strong interface deformations and air entrainment (Lubin and Caltagirone Citation2009, Prosperetti and Tryggvason Citation2009). A recent research workshop concluded: “For most engineering applications, solving these equations will be impractical for the foreseeable future” (Hanratty et al. 2003). Current knowledge into aerated flows heavily relies upon laboratory investigations under controlled flow conditions (Wood 1991, Chanson Citation1997a). This is particularly important for on-going developments of numerical models and their validation (Lubin et al. 2009, Sousa et al. 2009, Ma et al. Citation2010, Bombardelli et al. Citation2011).
The validation of a numerical model must be based upon some data sets independent of those used for calibration. A number of studies discussed the intricacy of the validation process (Mehta Citation1998, Roache Citation1998, Rizzi and Vos Citation1998). In a complex situation, typical of aerated flows, the model outputs must be compared with a range of detailed gas–liquid flow properties including the distributions of void fraction, velocity, turbulence intensity and bubble sizes (Chanson and Lubin Citation2010). “Unequivocally […] experimental data are the sine qua non of validation; no experimental data means no validation” (Roache 2009). The validation process must be physically sound as recommended by the American Institute of Aeronautics and Astronautics (AIAA Citation1998, Rizzi and Vos Citation1998, Roache Citation1998). Too many numerical studies lack credibility because they did not represent accurately the flow physics (Mehta Citation1998, Chanson and Lubin Citation2010). A key challenge is the uncertainty present in all physical systems. For example, in aerated flows, the data might be affected by the intrusive nature of the probes. More generally, the experimental data are subject to some intrinsic uncertainty, caused by a combination of technological limitations and accuracy of post-processing tools. The same applies to the numerical data, subjected to modelling, and numerical and round-off errors (Sagaut et al. 2008). An uncertainty analysis must be carried out for both physical and numerical data, and the quality of the validation process is closely linked to both. Many computational fluid dynamics (CFD) analyses to date fail to address the problem. Possibly because only a few mathematical techniques are presently mastered by the scientific community to analyse the results of the sensitivity analysis and to enhance the numerical solution accordingly (Roache Citation1998, 2009, Chanson and Lubin Citation2010).
Experimental investigations of air–water flows are not trivial (Rao and Kobus Citation1971), but some advances in metrology (e.g. phase-detection needle probes) combined with advanced post-processing techniques enable a detailed characterization of high-velocity aerated flows under controlled conditions (Cain and Wood Citation1981a,Citationb, Wood Citation1983,1985). A fundamental issue is the extrapolation of laboratory data to full-scale applications, associated with the selection of dynamic similarity, the usage of self-similarity and the development of theoretical relationships. The implications are broad because of the reliance of analytical and numerical modelling upon physical modelling for validation, especially in the absence of prototype data.
3.1. Dimensional analysis and physical modelling of aerated flows
Any fundamental analysis of aerated flows in hydraulic engineering is based upon a large number of relevant equations to describe the two-phase turbulent flow motion. Physical modelling may provide some insights into the flow motion if a suitable dynamic similarity is selected (Novak and Cabelka Citation1981, Liggett Citation1994). For some singular aeration, the relevant dimensional parameters include the air and water physical properties and constants, the channel characteristics, the inflow conditions and the local two-phase flow properties at a location (x, y, z) (Kobus Citation1984, Wood 1991, Chanson Citation1997a, Citation2009). Considering a vertical circular plunging jet with inflow thickness d o and velocity V o (, middle), a simplified dimensional analysis yields, as a first approximation:
For an interfacial flow such as gated spillway flow in a rectangular chute (, top), a simplified dimensional analysis gives
EquationEquations (5) and Equation(6)
express the turbulent-aerated flow properties at a position (x, y, z) within the gas–liquid flow as functions of a number of dimensionless parameters, including the Froude number
(fourth term in right-hand-side term of Eq. 5), the Reynolds number
(fifth term) and the Morton number
(sixth term), which is a combination of the Froude
, Reynolds
and Weber
numbers:
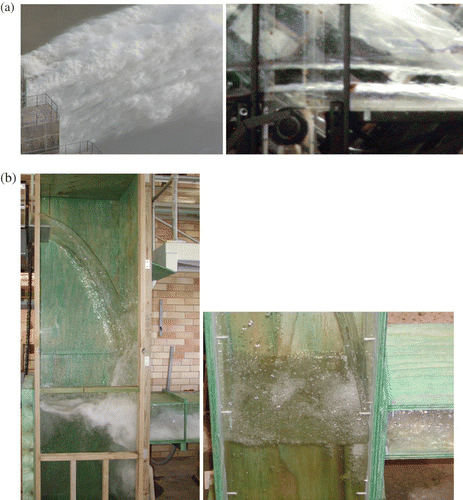
Traditionally, the free-surface flows including plunging jets and self-aerated chute flows are studied based on a Froude similarity (Henderson Citation1966, Liggett Citation1994, Chanson Citation2004b, Viollet et al. 2002). In the particular case of a hydraulic jump, basic momentum considerations demonstrate the significance of the inflow Froude number (Bélanger Citation1841, Lighthill Citation1978) and the selection of the Froude similitude follows implicitly from basic theoretical considerations (Liggett Citation1994, Chanson Citation2012). However, the turbulent shear flows are dominated by viscous effects, while the mechanisms of bubble breakup and coalescence are dominated by surface tension forces. Thus, a true dynamic similarity of aerated flow does require achieving identical Froude, Reynolds and Morton numbers in both the prototype and its model. This is impossible to achieve using geometrically similar models unless working at the full-scale. Practically, the Froude and Morton dynamic similarities are simultaneously employed when the same fluids (air and water) are used in the prototype and model. But the Reynolds number is grossly low in laboratory conditions, thus leading to viscous-scale effects in small-size models typical of hydraulic engineering applications (Kobus Citation1984, Wood 1991, Chanson Citation2009). illustrates two examples: a water jet discharging into atmosphere ( and dropshaft flow (. In each case, a drastic reduction in flow aeration is observed in the smaller model operating at smaller Reynolds numbers for the identical Froude and Morton numbers.
Figure 4. Scale effects in aerated flow situations. Flow direction from left to right on all photographs. (a) Water jet discharging into the atmosphere. Left: the Three Gorges Project, V
o
=35 m/s, V
o
/(gd
o
)1/2=4.2, ρ
w
q
w
/μ
w
=2.8×10⁸, , shutter speed: 1/1,000 s. Right: Laboratory study: V
o
=4.1 m/s, V
o
/(gd
o
)1/2=4.1, ρ
w
q
w
/μ
w
=4.3×10⁵,
. (b) Vertical dropshaft. Left: full-scale, V
o
=1.1 m/s, V
o
/(gd
o
)1/2=1, ρ
w
q
w
/μ
w
=1.4×10⁵,
, shutter speed: 1/30 s. Right: 3.1:1 scale model: V
o
=0.57 m/s, V
o
/(gd
o
)1/2=1, ρ
w
q
w
/μ
w
=1.8×10⁴,
, shutter speed: 1/60 s
Only a few studies systematically investigated the aerated flow properties, at the local sub-millimetre scale, in geometrically similar models under controlled flow conditions to assess the associated-scale effects. These studies were based upon the Froude and Morton similitudes with undistorted models, encompassing vertical plunging jets (Chanson et al. Citation2004), hydraulic jumps (Chanson and Gualtieri Citation2008, Murzyn and Chanson Citation2008, Chanson and Chachereau Citation2013), dropshafts (Chanson Citation2004d), spillway aeration devices (Pfister and Hager Citation2010) and stepped spillways (Boes and Hager Citation2003, Chanson and Gonzalez Citation2005, Felder and Chanson Citation2009). Despite the limited scope, the results of experimental investigations demonstrated unequivocally the limitations of dynamic similarity and physical modelling of aerated flows. They emphasized further that the selection of the criteria to assess scale affects is critical and should involve a range of characteristics such as void fraction distributions, turbulence intensity distributions and distributions of bubble chords (Chanson Citation2009, Chanson and Chachereau Citation2013). The experimental results show that some parameters, such as bubble sizes and turbulent scales, are likely to be affected by scale effects, even in 2:1 to 3:1 scale models (Chanson Citation2004b, Citation2009). No scale effect is observed at full-scale only, using the same fluids in prototype and model, i.e. in prototype flow conditions.
3.2. Self-similarity in aerated flows
If spatial distributions of flow properties at various times (or/and spatial locations) can be obtained from one another by a similarity transformation, then it is said that a process possesses a self-similarity property (Barenblatt Citation1996). Self-similarity is a powerful concept in the turbulent flow research involving a wide spectrum of spatial and temporal scales, and hydraulic engineering applications encompass turbulent flows with a broad range of length and time scales. The non-linear interactions between turbulent vortices and particles at different scales lead to a complicated flow structure, and relationships among flow properties at different scales are of crucial importance (Wang Citation1998, Barenblatt Citation1996). These relationships play also a major role in comparing analytical, experimental and numerical results if these results relate to different scales. In some recent studies, self-similarity was tested systematically in terms of the distributions of air–water flow properties in skimming flows on stepped spillways (Chanson and Carosi Citation2007b, Felder and Chanson Citation2009). Several self-similar relationships were observed at both macroscopic and sub-millimetre scales.
Self-similarity is closely linked to dynamic and kinematic similarities, and the existence of self-similar relationships may have major implications on the measurement strategy in experimental and physical modelling studies (Foss et al. 2007). Although it is nearly impossible to achieve a true dynamic similarity in aerated flows because of the number of relevant dimensionless parameters (see the previous section), these experimental findings showed a number of self-similar relationships that remain invariant under changes of scale. Namely, they have scaling symmetry which in turn led to remarkable applications at prototype scales. These results may provide a picture general enough to be used, as a first approximation, to characterize the aerated flow field in similar hydraulic structures irrespective of the physical scale (Felder and Chanson Citation2009).
3.3. Discussion
The modelling of aerated flows is presently restricted by the complexity of theoretical equations, some limitations of numerical techniques, a lack of full-scale prototype data and very-limited detailed experimental data sets suitable for sound CFD model validation. The implications are far reaching, especially for numerical simulations, i.e. can we trust numerical modelling whose validation is based upon small-size scale-affected laboratory data? The findings of systematic experimental studies demonstrated that (a) the notion of scale effects must be defined in terms of some specific set of gas–liquid characteristics, and (b) some aerated flow properties are more affected by scale effects than others, even in large-size facilities. Interestingly, distorted physical modelling of aerated flows has not been considered to date, although the scale distortion may enable to achieve some similitude in terms of bubble rise velocity on chute spillways and inclined plunging jets.
There are some basic differences between dynamic similarity and self-similarity, and provides some illustration. presents some dimensionless distributions of void fractions in chute spillways, with a selection of the dimensionless terms based upon an undistorted Froude similitude. The results show a close agreement between prototype and model data, although the model Reynolds numbers were an order of magnitude smaller than prototype Reynolds numbers (. In this instance, the findings imply that the laboratory data may be extrapolated, based upon a Froude similitude, to a full-scale with the negligible scale effect. shows some self-similar relationship in terms of interfacial velocity distributions in self-aerated smooth chute flows. The results highlighted a sound self-similarity expressed in the form of a power law for y/Y 90<1 and a uniform profile above:
Figure 5. Froude similar and self-similar data presentation in self-aerated smooth chute flows. Prototype data: the Aviemore dam spillway (Cain 1978); Laboratory data: Straub and Anderson Citation(1958), Xi (1988), Chanson (Citation1989, Citation1997b). (a) Froude similar distributions of void fractions. Comparison with a theoretical model (Chanson Citation1997a). (b) Self-similar interfacial velocity distributions
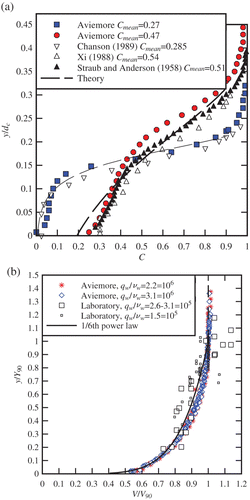
In addition to the dynamic similarity and self-similarity, a further modelling approach may be based upon some theoretical developments leading to theoretically-based equations. An illustration is shown in , in which the void fraction distributions are compared with an analytical solution of the advection–diffusion equation for air bubbles (dashed line in ). Following Rouse Citation(1937) for suspended sediment flows and Wood (1985) for self-aerated chute flows, a number of theoretical void fraction distributions were derived analytically for self-aerated chute flows, water jets discharging into air, plunging jets and hydraulic jumps (Chanson Citation1997a, Citation2008). Recent developments included Chanson and Toombes Citation(2002) for self-aerated skimming flows on stepped spillways, and Chanson Citation(2010) for hydraulic jumps. The existence of theoretical relationships may have some implications for the laboratory studies and measurement methods. For example, for self-aerated chute flows (, the analytical solution of the advection diffusion equation implies that the void fraction distribution is given by C=f(y/Y 90, C mean ), where C mean is the depth-averaged void fraction; this analytical solution implies that no additional measurements are needed in regions of identical mean void fraction C mean for an identical discharge per unit width. Thus, the analytical solutions may allow a drastic reduction of the volume of measurements.
4. Metrology of air–water flows
4.1. Instrumentation
In a free-surface flow, the void fraction ranges from 0 to 100%, and the mass and momentum fluxes are encompassed within the flow region with void fractions less than 95% (Cain 1978, Wood 1985). In this zone (C<0.95), a number of field and laboratory data sets demonstrated that the high-velocity gas–liquid flows behave as a quasi-homogenous mixture and the two phases travel with a nearly identical velocity, i.e. the slip velocity is negligible (Rao and Kobus Citation1971, Cain and Wood Citation1981b, Chanson Citation1997a). Any detailed characterization of the entire gas–liquid flow must rely on instrumentation, applicable and accurate for a wide range of the void fraction levels (0<C<0.95).
In a two-phase air–water flow, a description of the turbulent flow field requires a number of parameters significantly larger than for a monophase flow. The additional parameters include the void fraction, the bubble count rate, the bubble and drop size distributions, the clustering properties. Further, a number of parameters (e.g. instantaneous velocity) cannot be measured with typically available instruments (Pitot tube, acoustic Doppler velocimetry (ADV), laser Doppler velocimetry (LDA)) because the presence of bubbles and air–water interfaces affects adversely their operation. With void fractions less than 3% (or even less), some measurement techniques may be used, although with some empirical corrections: e.g. photography, Pitot tube, ADV, LDA (Sheng and Irons Citation1991, Liu et al. Citation2004). However, the corrections of such type of measurements are highly empirical and rely upon the intrinsic performances of the measurement devices. This “correction” approach should never be used for void fractions larger than 3 to 5%, and it is inappropriate for many free-surface flows in which the local void fractions range up to 100%. Recent developments in particle image velocimetry provided detailed data in dilute disperse flows (Balachandar and Eaton Citation2010), but for the limited flow conditions corresponding to void/liquid fractions less than about 5%.
Some specialized instrumentation was developed during the last 50 years, including back-flushing Pitot tubes, needle phase-detection probes, conical hot-film probes and fibre phase Doppler anemometry. The needle probe and conical hot-film systems are the two oldest techniques. The conical hot-film probes have been used for 40 years with a range of flow conditions, including hydraulic jumps (Resch and Leutheusser Citation1972, Babb and Aus Citation1981), vertical plunging jets (Chanson and Brattberg 1998) and bubble-induced turbulence (Lance and Bataille Citation1991, Rensen et al. Citation2005). A major constraint of the hot-film instrumentation is the calibration of the sensor, as well as the rapid probe contamination requiring systematic re-calibrations (e.g. every three minutes if Brisbane tap water is used) (Chanson and Brattberg 1998). The use of demineralized water may significantly reduce the probe sensor contamination rate, although this restricts drastically the test facility size, hence the Reynolds number. Some pertinent reviews of air–water flow probes and their operational issues include Jones and Delhaye Citation(1976), Cartellier and Achard Citation(1991) and Chanson Citation(2002).
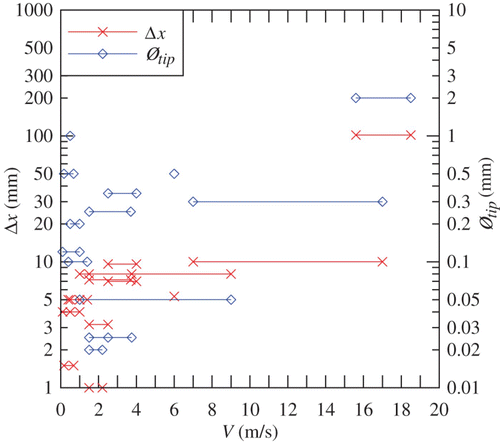
Over the past 40 years, most successful (and most numerous) experiments have been conducted with phase-detection needle probes, including some milestone prototype measurements on the Aviemore dam spillway in New Zealand (Cain and Wood Citation1981a,Citationb). The needle-shaped phase-detection probe is designed to pierce the bubbles and droplets (). It is particularly well-suited to track interfaces, to provide data for the validation of DNS. Since its introduction in experimental practice by Neal and Bankoff (Citation1963, Citation1965), the designs of the needle probe have been refined. Although the first designs were based on resistivity sensors, both optical fibre and resistivity sensors are currently used (Cartellier Citation1992, Chanson Citation2002). In practice, the signal output quality of phase-detection intrusive probes is closely linked to the sensor size, the sampling rate F sampl and sampling duration T sampl . The size of the sensor is basically the needle diameter Ø tip , which is the diameter of the optical fibre or inner electrode. Current measurement systems use sensor sizes less than 0.1 mm at low flow velocities (V<1 to 2 m/s), while the studies of high velocity flows (1<V<20 m/s and higher) require more sturdy probes with diameters typically between 0.1 and 0.5 mm. As an example, the author used 0.025 mm needle probes at flow velocities up to 9 m/s, but the risks of probe damage were high with velocities larger than 3 m/s (Cummings and Chanson Citation1997b, Brattberg and Chanson 1998, Chanson and Brattberg Citation2000); he also used needle probes with inner electrodes between 0.1 and 0.35 mm in highly turbulent flows with velocities up to 18.5 m/s without any trouble (Chanson Citation1989, Citation2002). With a needle probe, the selection of the sampling frequency is linked to the smallest detectable bubble size, which is of the order of magnitude of the needle diameter Ø tip . This yields a minimum sampling frequency to prevent aliasing:
Figure 6. Phase-detection needle-type probes. (a) Double-tip probe (side view and view in elevation). (b) Cluster of five bubbles passing an array of two side-by-side single-tip probes (view in elevation). (c) Instantaneous voltage signal recorded by an array of two side-by-side needle probes. Data: Chanson and Carosi Citation(2007b), d c /h=1.45, ρ w q w t/μ w =1.7×10⁵, step edge 10, y=0.095 m, C=0.022 and F=35.6 Hz (reference probe), V=3.4 m/s, Δ z=3.6 mm
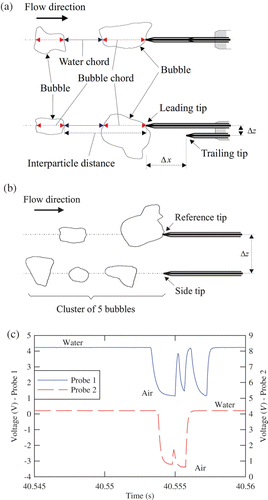
Figure 7. Longitudinal separation distance Δ x and probe sensor size Ø tip of dual tip needle probes. Experimental experiences in prototype (Cain and Wood Citation1981a) and laboratory
While the single-tip and dual-tip needle probe designs are most common, other probe designs were also successfully tested. These include three or four sensor needle probes (Kim et al. Citation2000), a cylindrical probe for cross flow turbine measurements (Borges et al. Citation2010), single-tip probe arrays (Coakley et al. Citation2001, Chanson Citation2004c, 2007b), and other electrical probes (Lamb and Killen Citation1950, Straub and Lamb Citation1956).
4.2. Signal processing
illustrates a typical signal output from an array of two single-tip needle probes similar to the one shown in . In , each steep drop of the signal corresponds to an air bubble interface pierced by the probe tip and the graph shows a group of five bubbles detected by the probes. Although the probe response to bubble piercing should be ideally rectangular, the signal output is not exactly that because of the finite size of the tip, the wetting/drying time of the interface covering the tip and the response time of the probe and electronics. The measured raw signal is typically transformed into a binary time-series of instantaneous void fraction (c=0 in water and 1 in air). Although there are several phase discrimination techniques, the most robust technique for free-surface flows is the single-threshold technique, with a threshold set at 40 to 60% of the air–water range (Toombes 2002, Chanson and Felder 2010, Felder 2013).
In a steady stationary flow, the time-averaged void fraction C is the arithmetic mean of the instantaneous void fraction. The bubble count rate F is the number of bubbles (i.e. water-to-air interfaces) detected by the probe sensor per second. With a dual-tip probe (, the time-averaged velocity is deduced from the cross-correlation function between the probe signals:
Figure 8. Definition sketch of auto- and cross-correlation functions
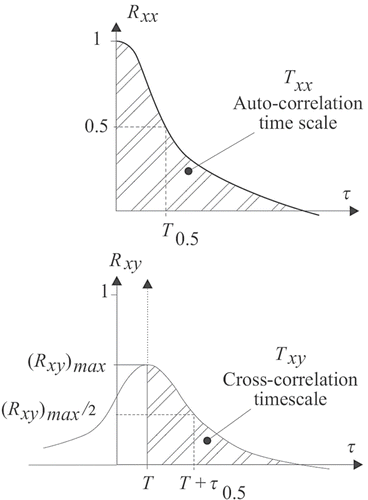
Figure 9. Air-water skimming flow on a stepped spillway in the intermediate region (0.3<C<0.7). Data: Felder and Chanson Citation(2009), θ=21.8°, h=0.05 m, d c /h=2.39, ρ w q w /μ w =1.3×10⁵, step edge 18
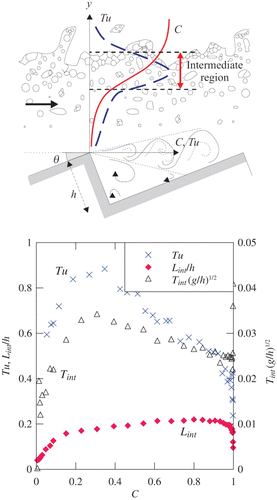
The signal processing of needle probe outcomes may also provide information on the microscopic structure of the gas–liquid flow. Microscopic properties include the distributions of air and water chords at each sampling location, as well as the sequential arrangement of air and water chords (). The latter may allow the characterization of bubble and droplet clustering, including the cluster properties. The study of particle clustering is relevant in industrial applications to infer whether the formation frequency responds to some particular frequencies of the flow. The level of clustering may give a measure of the magnitude of bubble–turbulence interactions and associated turbulent dissipation. In the bubbly flow region (C<0.3), clustering is linked with both turbulent particle clustering and the effects of inertial forces leading to bubble trapping and clustering in large-scale turbulent structures. It may result from the self-excitation of fluctuations of the bubble concentration (Elperin et al. Citation1996) and particle–particle interactions (i.e. near-wake effect). When a bubble is trapped in a vortical structure, the centrifugal pressure gradient moves the bubble inside the coherent structure core where bubble–bubble interactions may further take place (Tooby et al. Citation1977, Sene et al. Citation1994). Note that particle clustering analyses are typically restricted to the bubbly and spray region, C<0.3 and C>0.7, respectively.
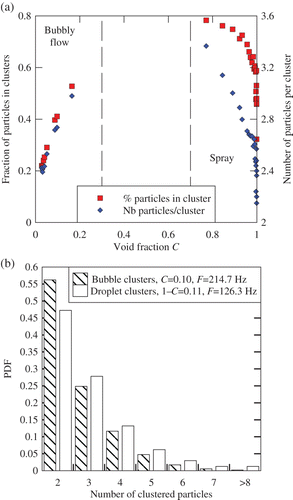
There are two main types of signal analyses to investigate particle clustering. One method is based upon the analysis of the water chord between two adjacent air bubbles. If two particles are closer than a characteristic length scale, they may form a bubble cluster. This characteristic length scale may be related to the water chord statistics or to the lead bubble size itself, since bubbles within that distance are in the near-wake of and influenced by the leading bubble. A number of early studies were conducted in hydraulic jumps, dropshaft flows and stepped spillway flows (Chanson and Toombes Citation2002, Chanson et al. Citation2006, Gualtieri and Chanson 2007, Citation2010). These studies were restricted to the streamwise distribution of bubbles and did not take into account particles travelling side by side or a group of spatially distributed particles (. A recent numerical study using an Eurlerian–Lagrangian approach showed that the longitudinal signal analysis may be representative of the three-dimensional flow (Calzavarini et al. Citation2008). An experimental study of bubbles/droplets using two probes located side by side in skimming flow above a stepped spillway yielded comparable results, although the data highlighted some complex interaction between entrained air and turbulent structures (Sun and Chanson Citation2013). presents some cluster properties in a skimming flow on a stepped spillway, and shows the distribution of number of particles per cluster.
Figure 10. Clustering characteristics in a skimming flow above a stepped chute: bubble clusters in bubbly region (C<0.3) and droplet clusters counted in spray region (C>0.7). Data: Sun and Chanson Citation(2013), Chanson and Carosi Citation(2007b), θ=21.8°, h=0.10 m, d c /h=1.15, ρ w q w /μ w =1.2×10⁵, step edge 10, transverse probe spacing Δ z=3.6 mm. (a) Fraction of particles in clusters (left axis) and average number of particle per cluster (right axis) as functions of void fraction. (b) Probability distribution functions of number of bubbles/droplets per cluster for a comparable void/liquid fraction
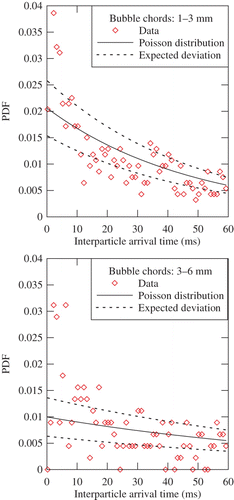
Another method is based upon an analysis of interparticle distance (. In an ideal randomly dispersed flow, the distribution of interparticle distances (and arrival times) follows a Poisson distribution, assuming non-interacting point particles (Edwards and Marx Citation1995a, Noymer Citation2000, Heinlein and Fritsching Citation2006). Any deviation from a Poisson process indicates some non-random dispersed structure, hence particle clustering, and the degree of non-random particle clustering may be quantified by Chi-square tests. For an ideal dispersed flow driven by a superposition of Poisson-distributed bubble sizes, the interparticle time distribution function is
Figure 11. Distributions of interparticle arrival times in a skimming flow above a stepped spillway. Data: Felder and Chanson Citation(2009), θ=21.8°, h=0.05 m, d c /h=2.39, ρ w q w /μ w =1.3×10⁵, step edge 20, y=0.037 m, C=0.073, F=54 Hz. Note that only two classes of bubbles are shown
In some non-stationary flows characterized with low-frequency oscillations, a traditional signal processing would yield some meaningless turbulence levels and turbulent properties. Examples include hydraulic jump flows and self-sustained instabilities in pooled stepped spillway flows. Felder and Chanson Citation(2012) proposed a new signal processing method based upon a triple decomposition of the raw probe signals. The results highlighted that the largest contribution to the turbulent kinetic energy was caused by the slow, long-period fluctuations linked to the flow instabilities. The turbulence properties in terms of fast fluctuating signal component were qualitatively and quantitatively consistent with similar findings of steady stationary air–water flows. In periodic flows, the experiments may be performed over a large number of periods and the results are phase-averaged. A classical application is the air entrainment in breaking waves (Hwung et al. 1992, Cox and Shin Citation2003, Hoque and Aoki Citation2005b). In rapidly-varied unsteady flows, a different signal processing technique must be used. Practical applications encompass air entrainment in dam break waves and breaking tidal bores (Chanson Citation2004c, Citation2005, Docherty and Chanson Citation2010).
5. The future of hydraulics of aerated flows
In turbulent free-surface flows, the deformation of the free-surface leads to some air bubble entrainment and droplet projections. The air–water flow becomes a compressible fluid with density ρ w (1−C)+ρ a C ≈ ρ w (1−C). A number of experimental, numerical and theoretical advancements have been reported over the last two decades. The findings suggest that the physical modelling and laboratory experiments are essential tools to validate phenomenological, theoretical and numerical models (Hanratty et al. 2003). New developments in instrumentation and signal processing enable the measurements of a range of detailed turbulent gas–liquid flow properties under controlled flow conditions, which constitute a sine qua non requirement for clarifying flow physics and model validation (Roache 2009, Chanson and Lubin Citation2010).
What's next? At the microscopic scale, the theoretical equations are relatively straightforward, but for the sharp interface definition (section 2). The interface tracking, the coupling of equations at the air–water interfaces and the correct implementation of the boundary conditions are “not as easy as it may sound in engineering applications” (Bombardelli 2012). These issues are especially true in aerated flows with uncontrolled air–water exchanges and local-averaged void fractions ranging from 0 to 100%. In the author's opinion, the future research into aerated flow hydraulics should focus on Equation(1) field measurements of high quality, Equation(2)
CFD modelling of aerated flows, Equation(3)
the development of signal processing software suites and Equation(4)
the hydraulics of aerated flows in conduits; the first point being the most critical.
5.1. Field measurements of high quality
The single most important drive of future research must come from new field measurements, performed in situ at the full-scale. Forty years on, the Aviemore dam spillway investigations (Keller Citation1972, Cain 1978) remain a key reference because there have been no follow-up detailed prototype measurements. Although a few further prototype observations were conducted, they are mostly qualitative like at the Dachaoshan dam spillway (Lin and Han 2001). The Aviemore dam spillway data sets must be urgently complemented with new field data collected at much larger systems. The flow conditions at the Aviemore dam spillway corresponded to the Reynolds numbers about 2×10⁶, i.e. one to two orders of magnitude lower than the design flow conditions of large spillway systems. The previous discussions on dynamic similarity would suggest that the extrapolation of the Aviemore dam results could be subjected to some form of scale effects at larger Reynolds numbers. Simply, no prototype data means no definite validation of any kind of modelling!
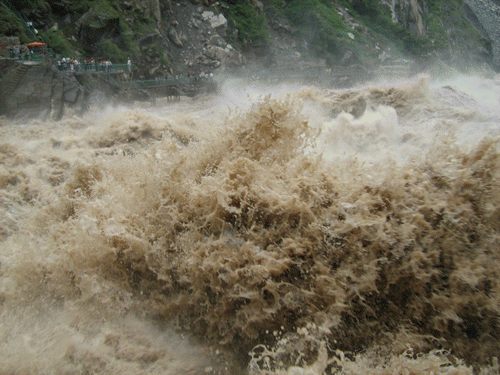
A major challenge of many aerated flows at prototype scale is their three-phase nature that includes water, air and sediments, as illustrated in , with further illustrations in and . In many flood situations, the sediment load is large and thus turbulent modulation in sediment-laden flows cannot be neglected (Jha and Bombardelli Citation2009). Yet, no study was undertaken, to date, in three-phase flow with high sediment and air content despite the high practical relevance.
Figure 12. Three-phase air-water-sediment flow at a prototype scale: Yang-Tse’-Kiang River (China) at Tiger Leaping Gorge in 2009 (Courtesy of Jean-Pierre Girardot)
5.2. CFD modelling of aerated flows
The hydraulics of aerated flows can greatly benefit from the insights provided by numerical simulations, and the last decade has seen the development of powerful numerical capabilities with direct applications into gas–liquid flows (Prosperetti and Tryggvason Citation2009). The CFD modelling may supplement the use of physical models and address the intrinsic limitations of experimental measurements. Despite some works are available (Gonzalez and Bombardelli Citation2005, Sousa et al. 2009, Lubin et al. 2009), most numerical studies of aerated flows are barely addressing the fundamental challenges of physical processes (Bombardelli 2012), while lacking solid validation and verification (Chanson and Lubin Citation2010). For example, most validations are conducted in terms of flow depth and depth-averaged velocity, sometimes including a limited comparison of void fraction and time-averaged velocity distributions. A proper validation of CFD modelling results should be, at the very least, based upon the distributions of void fractions, velocity, turbulence intensity and bubble-droplet chord sizes. It could further include the distributions of turbulent integral length and time scales, as well as the microscopic flow structure (clustering, interparticle distances). A drawback of current CFD methods (DNS, LES) is the computational resources required to complete a simulation and the level of information necessary to describe the system boundary conditions. Based upon a rough approach (Nezu and Nakagawa 1993), a model domain with a grid small enough to capture processes at the Kolmogorov scale (∼ 10−4−10−5 m) would require about 1010 and 1017 mesh points for a small plunging jet and a large spillway flow, respectively. Furthermore, the number of operations required for CFD modelling is proportional to the Reynolds number as for DNS and
for LES (Reynolds 1990, Lesieur Citation1997). Current DNS and LES approaches are restricted to some investigations of turbulent processes in simple geometries with relatively low Reynolds numbers (∼ 105 for DNS) (Prosperetti and Tryggvason Citation2009).
5.3. Development of signal processing software suites
Despite some recent developments in signal processing (see above), very few studies presented systematically detailed air–water turbulent flow properties, with a broad spectrum of turbulent air–water parameters suitable for proper CFD modelling validation. A restriction may be the limited outputs of commercial software packages available with off-the-shelf instrumentation. It is also acknowledged that the data processing may be computationally challenging for samples recorded at high frequency for long durations. The development of open-source software suites and their diffusion among the research community may assist with a more rigorous data outputs, hopefully with enhanced data quality. A standardization of data acquisition systems and binary format outputs might be a first requirement to implement such an approach together with a standardized protocol.
5.4. Hydraulics of aerated flows in conduits
Current research into aerated flows, including the present contribution, focused on free-surface flows with unlimited and uncontrolled air supply. Aerated flows in closed conduits constitute a difficult topic because of some additional constraints (Falvey 1980, Ervine Citation1998). For example, the interactions between the air boundary layers above the flow and at the roof may affect the air entrainment processes (Ervine Citation1998, Speerli Citation1999); the compressibility effects and the supersonic gas–liquid flow conditions must be also taken into account (Cain 1978, Chanson Citation2004e). The available literature is limited, and sometimes provides contradicting results. Altogether, the hydraulics of aerated flow in closed conduits is a whole research topic in its own.
5.5. Concluding remarks
“Turbulence and multiphase flows are two of the most challenging topics in fluid mechanics and when combined they pose a formidable challenge” (Balachandar and Eaton 2010). This is especially true for aerated flows in hydraulic engineering, with high-Reynolds numbers and uncontrolled self-aeration. There remain some critical issues with the validity of extrapolation of physical model results to prototype flow conditions, as well as with the validity of numerical results calibrated with and tested against small-scale laboratory data. A number of recent results demonstrated further that the notion of scale effects is closely linked with the selection of some characteristic turbulent flow property(ies), and true dynamic similarity might not be achieved unless at full scale in some cases (Chanson Citation2009).
Hydraulic engineering professionals and researchers must comprehend that the effects of flow aeration are not solely restricted to flow bulking and re-oxygenation. Further impacts include turbulence modulation, ranging from drag reduction on smooth and stepped chute spillways and turbulent kinetic energy enhancement in hydraulic jumps and breaking waves. The advanced understanding of the physical processes at the millimetre- and micro-scales is critical to any future progress.
The hydraulic research community must ![]() (learn from past mistakes to avoid future ones) and anyone should acknowledge that ex nihilo nihil fit (nothing comes from nothing). Let be no qui pro quo (misunderstanding)! A major research drive into the aerated flow hydraulics is required. The contribution of hydraulic engineers to air–water turbulent flow research has been relatively modest over the last 30 years, after some leading contributions during the 1930s to 1970s (Chanson Citation2007d). A comparison of developments in multiphase flow research and aerated flow hydraulic research suggests that there is a lack of interactions between hydraulic engineering and multiphase flow experts. Less than five hydraulic research groups have regularly contributed to the prestigious International Journal of Multiphase Flow (Elsevier, 2011 Impact Factor=2.23) for the last 20 years. For the same period (1992–2012), only 14 articles of this journal (out of 1866 published articles) cited contributions published by the IAHR Journal of Hydraulic Research or ASCE Journal of Hydraulic Engineering. The 2007 and 2010 editions of the International Conference on Multiphase Flow series attracted 750 and 1100 participants, respectively, with the participation of only two IAHR individuals. The hydraulic engineering field will continue to lag further and further behind the world expertise in gas–liquid flows and aerated flow fluid dynamics, with adverse consequences on the engineering designs with aerated flows, unless researchers and professionals are committed to major advancements in aerated flow research scholarship and cross-discipline collaboration.
(learn from past mistakes to avoid future ones) and anyone should acknowledge that ex nihilo nihil fit (nothing comes from nothing). Let be no qui pro quo (misunderstanding)! A major research drive into the aerated flow hydraulics is required. The contribution of hydraulic engineers to air–water turbulent flow research has been relatively modest over the last 30 years, after some leading contributions during the 1930s to 1970s (Chanson Citation2007d). A comparison of developments in multiphase flow research and aerated flow hydraulic research suggests that there is a lack of interactions between hydraulic engineering and multiphase flow experts. Less than five hydraulic research groups have regularly contributed to the prestigious International Journal of Multiphase Flow (Elsevier, 2011 Impact Factor=2.23) for the last 20 years. For the same period (1992–2012), only 14 articles of this journal (out of 1866 published articles) cited contributions published by the IAHR Journal of Hydraulic Research or ASCE Journal of Hydraulic Engineering. The 2007 and 2010 editions of the International Conference on Multiphase Flow series attracted 750 and 1100 participants, respectively, with the participation of only two IAHR individuals. The hydraulic engineering field will continue to lag further and further behind the world expertise in gas–liquid flows and aerated flow fluid dynamics, with adverse consequences on the engineering designs with aerated flows, unless researchers and professionals are committed to major advancements in aerated flow research scholarship and cross-discipline collaboration.
Notation
| C | = |
average void fraction (−) |
| c | = |
instantaneous void fraction: c=0 in water and c=1 in air (−) |
| d | = |
water depth or jet diameter (m) |
| d ab | = |
bubble size (m) |
| d c | = |
critical flow depth (m) |
| d o | = |
inflow depth (m) |
| F | = |
bubble count rate (Hz) |
| F sampl | = |
sampling frequency (Hz) |
| F | = |
Froude number (−) |
| g | = |
gravity acceleration (m/s2) |
| k s | = |
equivalent sand roughness height (m) |
| L int | = |
turbulent integral length scale (m) |
| Mo | = |
Morton number (−) |
| N c | = |
number of bubble clusters per second (Hz) |
| Q | = |
volume discharge (m3/s) |
| q | = |
discharge per unit width (m2/s) |
| R | = |
Reynolds number (−) |
| R xx | = |
normalized auto-correlation function (−) |
| R xy | = |
normalized cross-correlation function (−) |
| T | = |
characteristic time lag for the cross-correlation function is maximum (s) |
| Tu | = |
turbulence intensity: Tu=v′/V (−) |
| T int | = |
turbulent integral time scale (s) |
| T sampl | = |
sampling duration (−) |
| T xx | = |
auto-correlation integral time scale (s) |
| T xy | = |
cross-correlation integral time scale (s) |
| t | = |
interparticle arrival time (s) |
| V | = |
average velocity (m/s) |
| v | = |
instantaneous velocity (m/s) |
| V c | = |
critical flow velocity (m/s) |
| V o | = |
inflow velocity (m/s) |
| V 90 | = |
characteristic velocity, where C=0.90 (m/s) |
| v′ | = |
turbulent velocity fluctuations (m/s) |
| W | = |
chute width (m) |
| We | = |
Weber number (−) |
| Y 90 | = |
characteristic depth where C=0.90 (m) |
| x | = |
longitudinal coordinate (m) |
| y | = |
vertical coordinate or distance normal to the invert (m) |
| z | = |
transverse coordinate (m) |
| Δ x | = |
longitudinal separation between probe sensor (m) |
| Δ z | = |
transverse separation between probe sensor (m) |
| μ | = |
dynamic viscosity (Pas) |
| ν | = |
kinematic viscosity (m2/s) |
| θ | = |
angle between chute invert and horizontal (−) |
| ρ | = |
density (kg/m3) |
| σ | = |
surface tension (N/m) |
| τ | = |
shear stress (N/m2) |
| Ø tip | = |
probe sensor size (m) |
| = |
Indices | |
| a | = |
air properties |
| c | = |
critical flow conditions |
| o | = |
inflow or nozzle flow conditions |
| w | = |
water properties |
| 90 | = |
characteristic flow conditions for C=0.90 |
Acknowledgements
The author thanks his research students (past and present) and collaborators for their inputs and contributions. This manuscript would not have been possible without their various contributions. The author also acknowledges some helpful exchanges with Professor F.A. Bombardelli (UC Davis) and Professor J. Matos (IST Lisbon). The author also thanks the JHR Editor Professor V. Nikora for his encouragements. The financial support of the Australian Research Council is acknowledged (Grants ARC DP0878922 & DP120100481).
References
- AIAA . 1998 . Guide for the verification and validation of computational fluid dynamics simulations , Reston , VA : American Institute of Aeronautics and Astronautics . AIAA-G-077-1998.
- Arreguin , F. and Echavez , G. 1986 . Natural air entrainment in high velocity flows. Proc. Conf . Advancements in aerodynamics, fluid mechanics and hydraulics , : 186 – 192 . ASCE, Minneapolis, MN, June.
- Augier , P. 1996 . Contribution à l'Etude et à la Modélisation Mécaniste-Statistique de la Distribution Spatiale des Apports d'Eau sous un Canon d'Irrigation: Application à la Caractérisation des Effets du Vent sur l'Uniformité d'Arrosage . PhD. thesis , ENGREF, Montpellier, France (in French).
- Babb , A. F. and Aus , H. C. 1981 . Measurements of air in flowing water . J. Hydraulic Div. , 107 ( HY12 ) : 1615 – 1630 .
- Balachandar , S. and Eaton , J. K. 2010 . Turbulent disperse multiphase flow . Ann. Rev. Fluid Mech. , 42 : 111 – 133 . (doi:10.1146/annurev.fluid.010908.165243)
- Barenblatt , G. I. 1996 . Scaling, self-similarity, and intermediate asymptotics , Cambridge : Cambridge University Press .
- Bélanger, J.B. (1841). Notes sur l'Hydraulique. Ecole Royale des Ponts et Chaussées, Paris, France, session 1841–1842 (in French). Ecole Royal des Ponts et Chaussees.
- Boes , R. M. and Hager , W. H. 2003 . Two-phase flow characteristics of stepped spillways . J. Hydraulic Eng. , 129 ( 9 ) : 661 – 670 . (doi:10.1061/(ASCE)0733-9429(2003)129:9(661))
- Bogdevich, V.G., Evseev, A.R., Mlyuga, A.G., Migirenko, G.S. (1977). Gas-saturation effect on near-wall turbulence characteristics. Proc. 2nd Int. Conf. on Drag reduction, 25–37, BHRA Fluid Engineering, D2, Cambridge, UK.
- Bombardelli, F.A. (2012). Computational multi-phase fluid dynamics to address flows past hydraulic structures. Proc. 4th IAHR Intl. Symp. Hydraulic structures, APRH – Associação Portuguesa dos Recursos Hídricos [Portuguese water resources association], J. Matos, S. Pagliara, I. Meireles, eds. 9–11 February 2012, Porto, Portugal, 2, 19.
- Bombardelli , F. and Chanson , H. 2009 . Progress in the observation and modeling of turbulent multi-phase flows . Env. Fluid Mech. , 9 ( 2 ) : 121 – 123 . (doi:10.1007/s10652-009-9125-8)
- Bombardelli , F. A. , Meireles , I. and Matos , J. 2011 . Laboratory measurements and multi-block numerical simulations of the mean flow and turbulence in the non-aerated skimming flow region of steep stepped spillways . Env. Fluid Mech. , 11 ( 3 ) : 263 – 288 . (doi:10.1007/s10652-010-9188-6)
- Borges , J. E. , Pereira , N. H.C. , Matos , J. and Frizell , K. H. 2010 . Performance of a combined three-hole conductivity probe for void fraction and velocity measurement in air-water flows . Exp. Fluids , 48 : 17 – 31 . (doi:10.1007/s00348-009-0699-1)
- Bradshaw, P. (1971). An introduction to turbulence and its measurement. The Commonwealth and International Library of Science and Technology Engineering and Liberal Studies, Thermodynamics and Fluid Mechanics Division. Pergamon Press, Oxford.
- Brattberg, T., Chanson, H. (1998). Air entrapment and air bubble dispersion at two-dimensional plunging water jets. Chem. Eng. Sci. 53(24), 4113–4127. Errata: (1999). 54(12), 192.
- Brocchini , M. and Peregrine , D. H. 2001a . The dynamics of strong turbulence at free surfaces. Part 1. Description . J. Fluid Mech. , 449 : 225 – 254 . (doi:10.1017/S0022112001006012)
- Brocchini , M. and Peregrine , D. H. 2001b . The dynamics of strong turbulence at free surfaces. Part 2. Free-surface boundary conditions . J. Fluid Mech. , 449 : 255 – 290 . (doi:10.1017/S0022112001006024)
- Cain, P. (1978). Measurements within self-aerated flow on a large spillway. PhD. thesis, Ref. 78–18, Department of Civil Engineering, University of Canterbury, Christchurch, New Zealand.
- Cain , P. and Wood , I. R. 1981a . Instrumentation for aerated flow on spillways . J. Hydraulic Div. , 107 ( HY11 ) : 1407 – 1424 .
- Cain , P. and Wood , I. R. 1981b . Measurements of self-aerated flow on a spillway . J. Hydraulic Div. , 107 ( HY11), 1425– 1444 )
- Calzavarini , E. , Berg , van der T.H. , Toschi , F. and Lohse , D. 2008 . Quantifying microbubble clustering in turbulent flow from single-point measurements . Phys. Fluids , 20 ( 4 ) 040702. doi: 10.1063/1.2911036. (doi:10.1063/1.2911036)
- Carosi , G. and Chanson , H. July 2006 . Air-water time and length scales in skimming flows on a stepped spillway. Application to the spray characterisation , July , Brisbane , , Australia : Division of Civil Engineering, University of Queensland . Report No. CH59/06
- Cartellier , A. 1992 . Simultaneous void fraction measurement, bubble velocity, and size estimate using a single optical probe in gas-liquid tow-phase flows . Rev. Sci. Instrum. , 63 ( 11 ) : 5442 – 5453 . (doi:10.1063/1.1143416)
- Cartellier , A. and Achard , J. L. 1991 . Local phase detection probes in fluid/fluid two-phase flows . Rev. Sci. Instrum. , 62 ( 2 ) : 279 – 303 . (doi:10.1063/1.1142117)
- Chang , K. A. , Lim , H. J. and Su , C. B. 2003 . Fiber optic reflectometer for velocity and fraction ratio measurements in multiphase flows . Rev. Sci. Inst. , 74 ( 7 ) : 3559 – 3565 . (doi:10.1063/1.1578152)
- Chanson , H. 1988 . A study of air entrainment and aeration devices on a spillway model . PhD. thesis , : Ref. 88-8 Department of Civil Engineering, University of Canterbury, New Zealand.
- Chanson , H. 1989 . Flow downstream of an aerator. Aerator spacing . J. Hydraulic Res. , 27 ( 4 ) : 519 – 536 . (doi:10.1080/00221688909499127)
- Chanson , H. 1994 . Drag reduction in open channel flow by aeration and suspended load . J. Hydraulic Res. , 32 ( 1 ) : 87 – 101 .
- Chanson , H. 1997a . Air bubble entrainment in free-surface turbulent shear flows , London , , UK : Academic Press .
- Chanson , H. 1997b . Air bubble entrainment in open channels. Flow structure and bubble size distributions . Int. J. Multiphase Flow , 23 ( 1 ) : 193 – 203 . (doi:10.1016/S0301-9322(96)00063-8)
- Chanson , H. 2002 . Air-water flow measurements with intrusive phase-detection probes. Can we improve their interpretation? . J. Hydraulic Eng. , 128 ( 3 ) : 252 – 255 . (doi:10.1061/(ASCE)0733-9429(2002)128:3(252))
- Chanson , H. 2004a . Drag reduction in skimming flow on stepped spillways by aeration . J. Hydraulic Res. , 42 ( 3 ) : 316 – 322 .
- Chanson , H. 2004b . Environmental hydraulics of open channel flows , Oxford : Elsevier Butterworth-Heinemann .
- Chanson , H. 2004c . Unsteady air-water flow measurements in sudden open channel flows . Exp. Fluid , 37 ( 6 ) : 899 – 909 . (doi:10.1007/s00348-004-0882-3)
- Chanson , H. 2004d . Hydraulics of rectangular dropshafts . J. Irrig. Drain. Eng. , 130 ( 6 ) : 523 – 529 . (doi:10.1061/(ASCE)0733-9437(2004)130:6(523))
- Chanson , H. 2004e . Compressibility of extra-high-velocity aerated flow: A discussion . J. Hydraulic Res. , 42 ( 2 ) : 213 – 215 .
- Chanson , H. 2005 . Air-water and momentum exchanges in unsteady surging waters: An experimental study . Exp. Thermal Fluid Sci. , 30 ( 1 ) : 37 – 47 . (doi:10.1016/j.expthermflusci.2005.03.017)
- Chanson , H. 2007a . Air entrainment processes in rectangular dropshafts at large flows . J. Hydraulic Res. , 45 ( 1 ) : 42 – 53 . (doi:10.1080/00221686.2007.9521742)
- Chanson, H. (2007b). Bubbly flow structure in hydraulic jump. Eur. J. Mech. B/Fluids 26(3), 367–384. Chanson, H. (2007c). Dynamic similarity and scale effects affecting air bubble entrainment in hydraulic jumps. Proc. 6th Int. Conf. Multiphase flow ICMF 2007, Leipzig, Germany, 11, M. Sommerfeld, ed., 9–13 July, Session 7, Paper S7_Mon_B_S7_Mon_B_3.
- Chanson , H. 2007d . Hydraulic engineering in the 21st century: Where to? . J. Hydraulic Res. , 45 ( 3 ) : 291 – 301 . (doi:10.1080/00221686.2007.9521764)
- Chanson , H. 2008 . “ Advective diffusion of air bubbles in turbulent water flows ” . In Fluid mechanics of environmental interfaces , Edited by: Gualtieri , C. and Mihailovic , D. T. 163 – 196 . The Netherlands : Taylor & Francis, Leiden . Chapter 7.
- Chanson , H. 2009 . Turbulent air-water flows in hydraulic structures: Dynamic similarity and scale effects . Env. Fluid Mech. , 9 ( 2 ) : 125 – 142 . (doi:10.1007/s10652-008-9078-3)
- Chanson , H. 2010 . Convective transport of air bubbles in strong hydraulic jumps . Int. J. Multiphase Flow , 36 ( 10 ) : 798 – 814 . (doi:10.1016/j.ijmultiphaseflow.2010.05.006)
- Chanson , H. 2012 . Momentum considerations in hydraulic jumps and bores . J. Irrig. Drain. Eng. , 138 ( 4 ) : 382 – 385 . (doi:10.1061/(ASCE)IR.1943-4774.0000409)
- Chanson , H. , Aoki , S. and Hoque , A. 2004 . Physical modelling and similitude of air bubble entrainment at vertical circular plunging jets . Chem. Eng. Sci. , 59 ( 4 ) : 747 – 754 . (doi:10.1016/j.ces.2003.11.016)
- Chanson , H. , Aoki , S. and Hoque , A. 2006 . Bubble entrainment and dispersion in plunging jet flows: Freshwater versus seawater . J. Coastal Res. , 22 ( 3 ) : 664 – 677 . (doi:10.2112/03-0112.1)
- Chanson, H., Brattberg, T. (1998). Air entrainment by two-dimensional plunging jets: The impingement region and the very-near flow field. Proc. 1998 ASME fluids eng. conf. FEDSM’98, Washington, DC, 8, Paper FEDSM98-4806, 21–25 June.
- Chanson , H. and Brattberg , T. 2000 . Experimental study of the air-water shear flow in a hydraulic jump . Int. J. Multiphase Flow , 26 ( 4 ) : 583 – 607 . (doi:10.1016/S0301-9322(99)00016-6)
- Chanson , H. and Carosi , G. 2007a . Advanced post-processing and correlation analyses in high-velocity air-water flows . Env. Fluid Mech. , 7 ( 6 ) : 495 – 508 . (doi:10.1007/s10652-007-9038-3)
- Chanson , H. and Carosi , G. 2007b . Turbulent time and length scale measurements in high-velocity open channel flows . Exp. Fluids , 42 ( 3 ) : 385 – 401 . (doi:10.1007/s00348-006-0246-2)
- Chanson , H. and Chachereau , Y. 2013 . Scale effects affecting two-phase flow properties in hydraulic jump with small inflow Froude number . Exp. Thermal Fluid Sci. , 45 : 234 – 242 . (doi:10.1016/j.expthermflusci.2012.11.014)
- Chanson, H., Felder, S. (2010). Turbulence measurements in air-water self-aerated flows: Basic analysis and results. Proc. 7th Int. Conf. Multiphase flow ICMF 2010, Tampa, FL, 11, Paper No. 10.3.4, 30 May–4 June.
- Chanson , H. and Gonzalez , C. A. 2005 . Physical modelling and scale effects of air-water flows on stepped spillways . J. Zhejiang Univ. Sci. , 6A ( 3 ) : 243 – 250 . (doi:10.1631/jzus.2005.A0243)
- Chanson , H. and Gualtieri , C. 2008 . Similitude and scale effects of air entrainment in hydraulic jumps . J. Hydraulic Res. , 46 ( 1 ) : 35 – 44 . (doi:10.1080/00221686.2008.9521841)
- Chanson , H. and Lee , J. F. 1997 . Plunging jet characteristics of plunging breakers . Coastal Eng. , 31 ( 1–4 ) : 125 – 141 . (doi:10.1016/S0378-3839(96)00056-7)
- Chanson , H. and Lubin , P. 2010 . Verification and validation of a computational fluid dynamics (cfd) model for air entrainment at spillway aerators . Can. J. Civil Eng. , 37 ( 1 ) : 135 – 138 . (doi:10.1139/L09-133)
- Chanson , H. and Toombes , L. 2002 . Air-water flows down stepped chutes: Turbulence and flow structure observations . Int. J. Multiphase Flow , 28 ( 11 ) : 1737 – 1761 . (doi:10.1016/S0301-9322(02)00089-7)
- Coakley , D. B. , Haldeman , P. M. , Morgan , D. G. , Nicolas , K. R. , Penndorf , D. R. , Wetzel , L. B. and Weller , C. S. 2001 . Electromagnetic scattering from large steady breaking waves . Exp. Fluids , 30 ( 5 ) : 479 – 487 . (doi:10.1007/s003480000220)
- Cox , D. T. and Shin , S. 2003 . Laboratory measurements of void fraction and turbulence in the bore region of surf zone waves . J. Eng. Mech. , 129 ( 10 ) : 1197 – 1205 . (doi:10.1061/(ASCE)0733-9399(2003)129:10(1197))
- Cummings, P.D. (1996). Aeration due to breaking waves. PhD. thesis, Department of Civil Engineering, University of Queensland, Australia.
- Cummings , P. D. and Chanson , H. 1997a . Air entrainment in the developing flow region of plunging jets. Part 1. Theoretical development . J. Fluids Eng. , 119 ( 3 ) : 597 – 602 . (doi:10.1115/1.2819286)
- Cummings , P. D. and Chanson , H. 1997b . Air entrainment in the developing flow region of plunging jets. Part 2. Experimental . J. Fluids Eng. , 119 ( 3 ) : 603 – 608 . (doi:10.1115/1.2819287)
- Docherty , N. J. and Chanson , H. 2010 . Characterisation of unsteady turbulence in breaking tidal bores including the effects of bed roughness , Brisbane , , Australia : University of Queensland . Hydraulic Model Report No. CH76/10, School of Civil Engineering
- Drew, D.A., Passman, S.L. (1998). Theory of multicomponent fluids. Applied mathematical sciences, Vol. 135, 308, J.E. Marsden, L. Sirovich, eds. Springer, New York, NY.
- Edwards , C. F. and Marx , K. D. 1995a . Multipoint statistical structure of the ideal spray, Part I: Fundamental concepts and the realization density . Atom. Spray , 5 : 435 – 455 .
- Edwards , C. F. and Marx , K. D. 1995b . Multipoint statistical structure of the ideal spray, Part II: Evaluating steadiness using the interparticle time distribution . Atom. Spray , 5 : 435 – 455 .
- Ehrenberger, R. (1926). Wasserbewegung in steilen Rinnen (Susstennen) mit besonderer Berucksichtigung der Selbstbelüftung. Zeitschrift des Österreichischer Ingenieur und Architektverein, No. 15/16 and 17/18 (in German).
- Elperin , T. , Kleeorin , N. and Rogachevskii , I. 1996 . Self-excitation of fluctuations of inertial particle concentration in turbulent fluid flow . Phys. Rev. Let. , 77 ( 27 ) : 5373 – 5376 . (doi:10.1103/PhysRevLett.77.5373)
- Ervine , D. A. 1998 . Air entrainment in hydraulic structures: A review . Proc. Instn Civ. Engrs, Water, Maritime & Energy , 130 : 142 – 153 . (doi:10.1680/iwtme.1998.30973)
- Ervine, D.A., Falvey, H.T. (1987). Behaviour of turbulent water jets in the atmosphere and in plunge pools. Proc. Instn Civ. Engrs., London, Part 2, 83, 295–314.
- Ervine , D. A. , McKeogh , E. J. and Elsawy , E. M. 1980 . Effect of turbulence intensity on the rate of air entrainment by plunging water jets . Proc. Instn. Civ. Engrs. , Part 2 ( 69 ) : 425 – 445 . (doi:10.1680/iicep.1980.2545)
- Falvey, H.T. (1980). Air-water flow in hydraulic structures. USBR Engrg. Monograph, No. 41, Denver, CO.
- Falvey, H.T. (1990). Cavitation in chutes and spillways. USBR Engrg. Monograph, No. 42, Denver, CO
- Felder, S. (2013). Air-water flow properties on stepped spillways for embankment dams: Aeration, energy dissipation and turbulence on uniform, non-uniform and pooled stepped chutes. PhD. thesis, University of Queensland, School of Civil Engineering, Australia.
- Felder , S. and Chanson , H. 2009 . Turbulence, dynamic similarity and scale effects in high-velocity free-surface flows above a stepped chute . Exp. Fluids , 47 ( 1 ) : 1 – 18 . (doi:10.1007/s00348-009-0628-3)
- Felder, S., Chanson, H. (2012). Air-water flow measurements in instationary free-surface flows: A triple decomposition technique. Hydraulic Model Report No. CH85/12, School of Civil Engineering, University of Queensland, Brisbane, Australia.
- Foss, J., Panton, R., Yarin, A. (2007). Nondimensional representation of the boundary-value problem. In Springer handbook of experimental fluid mechanics, Part A, Chapter 2. C. Tropea, A. Yarin, J. Foss, eds. Springer, Heidelberg, Germany, 33–83.
- Führboter, A. (1970). Air entrainment and energy dissipation in breakers. Proc. Int. Conf. Coastal Eng. ASCE, Washington DC, USA, 391–398.
- Gonzalez , C. A. 2005 . “ An experimental study of free-surface aeration on embankment stepped chutes ” . In PhD. thesis , Brisbane , , Australia : Department of Civil Engineering, University of Queensland .
- Gonzalez , A. and Bombardelli , F. A. Proc. 31st IAHR Biennial Congress . Seoul , South Korea. Two-phase-flow theoretical and numerical models for hydraulic jumps, including air entrainment ,
- Gualtieri, C., Chanson, H. (2007). Clustering process analysis in a large-size dropshaft and in a hydraulic jump. Proc. 32nd IAHR Biennial Congress, Venice, Italy, G. Di Silvio, S. Lanzoni, eds. Topic C1.b (CD-ROM).
- Gualtieri , C. and Chanson , H. 2010 . Effect of Froude number on bubble clustering in a hydraulic jump . J. Hydraulic Res. , 48 ( 4 ) : 504 – 508 . (doi:10.1080/00221686.2010.491688)
- Gulliver, J.S. (1990). Introduction to air-water mass transfer. Proc. 2nd Int. Symp. Gas transfer at water surfaces, air-water mass transfer, 1–7, S.C. Wilhelms, J.S. Gulliver, eds. ASCE Publications, Minneapolis, MN.
- Halbronn, G., Durand, R., Cohen de Lara, G. (1953). Air entrainment in steeply sloping flumes. Proc. 5th IAHR Congress, IAHR-ASCE, Minneapolis, MN, 455–466.
- Hanratty, T.J., Theofanous, T., Delhaye, J.M., Eaton, J., McLaughlin, J., Prosperetti, A., Sundaresan, S., Tryggvason, G. (2003). Workshop findings. Int. J. Multiphase Flow 29, 1047–1059.
- Heinlein , J. and Fritsching , U. 2006 . Droplet clustering in sprays . Exp. Fluids , 40 ( 3 ) : 464 – 472 . (doi:10.1007/s00348-005-0087-4)
- Henderson , F. M. 1966 . Open channel flow , New York , NY : MacMillan Company .
- Héraud, D. (1966). Dispersion des Jets Liquides; Influence des Rugosités de Paroi. PhD. thesis, University Grenoble 1, France (in French).
- Hinze , J. O. 1955 . Fundamentals of the hydrodynamic mechanism of splitting in dispersion processes . J. AIChE , 1 ( 3 ) : 289 – 295 . (doi:10.1002/aic.690010303)
- Hinze , J. O. 1975 . Turbulence , 2 , New York , NY : McGraw-Hill Publications .
- Hoque , A. and Aoki , S. 2005a . A quantitative analysis of energy dissipation among three typical air entrainment . Env. Fluid Mech. , 5 : 325 – 340 . (doi:10.1007/s10652-005-3258-1)
- Hoque , A. and Aoki , S. I. 2005b . Distributions of void fraction under breaking waves in the surf zone . Ocean Eng. , 32 ( 14–15 ) : 1829 – 1840 . (doi:10.1016/j.oceaneng.2004.11.013)
- Hoyt , J. W. and Taylor , J. J. 1977 . Waves on water jets . J. Fluid Mech. , 83 ( Pt 1 ) : 119 – 127 . (doi:10.1017/S0022112077001074)
- Hwung, H.H., Chyan, J.M., Chung, Y.C. (1992). Energy dissipation and air bubbles mixing inside surf zone. Proc. 23rd Int. Conf. Coastal eng., Venice, Italy, 308–321, Vol. 1, Chapter 22.
- Jevdjevich, V., Levin, L. (1953). Entrainment of air in flowing water and technical problems connected with it. Proc. 5th IAHR Congress, IAHR-ASCE, Minneapolis, MN, 439–454.
- Jha , S. K. and Bombardelli , F. A. 2009 . Two-phase modeling of turbulence in dilute sediment-laden, open channel flows . Env. Fluid Mech. , 9 : 237 – 266 . (doi:10.1007/s10652-008-9118-z)
- Jones , O. C. and Delhaye , J. M. 1976 . Transient and statistical measurement techniques for two-phase flows: A critical review . Int. J. Multiphase Flow , 3 : 89 – 116 . (doi:10.1016/0301-9322(76)90001-X)
- Keller , R. J. 1972 . “ Field measurement of self-aerated high speed open channel flow ” . In PhD. thesis , New Zealand : Department of Civil Engineering, University of Canterbury .
- Kim , S. , Fu , X. Y. , Wang , X. and Ishii , M . 2000 . Development of the miniaturized four-sensor conductivity probe and the signal processing scheme . Int. J. Heat Mass Transfer , 43 : 4101 – 4118 . (doi:10.1016/S0017-9310(00)00046-6)
- Kobus , H. 1984 . “ Scale effects in modelling hydraulic structures. Proc. Int. Symp ” . In Scale effects in modelling hydraulic structures , Germany : Esslingen .
- Lamb , P. and Killen , J. M. 1950 . An electrical method for measuring air concentration in flowing air-water mixtures. Technical Paper No. 2B , Minneapolis , MN : St Anthony Falls Laboratory, University of Minnesota .
- Lance , M. and Bataille , J. 1991 . Turbulence in the Liquid phase of a uniform bubbly air-water flow . J. Fluid Mech. , 222 : 95 – 118 . (doi:10.1017/S0022112091001015)
- Lesieur , M. 1997 . Turbulence in fluids , 3 , Dordrecht , , Germany : Kluwer Academic Publications .
- Lighthill , J. 1978 . Waves in fluids , Cambridge : Cambridge University Press .
- Liggett , J. A. 1994 . Fluid mechanics , New York , NY : McGraw-Hill .
- Lin, K., Han, L. (2001). Stepped spillway for dachaoshan rcc dam. Proc. 29th IAHR Biennial Congress Special Seminar,, Beijing, China, 88–93. P.H. Burgi, J. Gao, eds. SS2 Key Hydraulics Issues of Huge Water Projects.
- Liu , M. , Rajaratnam , N. and Zhu , D. Z. 2004 . Turbulent structure of hydraulic jumps of low froude numbers . J. Hydraulic Eng. , 130 ( 6 ) : 511 – 520 . (doi:10.1061/(ASCE)0733-9429(2004)130:6(511))
- Lubin , P. and Caltagirone , J.-P. 2009 . Large eddy simulation of hydrodynamics generated by breaking waves. In . Advances in numerical simulations of nonlinear water waves , : 575 – 604 . Vol. 11, Chapter 16. Q.W. Ma, ed., Series of Advances in Coastal and Ocean Engineering, World Scientific, Singapore.
- Lubin, P. Glockner, S., Chanson, H. (2009). Numerical simulation of air entrainment and turbulence in a hydraulic jump. Proc. Colloque SHF Modèles Physiques Hydrauliques: Outils Indispensables du XXIe Siècle? Société Hydrotechnique de France, Lyon, France, 24–25 November, 109–114.
- Ma , J. , Oberai , A. A. , Drew , D. A. , Lahey Jr. and Moraga , F. J. 2010 . A quantitative sub-grid air entrainment model for bubbly flows – plunging jets . Comput. Fluids , 39 : 77 – 86 . (doi:10.1016/j.compfluid.2009.07.004)
- Madavan , N. K. , Deutsch , S. and Merkle , C. L. 1984 . Reduction of turbulent skin friction by microbubbles . Phys. Fluids , 27 ( 2 ) : 356 – 363 . (doi:10.1063/1.864620)
- Marié , J. L. 1987 . A simple analytical formulation for microbubble drag reduction . PCH , 8 ( 2 ) : 213 – 220 .
- Mehta , U. B. 1998 . Credible computational fluid dynamics simulations . AIAA J. , 36 ( 5 ) : 665 – 667 . (doi:10.2514/2.431)
- Murzyn , F. and Chanson , H. 2008 . Experimental assessment of scale effects affecting two-phase flow properties in hydraulic jumps . Exp. Fluids , 45 ( 3 ) : 513 – 521 . (doi:10.1007/s00348-008-0494-4)
- Neal , L. S. and Bankoff , S. G. 1963 . A high resolution resistivity probe for determination of local void properties in gas-liquid flows . Am. Inst. Chem. J. , 9 : 49 – 54 . (doi:10.1002/aic.690090111)
- Neal , L. S. and Bankoff , S. G. 1965 . Local parameters in cocurrent mercury-nitrogen flow . Am. Inst. Chem. J. , 11 : 624 – 635 . (doi:10.1002/aic.690110413)
- Nezu, I., Nakagawa, H. (1993). Turbulence in open-channel flows. IAHR Monograph, IAHR Fluid Mechanics Section, Balkema Publications, Rotterdam, The Netherlands.
- Novak , P. and Cabelka , J. 1981 . Models in hydraulic engineering. Physical principles and design applications , London, UK : Pitman Publications .
- Novak , P. , Moffat , A. I.B. , Nalluri , C. and Narayanan , R. 2001 . Hydraulic structures , 2 , London, UK : Spon Press .
- Noymer , P. D. 2000 . The use of single-point measurements to characterise dynamic behaviours in spray . Exp. Fluids , 29 : 228 – 237 . (doi:10.1007/s003489900077)
- Peterka, A.J. (1953). The effect of entrained air on cavitation pitting. Joint Meeting Paper, IAHR/ASCE, Proc. Minnesota International Hydraulic Convention Minneapolis, MN, Aug. 1953, 507–518.
- Pfister , M. and Hager , W. H. 2010 . Chute aerators. I: Air transport characteristics . J. Hydraulic Eng. , 136 ( 6 ) : 352 – 359 . (doi:10.1061/(ASCE)HY.1943-7900.0000189)
- Prosperetti , A. and Tryggvason , G. 2009 . Computational methods for multiphase flows , Cambridge : Cambridge University Press .
- Rajaratnam , N. 1962 . An experimental study of air entrainment characteristics of the hydraulic jump . J. Inst. Eng. India , 42 ( 7 ) : 247 – 273 .
- Rao , N. S.L. and Kobus , H. E. 1971 . Characteristics of self-aerated free-surface flows. Water and waste water/current research and practice , Vol. 10 , Berlin , , Germany : Eric Schmidt Verlag .
- Reif, T.H. (1978). The effects of drag reducing polymers on the turbulence characteristics of the hydraulic jump. Report EW-11-78, US Naval Academy, Annapolis, USA.
- Rensen , J. , Luther , S. and Lohse , D. 2005 . The effect of bubbles on developed turbulence . J. Fluid Mech. , 538 : 153 – 187 . (doi:10.1017/S0022112005005276)
- Resch , F. J. and Leutheusser , H. J. 1972 . Le ressaut hydraulique: Mesure de turbulence dans la région diphasique . J. La Houille Blanche , 4 : 279 – 293 . (in French). (doi:10.1051/lhb/1972021)
- Reynolds, W.C. (1990). The potential and limitations of direct and large eddy simulations. In Whither turbulence? Turbulence at the crossroads, J.L. Lumley, ed. Springer, Lecture Notes in Physics, Vol. 357. Springer, Berlin, Germany, 313–343.
- Rizzi , A. and Vos , J. 1998 . Toward establishing credibility in computational fluid dynamics simulations . AIAA J. , 36 ( 5 ) : 668 – 675 . (doi:10.2514/2.442)
- Roache , P. J. 1998 . Verification of codes and calculations . AIAA J. , 36 ( 5 ) : 697 – 702 . (doi:10.2514/2.457)
- Roache, P.J. (2009). Perspective: Validation – what does it mean? J. Fluids Eng. 131, 034503. doi: 10.1115/1.3077134.
- Rouse , H. 1937 . Modern conceptions of the mechanics of turbulence . Transactions , 102 : 463 – 543 .
- Russell , S. O. and Sheehan , G. J. 1974 . Effect of entrained air on cavitation damage . Can. J. Civil Eng. , 1 : 97 – 107 . (doi:10.1139/l74-008)
- Sagaut, P., Deck, S., Larcheveque, L. (2008). Numerical simulation data: From validation to physical analysis. Proc. 11ème Congrès Francophone de Techniques Laser CFTL 2008, Poitiers Futuroscope, France, 16–19 September, J.M. Most, L. David, F. Penot, L.E. Brizzi, eds. Invited plenary, 29–43.
- Sene , K. J. 1984 . “ Aspects of bubbly two-phase flow ” . In PhD. thesis , Cambridge : Trinity College .
- Sene , K. J. , Hunt , J. C.R. and Thomas , N. H. 1994 . The role of coherent structures in bubble transport by turbulent shear flows . J. Fluid Mech. , 259 : 219 – 240 . (doi:10.1017/S0022112094000108)
- Sheng , Y. Y. and Irons , G. A. 1991 . A combined laser Doppler anemometry and electrical probe diagnostic for bubbly two-phase flow . Int. J. Multiphase Flow , 17 ( 5 ) : 585 – 598 . (doi:10.1016/0301-9322(91)90026-Y)
- Sousa, V., Bombardelli, F.A., Chanson, H. (2009). Numerical simulation of rectangular dropshafts using a volume-of-fluid (VoF) technique. Proc. 33rd IAHR Biennial Congress, IAHR-ASCE-EWRI, Vancouver, Canada, 9–14 August, 7009–7016.
- Speerli , J. 1999 . Strömungsprozesse in grundablassstollen , PhD. thesis, ETH-Zürich, VAW, Switzerland, Dissertation ETHZ No. 12583 (in German).
- Straub , L. G. and Anderson , A. G. 1958 . Experiments on self-aerated flow in open channels . J. Hydraulic Div., , Proc. ASCE. 84(HY7), 1890.
- Straub , L. G. and Lamb , O. P. 1956 . Studies of Air Entrainment in Open-Channel Flows . Transactions, ASCE , 121 : 30 – 44 .
- Sun , S. and Chanson , H. 2013 . Characteristics of clustered particles in skimming flows on a stepped spillway . Env. Fluid Mech. , 13 ( 1 ) : 73 – 87 . (doi:10.1007/s10652-012-9255-2)
- Tennekes , H. and Lumley , J. L. 1972 . A first course in turbulence , The MIT Press, Cambridge, MA.
- Thandaveswara , B. S. 1974 . Self aerated flow characteristics in developing zones and in hydraulic jumps . PhD. thesis, Department of Civil Engineering, Indian Institute of Science, Bangalore.
- Tooby , P. F. , Wicks , G. L. and Isaacs , J. D. 1977 . The motion of a small sphere in a rotating velocity field: A possible mechanism for suspending particles in turbulence . J. Geophys. Res. , 82 ( 15 ) : 2096 – 2100 . (doi:10.1029/JC082i015p02096)
- Toombes, L. (2002). Experimental study of air-water flow properties on low-gradient stepped cascades. PhD. thesis, Department of Civil Engineering, University of Queensland, Brisbane, Australia.
- Toombes , L. and Chanson , H. 2005 . Air-water mass transfer on a stepped waterway . J. Env. Eng. , 131 ( 10 ) : 1377 – 1386 . (doi:10.1061/(ASCE)0733-9372(2005)131:10(1377))
- Tryggvason , G. , Scardovelli , R. and Zaleski , S. 2011 . Direct numerical simulations of gas-liquid multiphase flows , Cambridge : Cambridge University Press .
- Viollet, P.L., Chabard, J.P., Esposito, P., Laurence, D. (2002). Mécanique des Fluides Appliquée. Ecoulements Incompressibles dans les Circuits, Canaux et Rivières, autour des Structures et dans l'Environnement. Presses des Ponts et Chaussées, Paris, France, 2ème édition, 367 (in French).
- Volkart , P. 1980 . The mechanism of air bubble entrainment in self-aerated flow . Int. J. Multiphase Flow , 6 : 411 – 423 . (doi:10.1016/0301-9322(80)90003-8)
- Wang , L. 1998 . Self-similarity of fluid flows . Appl. Phys. Lett. , 73 ( 10 ) : 1329 – 1330 . (doi:10.1063/1.121885)
- Wilhelms, S.C., Gulliver, J.S. (1989). Self-aerating spillway flow. Proc. Natl Conf. Hydraulic engineering, 881–533, M.A. Ports, ed. ASCE, New Orleans.
- Wood , I. R. 1983 . Uniform region of self-aerated flow . J. Hydraulic Eng. , 109 ( 3 ) : 447 – 461 . (doi:10.1061/(ASCE)0733-9429(1983)109:3(447))
- Wood, I.R. (1985). Air water flows. Proc. 21st IAHR Biennial Congress, Melbourne, Australia, Keynote address, 18–29.
- Wood, I.R. (1991). Air entrainment in free-surface flows. IAHR Hydraulic Structures Design Manual No. 4, Hydraulic Design Considerations, Balkema Publications, Rotterdam, The Netherlands.
- Xi, R. (1988). Characteristics of self-aerated flow on steep chutes. Proc. Int. Symp. Hydraulics for high dams, 68–75. IAHR, Beijing, China.
- Zhang , G. , Wang , H. and Chanson , H. 2013 . Turbulence and aeration in hydraulic jumps: Free-surface fluctuation and integral turbulent scale measurements . Env. Fluid Mech. , 13 ( 2 ) : 189 – 204 . (doi:10.1007/s10652-012-9254-3)