
Abstract
The aim of this study was to investigate the motor control strategies adopted when performing two jumping tasks with different task demands when analysed at an individual and group level. Twenty-two healthy individuals performed two jumping tasks: jumping without the use of an arm swing (CMJnas) and jumping starting in a plantar flexed position with the use of an arm swing (PF). Principal component analysis (PCA) was performed using hip, knee and ankle joint moment data on individual (PCAi) and group data (PCAc). The results demonstrate that a greater number of PCs are required to explain the majority of variance within the dataset in the PF condition at both an individual and group level, compared to CMJnas condition. Although common control strategies were observed between the two jumping conditions, differences in the organisation of the movement (PC loading coefficients) were observed. Results from the group analysis did not completely reflect the individual strategies used to perform each jumping task and highlight the value in performing individual analysis to determine emergent control strategies.
Introduction
The process through which humans explore the perceptual motor workspace, as they seek to satisfy task goals by exploring and discovering solutions under the influence of interacting constraints, has long been of interest to researchers in the fields of motor control and motor learning (cf. Chow et al., Citation2008; Newell et al., Citation1989). Much of the focus of researchers has been concerned with understanding how the many degrees of freedom (DOF) available to perform actions are controlled and adapt to alterations in the constraints acting on the performer (Federolf et al., Citation2013; Hong & Newell, Citation2006; Lee et al., Citation2016; Majed et al., Citation2017; Vaillancourt & Newell, Citation2002).
A task constraint which has been shown to affect the control of the DOF is the difficulty of the task, or the demand placed on the performer, with both increases and decreases in DOF observed through application of principal component analysis (PCA) (Cushion et al., Citation2020; Federolf et al., Citation2013; Nordin & Dufek, Citation2016). Geometrically, DOF represent the minimum number of coordinates that can be used to describe the position and orientation of a system. When applying PCA to determine coordinative structures in movement, the term functional DOF (fDOF) has come to be used (Li, Citation2006; Li & Tang, Citation2007; Nordin & Dufek, Citation2016). fDOF refer to the minimum number of principal components (PCs) that are required to explain a high percentage of variance within the data. Within a given movement there may be a high number of DOF, but due to coupling between DOF fewer fDOF are required to describe the coordinative structure of a specific movement (Li & Tang, Citation2007). The inclusion of a task constraint to maintain balance led to an increase in the fDOF required to perform a jumping task compared to two jumping tasks which did not include this task constraint (see Cushion et al., Citation2020). In contrast, Nordin and Dufek (Citation2016) reported a reduction in the available fDOF when participants performed more demanding tasks by landing from increasing heights with increasing external loads. Nordin and Dufek (Citation2016) suggested this motor control strategy may occur due to more motor planning prior to the task and therefore a reduction in automaticity and less flexibility of movement options as shown with a reduction in fDOF. Based on the differences in findings between the two discussed studies, it is likely that the specific demand of the task drives the reduction in DOF. For instance, the demand on the musculoskeletal system when landing from a height (as per the task used by Nordin & Dufek, Citation2016) is greater than required to maintain balance (as used by Cushion et al., Citation2020), which may limit the ability of the system to explore movement options, a consequence which may not be optimal for safe movement execution (Nordin & Dufek, Citation2016). In contrast, jumping with a requirement to maintain balance could encourage movement exploration to maintain this position and this has been demonstrated in other balance movements of high complexity (e.g. one leg standing and tandem standing) (Federolf et al., Citation2013; Ko et al., Citation2003).
The continual fluctuations in constraints operating on the performer results in adjustments to the DOF employed to control actions and explains why human movement is inherently variable both between- and within-individuals (Bernstein, Citation1967; Newell & Corcos, Citation1993). Despite this individual variability, the description of human movement is typically informed by group analyses. Although application of mean data from group analyses provides a description of common motor control strategies, it is limited in that it reflects the collective strategy of a group and may hide relevant individual specific motor strategies (Bartlett et al., Citation2007). Dufek et al. (Citation1995) showed this when analysing individual and group strategies when performing impact activities, including landing and running tasks. Dufek et al. (Citation1995) demonstrated that group analyses, which presented an average across all participants, did not provide an accurate nor representative description of any individual strategies employed by participants. Therefore, appropriate consideration should be given to individual analysis to better understand how motor control strategies are affected by the constraints that shape the perceptual motor workspace. Similarly, within-individual variability across task repetitions should be analysed to examine whether individuals adopt a consistent strategy or whether this changes over time. Examining both within and between participant motor control strategies provides a more holistic and true approach to our understanding of motor behaviour, with such an approach becoming increasingly popular (e.g. Borzelli et al., Citation1999; Dicesare et al., Citation2020; Federolf et al., Citation2013; Gittoes et al., Citation2011; Huber et al., Citation2013; Komar et al., Citation2015; Nordin et al., Citation2017; Raffalt et al., Citation2016; Scholes et al., Citation2012).
In this study, jumping tasks were used to investigate emergent motor control strategies, that is, we were interested in understanding how the system self-organised under differing movement demands. Although individual and group differences have been observed using vertical jumping tasks, this has largely been with the purpose of comparing different demographics such as children and adults (Raffalt et al., Citation2016), or to analyse a specific joint (Ryan et al., Citation2006). We used two jumping tasks (jumping without an arm swing and jumping starting in a plantar flexed position, with the use of an arm swing) that have previously shown the highest and lowest amounts of variability in lower limb joint moment production at a group level which would indicate constraints at specific joints differentially affect the movement outcome (see Cushion et al., Citation2019, Citation2020). Although both jumping tasks provide different biomechanical constraints, either gaining or restricting arm motion or restricting ankle motion, it is suggested that the condition restricting ankle motion and including an arm swing would be a more demanding task. This is due to the additional requirement to balance in an unnatural position prior to the jump, and it is likely that jumping with the use of an arm swing is a more novel movement for most participants. It may also be the case that some participants may be more or less affected by constraints at each joint and thus this may be reflected in the results. This study extends the work by Cushion et al. (Citation2020) and Cushion et al. (Citation2019) and we had several objectives which we assessed using a principal component analysis, which enables the analysis and decomposition of spatiotemporal data (Daffertshofer et al., Citation2004). Our first objective was to compare the organisation of the fDOF in two jumping tasks with differing movement demands and determine how the demand of the task influences the number of fDOF. This was explored at both an individual and group level. It was hypothesised that the task with the higher movement demand, due to the requirement to maintain balance and coordinate both upper and lower limbs (plantar flexed and arm swing condition), would require a greater number of fDOF to describe the variance in the dataset (see Cushion et al., Citation2020; Federolf et al., Citation2013; Ko et al., Citation2017; Lee et al., Citation2016). Our second objective was to determine whether similar strategies were used across both tasks by the same individuals or whether this changed as a function of the change in task constraint. In line with this, we also explored whether distinct coordination strategies observed at a group level reflected individual movement strategies, as has been explored with other movement tasks (Gittoes et al., Citation2011; Scholes et al., Citation2012). Based on previous literature (Cushion et al., Citation2019; Gittoes et al., Citation2011; Scholes et al., Citation2012), it was hypothesised that a similar general pattern of coordination would be observed between the two tasks, but it was expected that results from group analyses would not fully reflect the individual strategies used to carry out the movement tasks.
Methods
Participants
A total of 22 healthy individuals (males = 13, females = 9) volunteered to take part in this study (mean ± SD; age = 26.5 ± 4.7 years, height = 171.3 ± 8.7 cm, body mass 74.1 ± 12.5 kg). Participants were free from musculoskeletal injuries at the time of testing. Details of the study were provided before written informed consent was obtained. The experimental procedure was approved by the ethics sub-committee at the institution where the research took place.
Protocol
Prior to testing, participants’ anthropometric measures (height and weight) were collected and each participant was issued with a standardised shoe of their shoe size. Participants completed a standardised warm up (bodyweight squats, lunges, inchworms, hip rotations and vertical jumps) followed by the attachment of reflective markers. Eighteen reflective markers were placed on the pelvis and on the right lower limb (Cleather et al., Citation2013). Markers were placed on the right and left anterior superior iliac spine and posterior superior iliac spine, lateral and medial femoral epicondyle, apex of lateral and medial malleolus, posterior aspect of calcaneus, tuberosity of fifth metatarsal and head of second metatarsal. Three additional markers placed on rigid plates were attached to the mid-thigh and anterior tibial shaft, with an additional marker attached to the top of the foot (Cleather & Bull, Citation2015).
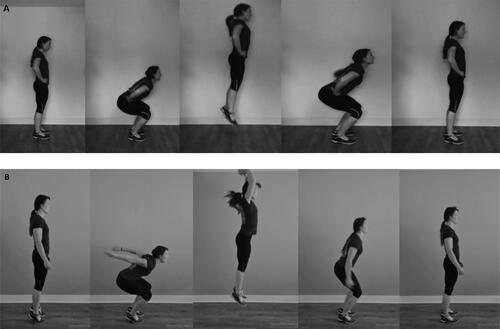
In a randomised order, participants completed five maximal effort countermovement jumps for each jump condition. All five trials were used for further statistical analysis to increase the statistical power of the PCA (see James & Bates, Citation1997), but which ensured a fatigue effect did not impact the results of the analysis. Specifically, participants were asked to complete maximal effort countermovement jumps (i) with no arm swing (nas) (CMJnas), and (ii) starting in a plantar flexed position and with the use of an arm swing (PF), with these particular jumping tasks having been previously employed to investigate motor control strategies by Cushion et al. (Citation2019) and are presented in . Prior to completing any jumps, participants were provided with instructions for the specific condition they were about to complete. Performing a jump without the use of an arm swing required participants to jump with hands in contact with the hips throughout the whole movement. An instruction to jump maximally was also provided prior to all jumping trials. When completing the plantar flexed condition, participants were asked to start the jump in a maximal plantar flexed position, but which allowed them to maintain balance. An instruction to not touch the floor with their heels throughout the jump was also given. Participants were again also instructed to perform all jumps maximally.
Figure 1. Illustration of jumping conditions A = CMJnas and B = PF.
Kinematic data were collected using a Vicon motion capture system (Vicon MX System, Nexus 2.2 software, Vicon Motion Systems Ltd., Oxford, UK) with 14 LED cameras tracking the reflective markers at a sampling frequency of 200 Hz. Kinetic data were collected via two force plates positioned flush to the laboratory floor (Kistler Type 9287BA, Bioware 3.24 software, Kistler Instruments Ltd., Hampshire, UK), at a rate of 1000 Hz and synchronised with the Vicon system.
Data Analysis
The unweighting, braking and propulsive phases of the countermovement jump (McMahon et al. Citation2018), that is from the moment the participant began moving downwards at the start of the jump until the point at which they left the ground, were used for analysis and were defined as being from the point where the right anterior superior iliac spine marker moved below stationary height until take-off (which was defined as the point where the ground reaction force fell to zero). Kinematic and kinetic data were filtered using a 5th order Woltring filter with a cut off frequency of 10 Hz. Hip, knee and ankle net joint moments (NJM) in the sagittal plane were calculated using a standard inverse dynamics calculation (Winter, Citation2005) within the FreeBody software (Cleather & Bull, Citation2015). To standardise trial length between individuals, data were spline interpolated and time normalised from 0 to 101 data points. This data was then used within a PCA.
Statistical Analysis
PCA was used within this study as it has the advantage of retaining the spatiotemporal pattern in the time series data while detecting coordination patterns between each jump condition and between individuals. PCA produces principal components (PCs) which describe a certain percentage of the total variance within the dataset. The first PC accounts for the most amount of variability, with subsequent PCs describing a lesser amount of variability within the data. The PCs represent transformed data into new uncorrelated variables. Only those PCs that cumulatively explained over 90% of the variance in the dataset were retained and used in further analysis (Jolliffe, Citation2002). The output of each PCA produces a coefficients matrix where each column gives the coefficient loadings (loadings) of a PC. The loadings represent how much each variable contributes to the production of a particular PC. In the context of motor control strategies, loadings can provide an indication of how each variable features within a PC. For example, a high-loading value would indicate that variable contributes a greater weighting to the reconstruction of a particular PC, whereas a low-loading value would indicate the opposite. This can be compared at both a group and individual level. PC scores are also examined within the current study and these are obtained from the multiplication of the raw data matrix and coefficients matrix. The PC scores represent the time series of the values for each PC and thus show how the new variable in the new coordinate space evolves over time. Put another way, the PC scores are the linear combination of the variables weighted by the loading coefficients. The PC scores can be used to compare strategies between jumping conditions, where similarities in waveforms would indicate similar strategies are being used to perform the tasks (Santello et al., Citation2002; Thomas et al., Citation2005). Using PC scores and loading coefficients, the original variables can be reconstructed and thus these outputs can show how each of the raw variables can be constructed from a smaller subset of PCs. Within the current study, we also present the sum of the PC scores weighted by the averaged loading coefficients and show the variation of the PC scores about the mean by presenting the standard deviation.
PCA within the current study was applied similarly to the methods proposed by Borzelli et al. (Citation1999). All trials from each jump condition were used within PCA. To assess suitability of data for PCA, Kaiser–Meyer–Olkin and Bartlett tests are sometimes used. However, these tests were not meaningful for this dataset as it was not full rank. The dataset consists of a large number of time series where a very large proportion of the variance can be expressed with a small number of PCs. Prior to running the PCA, all NJM data were normalised to the peak hip joint moment, by dividing all values of the time series by the maximum hip joint moment of each trial to avoid the impact of some variables having greater amplitude than others, which is equivalent to performing PCA on a correlation matrix (Abdi & Williams, Citation2010; Jolliffe & Cadima, Citation2016; Thomas et al., Citation2005). PCA were performed to analyse differences within- and between-individuals and conditions. Before PCA was performed, matrices of data were constructed. Within the current study, columns of the matrix represent NJM time series and rows represent the time normalised intervals. Therefore, for an individual case a matrix containing 101 rows and 15 columns (5 × hip NJM, 5 × knee NJM, 5 × ankle NJM) was constructed (101 × 15). Matrix setups for each PCA performed are illustrated in . PCA were performed in Matlab (The MathWorks, Inc., M A, version 2017a) using the pca function, which also centres the data prior to analyses.
TABLE 1. Description of data used within each PCA.
Data obtained from PCAi was not normally distributed, as determined visually from stem and leaf and Q-Q plots, therefore a Wilcoxon signed rank test was run to compare the number of PCs and the explained variance attributed to each PC between the two jump conditions. To compare loading coefficients between jump conditions, from PCAi, a 2 × 3 ANOVA was performed. Data were normally distributed as determined visually from stem and leaf and Q-Q plots. Data are presented as means ± SD. Statistical analysis was conducted in SPSS (IBM SPSS Statistics 24). The alpha level was set at p < 0.05.
Results
A large percentage of the dataset could be described by only a few PCs for each condition when all the joint moments were included in the same PCA (within-participants analysis: PCAi and between-participant analysis: PCAc). For the within-participant analysis (PCAi), a maximum of three PCs was required to meet the 90% criteria (average of first three PCs: 96.4 ± 1.9%) for the CMJnas condition, whereas a maximum of four PCs was required during the PF condition (average of the first four PCs: 95.5 ± 2.5%). A statistically significant difference was observed between the number of retained PCs between the two jumping conditions for PCAi (Z = −3.477, p = 0.001). At the between-participant level (PCAc), the first four PCs described 92.3% of the variance for CMJnas, and the first five PCs described 90.5% of the variance for PF condition. The within-participant variability increased with an increase in task demand, based on the number of PCs retained to explain over 90% of the dataset and variance explained within each PC ( and ).
Figure 2. Individual (PCAi) and group (PCAc) analysis showing number of PCs required to explain over 90% of the variance for CMJnas and PF. Mean ± SD of the individual analyses is presented for PCAi. *Significant difference between conditions.
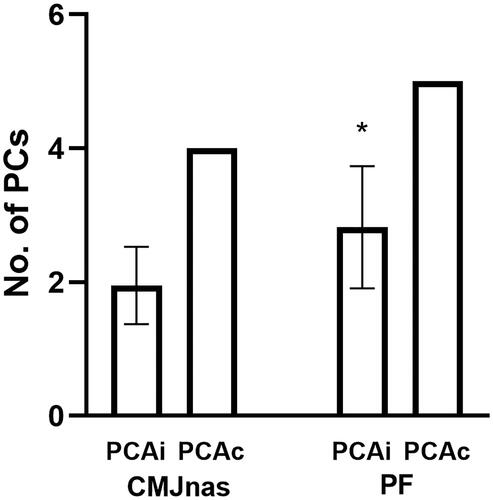
TABLE 2. Within-participant variability only (PCAi) and between participant variability (PCAc) as indicated by the variability explained by the first five PCs for CMJnas and PF.
Significant differences between the explained variance attributed to each PC between the two jump conditions were observed across PC3 to PC5 for PCAi ().
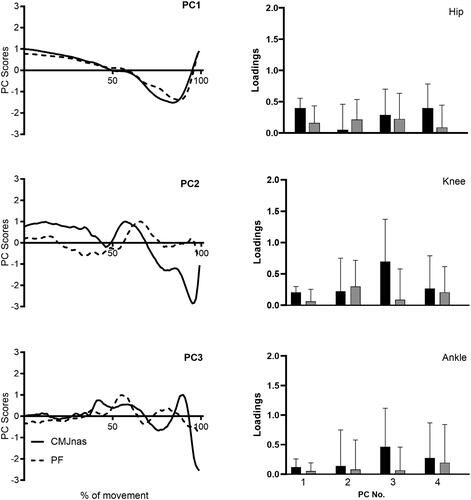
Average PC score waveforms from PCAi for PC1, PC2 and PC3 between jumping conditions (CMJnas and PF) are presented alongside averaged loading coefficients for PC1–PC4, representing the maximum amount of PCs required by any individual to explain over 90% of the variance within the dataset (). A statistically significant difference between the loading coefficients of the two jumping conditions was observed for PC1, F (1,126) = 7.170, p = 0.008; PC2, F (1,126) = 9.125, p = 0.003 and PC3, F (1,126) = 16.030, p = 0.000. No further statistically significant main effects or interactions were observed.
Figure 3. Average PC score waveforms from PCAi for PC1, PC2 and PC3 between CMJnas and PF condition (Left panel). Average individual loading coefficients for hip (top), knee (middle) and ankle (bottom) between CMJnas (black bars) and PF (grey bars) (right panel). Results from PCAi. Data presented as means ± SD.
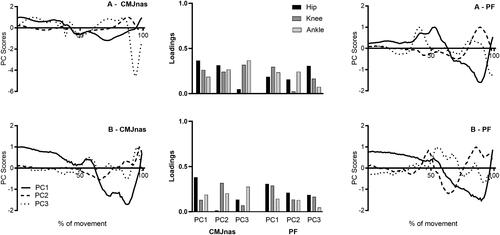
PC score waveforms and loading coefficients are presented for two representative individuals performing CMJnas and PF jumping conditions (). Participant A represents an individual with low explained variance for PC1 (58%) between both jump conditions, whereas participant B represents an individual with high explained variance for PC1 (92%) between both jump conditions.
Figure 4. Individual loading coefficients for hip, knee and ankle across PC1–3 for CMJnas and PF condition (bar chart) and PC score waveforms for CMJnas and PF, from two representative participants. Participant A presented with low-explained variance on PC1 for CMJnas (59%) and PF (58%) and participant B presented with high-explained variance on PC1 for CMJnas (92%) and PF (92%). Comparisons are made between CMJnas (dark grey bar) and PF (light grey bar). Data analysed from PCAi.
The upper and lower boundaries of the variation in the sum of PC scores are presented in for hip, knee and ankle joint moments. A greater amount of variation is observed within the knee and ankle compared to the hip. This variation was similar between the two jump conditions for the knee and ankle, however there was differences in variation between the two jump conditions at the hip. Specifically, more variation was observed in CMJnas compared to PF condition within PC1 and PC2, however greater variation was observed in PC3–PC6 within the PF condition.
Figure 5. Data presented shows upper and lower boundaries of the sum of PC scores weighted by average loading coefficient with ±1SD for CMJnas (dark grey) and PF (light grey) for the hip. (A) PC1, (B) PC1–PC2, (C) PC1–PC3, (D) PC1–PC4, (E) PC1–PC5 and (F) PC1–PC6. Data from PCAch.
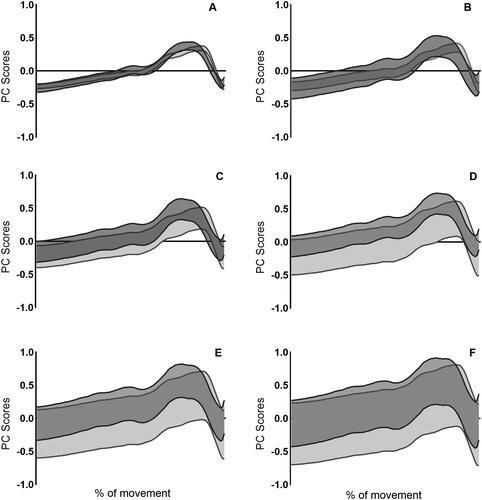
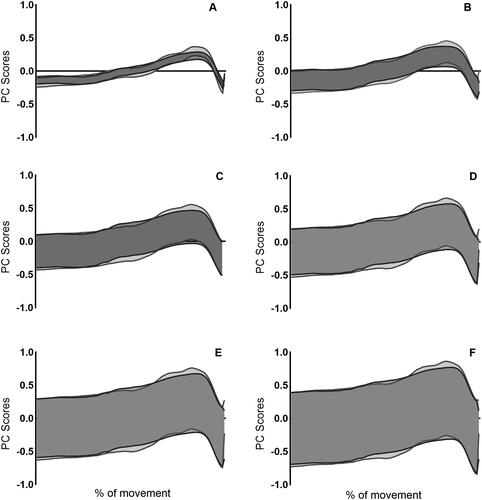
Figure 6. Data presented shows upper and lower boundaries of the sum of PC scores weighted by average loading coefficient with ±1SD for CMJnas (dark grey) and PF (light grey) for the knee. (A) PC1, (B) PC1–PC2, (C) PC1–PC3, (D) PC1–PC4, (E) PC1–PC5 and (F) PC1–PC6. Data from PCAck.

Figure 7. Data presented shows upper and lower boundaries of the sum of PC scores weighted by average loading coefficient with ±1SD for CMJnas (dark grey) and PF (light grey) for the ankle. (A) PC1, (B) PC1–PC2, (C) PC1–PC3, (D) PC1–PC4, (E) PC1–PC5 and (F) PC1–PC6. Data from PCAca.
Discussion
The current study investigated motor control strategies, at both an individual and group level, between two jumping tasks with different task constraints. Specifically, we analysed the lower limb joint moments between a vertical jump with no arm swing and a vertical jump starting in a plantar flexed position with the use of an arm swing, which constrain motion at the lower limb joints. Our two primary objectives were to explore the organisation of the fDOF between the two jumping tasks and determine if motor control strategies differed between the two tasks when analysing data at both a group and participant-specific level. The results show that the restriction of motion at specific lower limb joints influences the number of fDOF. These constraints also impacted the demand of the task with a greater balance and coordination requirement for the PF condition. The PF condition showed the greater number of fDOF compared to the CMJnas condition, which was observed for both individual and group analysis. However, group level analysis was not entirely comparable to individual data. The global motor pattern between the two jumping conditions was very similar when compared at a group level (through comparisons of PC waveforms and loading coefficients), although at an individual level, whereas similarities in the PC score waveforms were observed, there were some differences in the structure of the loading coefficients when observing representative individual data. This would suggest a global pattern of joint moment production is exhibited within jumping tasks, but individuals self-organise such that the strategies used to perform the jumps are not completely the same for each individual. These subtle differences may prove valuable in understanding how factors such as skill level affect production and control of movement. It is probable that the global pattern is driven from anatomical constraints which shape the emergence of movement patterns, rather than a pattern that is learnt, as has previously been suggested (see Cushion et al., Citation2019).
The application of PCA allows for an evaluation of how kinetic variables are weighted within each PC, which provides an indication of the strategies used to perform movement tasks (Daffertshofer & Lamoth, Citation2004; Hong & Newell, Citation2006). PC score waveforms reveal characteristic patterns within each movement task and the loading of a variable describes the degree to which those variables contribute to the production of each PC. Qualitatively, it can be seen that the waveforms for PC1 are very similar between both jumping conditions, when observed at a group level. This indicates the repeatability of this pattern from PC1 in both conditions. The loading coefficients for the hip on PC1 in both jumping conditions are high, compared to the knee and ankle, suggesting for both conditions the hip joint moment waveform contributes most to the explained variance within this PC. That is, to reconstruct the hip moment waveform for both conditions, a higher contribution from PC1 would be required. It is therefore likely this represents a common control strategy, as assessed at a group level, and has been observed in other jumping tasks (Cushion et al., Citation2019, Citation2020). In contrast, the patterns observed for PC2 and PC3 score waveforms are not so well defined between the two jump conditions. In general, the loading coefficients of the knee were higher for PC2 for both conditions. It is notable that the standard deviation is higher from PC2 to PC4 suggesting that these PCs contain greater between participant variation. The ankle loading coefficients were higher for PC3 for the CMJnas, but this was not the case for the ankle for the PF condition until PC4. In comparing the within participant variation for each joint (), greater variation in PF condition can be observed on PC1 at the ankle, compared to the knee and hip, suggesting greater variability at this joint compared to CMJnas condition. This is likely driven by the fact that there was an increase in the requirement to maintain balance during the PF jump compared to the CMJnas condition. At an individual level, there was a greater number of PCs required to capture the characteristics of the data in the PF condition compared to the CMJnas condition. This was also observed at the group level. Given the variability at the individual level, the increased PCs at a group level could reflect the aggregation of variability between individuals or reflect between participant variability. As differences in PC score waveforms and the loading of each joint are observed between individuals it is likely that between participant variability is captured within the increased number of PCs. The addition of PCs required may reflect the ‘recruitment’ of additional DOF to aid in the emergence of new coordination patterns specific for the constraints of the task (Fink et al., Citation2000; Majed et al., Citation2017; Zanone & Kelso, Citation1997). Observations of longer-term practice of this task may provide further insight of the organisation in movement as participants become more familiar with the constraint.
Redundancy within the motor system allows for a range of options to organise multi-joint movements, which may be beneficial to effectively solve and determine the most optimal movement solutions (Yang & Scholz, Citation2005). Using PCA to study movement has the advantage that high-dimensional data is reduced to fewer components describing a high percentage of variance within the whole dataset. The results from the PCA in the current study demonstrated that the task requirement impacts the organisation of the fDOF. The PF condition, which restricted the motion at the ankle and allowed for the use of an arm swing required a greater number of PCs to capture a high percentage of variance within the dataset, at both an individual and group level. This jumping condition is likely to prove more difficult to the participants as it required the challenge of balancing as well as coordinating lower and upper limbs, compared to just a restriction of the arm swing in the CMJnas condition. This finding of an increase in the requirement of fDOF in more demanding tasks is consistent with previous literature (Cushion et al., Citation2020; Federolf et al., Citation2013; Lee et al., Citation2016). Lee et al. (Citation2016) showed at the initiation of learning to ride a unicycle as many as nine PCs were required to explain 90% of the variance within the dataset, with a range between four and nine PCs based on participant specific data. Similarly, when performing three standing tasks of different levels of difficulty (bipedal, tandem and one leg stances), a greater number of PCs were required to explain 90% of the variance in the more difficult stances (tandem and one leg) (Federolf et al., Citation2013). Collectively, these results suggest that greater exploration and utilisation of the DOF is required within more complex tasks to establish coordination modes. However, this was not true for all observations. During landing tasks with increasing mechanical demands (increased load and drop height), the utilisation of the available DOF decreased, as quantified by reduced PCs with increasing task demand (see also Nordin & Dufek, Citation2016). It is possible that the system allows exploration of movement solutions within tasks which are more skill based, rather than tasks which challenge the strength of the musculoskeletal system (as would jumping off a box with added load) (Yeow et al., Citation2009).
Another explanation for the differences in the number of retained PCs in complex tasks could be related to if it is the demand or the constraint of the task which affects the organisation of the movement the most. For example, the constraint imposed on the participants in the PF condition is such that there is a restriction in the range of motion at the ankle and an increase in range of motion of the arms (compared to CMJnas condition), whereas the demand of the task is such that there is an increase in the balance requirement and a challenge to coordinate both the lower and upper limbs. In the task used by Nordin and Dufek (Citation2016), the task constraint does not change greatly between conditions, but the demand of the task increases as the height and added load increases, creating a greater demand on the organisation of the system upon landing. The demand for the task in Nordin and Dufek (Citation2016) study may be such that it did not allow much movement exploration. For the data presented in this study, it is not known at this point if it is the demand (balance) or the constraint of the task (restriction or increase of joint motion) that affects the requirement of fDOF within the task to a greater extent. Disentangling the influence of task constraint and task demand on fDOF is an interesting avenue for future research to consider.
One of the study objectives was to compare group and single participant analysis. Although there are some similarities in the findings, the group analysis alone masks the individual strategies observed when completing the two jumping tasks. In accordance with the group analysis, for both representative individuals, the pattern of PC1 is similar between jump conditions, and the hip joint moment contributes most highly to the explained variance. It is therefore likely that this represents an invariant coordination pattern important to produce jumping movements. As with the group analysis, there were less easily observable trends for PC2 and PC3 and the loading of each joint was not consistent across individuals, demonstrating differences in the organisation of the movements. In addition, neither participant employed the same motor strategies to carry out the two tasks, which would suggest they had to alter motor control strategies to successfully complete the two tasks (DiCesare et al., Citation2020). It is interesting to note when observing the PC waveforms for both jumping conditions, they are similar for participant B who showed the highest explained variance on PC1, but qualitatively different for participant A who showed the lowest explained variance on PC1. It could be that participant A required greater exploration of movement when carrying out the tasks compared to participant B, which has been reflective of differences in skill level (Ko et al., Citation2017; Verrel et al., Citation2013). The characteristics within the data could be described by only one PC for participant B for both conditions, which would suggest a strong coupling between joints. It has previously been suggested that the proximal to distal production of sagittal plane lower limb joint moments can be captured by two fDOF (Cushion et al., Citation2019). Therefore, the requirement of only one PC for participant B would suggest a more synchronous production of lower limb joint moments. Participant A, on the other hand, required between four (CMJnas) or five (PF) PCs to capture the majority of variance. This would suggest this individual required a greater amount of fDOF in order to coordinate and control the DOF of these two tasks, which has been illustrated in individuals less skilled to a task (Ko et al., Citation2017; Winges & Furuya, Citation2015). Collectively, these observations demonstrate that individual strategies do not completely coincide with group strategies, an observation also made by others (Gittoes et al., Citation2011; Scholes et al., Citation2012). This provides support for single participant analysis and the utilisation of PCA within this study has allowed for greater insight into the sources of movement variability as well as the motor control strategies adopted to accommodate the demands of the tasks between individuals.
This study has demonstrated that despite the different constraints on each jumping condition, the system reorganised in such a way that similar coordination patterns emerged under both conditions. This lends support for the notion that this represents a common control strategy under the current constraints. The individual differences in the coefficient loadings on each PC suggest that while there is a global coordination strategy, individual adaptations occur to perform the task based on participant specific as well as task constraints. This research furthers our understanding of how the CNS controls the coordination of the system and demonstrates single-subject analysis is important alongside group analysis to gain a more complete understanding of motor control strategies and may uncover differences in skill levels between individuals. The findings also further demonstrate the utility of PCA in exploring motor control strategies and the organisation of the fDOF.
Disclosure statement
No potential conflict of interest was reported by the author(s).
References
- Abdi, H., & Williams, L. J. (2010). An introduction and review of recent developments of PCA. Wiley Interdisciplinary Reviews: Computational Statistics, 2, 433–459.
- Bartlett, R., Wheat, J., & Robins, M. (2007). Is movement variability important for sports biomechanists? Sports Biomechanics, 6(2), 224–243.
- Bernstein, N. A. (1967). The co-ordination and regulation of movements. Pergamon Press.
- Borzelli, G., Cappizzon, A., & Papa, E. (1999). Inter and intra individual variability of ground reaction forces during sit to stand with principal component analysis. Medical Engineering & Physics, 21, 235–240. https://doi.org/10.1016/S1350-4533(99)00050-8
- Chow, J. Y., Davids, K., Button, C., & Rein, R. (2008). Dynamics of movement patterning in learning a discrete multiarticular action. Motor Control, 12(3), 219–240. https://doi.org/10.1123/mcj.12.3.219.
- Cleather, D. J., & Bull, A. M. J. (2015). The development of a segment based musculoskeletal model of the lower limb: Introducing FreeBody. Royal Society Open Science, 2(6), 140449. https://doi.org/10.1098/rsos.140449
- Cleather, D. J., Goodwin, J. E., and Bull, A. M. J. (2013). Inter-segmental moment analysis characterises the partial correspondence of jumping and jerking. Journal of Strength and Conditioning Research, 27, 89–100. https://doi.org/10.1519/JSC.0b013e31825037ee
- Cushion, E. J., Warmenhoven, J., North, J. S., & Cleather, D. J. (2019). Principal component analysis reveals the proximal to distal pattern in vertical jumping is governed by two functional degrees of freedom. Frontiers in Bioengineering and Biotechnology, 7, 193. https://doi.org/10.3389/fbioe.2019.00193
- Cushion, E. J., Warmenhoven, J., North, J. S. & Cleather, D. J. (2020). Task demand changes motor control strategies in vertical jumping. Journal of Motor Behavior, 1–12. https://doi.org/10.1080/00222895.2020.1797621
- Daffertshofer, A., & Lamoth, C. J. C. (2004). PCA in studying coordination and variability: A Tutorial. Clinical Biomechanics (Bristol, Avon), 19, 415–428. https://doi.org/10.1016/j.clinbiomech.2004.01.005
- Daffertshofer, A., Lamoth, C. J., Meijer, O. G., & Beek, P. J. (2004). PCA in studying coordination and variability: a tutorial. Clinical Biomechanics, 19(4), 415–428.https://doi.org/10.1016/j.clinbiomech.2004.01.005
- Dicesare, C. A., Minai, A. A., Riley, M. A., Ford, K. R., Hewett, T. E., & Myer, G. D. (2020). Distinct coordination strategies associated with the drop vertical jump task. Medicine & Science in Sports & Exercise, 52(5), 1088–1098. https://doi.org/10.1249/MSS.0000000000002235
- Dufek, J. S., Bates, B. T., Stergiou, N., & James, C. R. (1995). Interactive effects between group and single-subject response patterns. Human Movement Science, 14, 301–323. https://doi.org/10.1016/0167-9457(95)00013-I
- Federolf, P., Roos, L., & Nigg, B. M. (2013). Analysis of the multi-segmental postural movement strategies utilized in bipedal, tandem and one leg stance as quantified by a principal component decomposition of marker coordinates. Journal of Biomechanics, 46(15), 2626–2633. https://doi.org/10.1016/j.neulet.2007.05.051
- Fink, P. W., Kelso, J. A., Jirsa, V. K., & De Guzman, G. (2000). Recruitment of degrees of freedom stabilizes coordination. Journal of Experimental Psychology: Human Perception and Performance, 26(2), 671. https://doi.org/10.1037/0096-1523.26.2.671.
- Gittoes, M. J., Irwin, G., Mullineaux, D. R., & Kerwin, D. G. (2011). Whole-body and multi-joint kinematic control strategy variability during backward rotating dismounts from beam. Journal of Sports Sciences, 29(10), 1051–1058. https://doi.org/10.1080/02640414.2011.576690
- Hong, S. L. & Newell, K. M. (2006). Change in the organisation of degrees of freedom with learning. Journal of Motor Behavior, 38(2), 88–100. https://doi.org/10.3200/JMBR.38.2.88-100.
- Huber, C., Federolf, P., Nüesch, C., Cattin, P. C., Friederich, N. F., & von Tscharner, V. (2013). Heel-strike in walking: Assessment of potential sources of intra- and inter-subject variability in the activation patterns of muscles stabilizing the knee joint. Journal of Biomechanics, 46(7), 1262–1268. https://doi.org/10.1016/j.jbiomech.2013.02.017
- James, C. R. & Bates, B. T. (1997). Experimental and statistical design issues in human movement research. Measurement in Physical Education and Exercise Science, 1(1), 55–69. https://doi.org/10.1207/s15327841mpee0101_4
- Jolliffe I. T. (2002). Graphical representation of data using principal components. In I. T. Joliffe (Ed.), Principal component analysis. Springer series in statistics (2nd ed., pp. 78–110). Springer. https://doi.org/10.1007/0-387-22440-8_5
- Jolliffe, I. T., & Cadima, J. (2016). Principal component analysis: A review and recent developments. Philosophical Transactions Series A Mathematical, Physical, and Engineering Sciences, 374, 20150202. https://doi.org/10.1098/rsta.2015.0202
- Ko, J. H., Han, D. W., & Newell, K. M. (2017). Skill level constrains the coordination of posture and upper-limb movement in a pistol-aiming task. Human Movement Science, 55, 255–263. https://doi.org/10.1016/j.humov.2017.08.017
- Ko, Y., Challis, J. H., & Newell, K. M. (2003). Learning to coordinate redundant degrees of freedom in a dynamic balance task. Human Movement Science, 22, 47–66. https://doi.org/10.1016/S0167-9457(02)00177-X
- Komar, J., Seifert, L., & Thouvarecq, R. (2015). What variability tells us about motor expertise: measurements and perspectives from a complex system approach. Movement & Sport Sciences-Science & Motricité, 89, 65–77. https://doi.org/10.1051/sm/2015020
- Lee, I. C., Liu, Y. T., & Newell, K. M. (2016). Learning to ride a unicycle: Coordinating balance and propulsion. Journal of Motor Learning and Development, 4(2), 287–306. https://doi.org/10.1123/jmld.2015-0030.
- Li, Z. M. (2006). Functional degrees of freedom. Motor Control, 10(4), 301–310. https://doi.org/10.1123/mcj.10.4.301
- Li, Z. M., & Tang, J. (2007). Coordination of thumb joints during opposition. Journal of Biomechanics, 40(3), 502–510. https://doi.org/10.1016/j.jbiomech.2006.02.019
- Majed, L., Heugas, A. M., and Siegler, I. A. (2017). Changes in movement organization and control strategies when learning a biomechanically constrained gait pattern, racewalking: a PCA study. Experimental Brain Research, 235, 931–940. https://doi.org/10.1007/s00221-016-4853-8
- McMahon, J. J., Suchomel, T. J., Lake, J. P., & Comfort, P. (2018). Understanding the key phases of the countermovement jump force-time curve. Strength & Conditioning Journal, 40(4), 96–106.https://doi.org/10.1519/SSC.0000000000000375
- Newell, K. M., & Corcos, D. M. (Eds.). (1993). Variability and motor control. Human Kinetics.
- Newell, K. M., Kugler, P. N., Van Emmerik, R. E., & McDonald, P. V. (1989). Search strategies and the acquisition of coordination. In S. A. Wallace (Ed.), Perspectives on the coordination of movement (vol. 61, pp. 85–122). North-Holland.
- Nordin, A. D., & Dufek, J. S. (2016). Neuromechanical synergies in single-leg landing reveal changes in movement control. Human Movement Science, 49, 66–78. https://doi.org/10.1016/j.humov.2016.06.007
- Nordin, A. D., Dufek, J. S., James, R., & Bates, B. T. (2017). Classifying performer strategies in drop landing activities. Journal of Sports Sciences, 35, 1–1863. https://doi.org/10.1080/02640414.2016.1240876
- Raffalt, P. C., Alkjaer, T., & Simonsen, E. B. (2016). Intra- and inter-subject variation in lower limb coordination during countermovement jumps in children and adults. Human Movement Science, 46, 63–77. https://doi.org/10.1016/j.humov.2015.12.004
- Ryan, W., Harrison, A., & Hayes, K. (2006). Functional data analysis of knee joint kinematics in the vertical jump. Sports Biomechanics, 5, 121–138. https://doi.org/10.1080/14763141.2006.9628228
- Santello, M., Flanders, M., & Soechting, J. F. (2002). Patterns of hand motion during grasping and the influence of sensory guidance. Journal of Neuroscience, 22(4), 1426–1435.https://doi.org/10.1523/JNEUROSCI.22-04-01426.2002
- Scholes, C. J., McDonald, M. D., & Parker, A. W. (2012). Single-subject analysis reveals variation in knee mechanics during step landing. Journal of Biomechanics, 45(12), 2074–2078. https://doi.org/10.1016/j.jbiomech.2012.05.046
- Thomas, J. S., Corcos, D. M., & Hasan, Z. (2005). Kinematic and kinetic constraints on arm, trunk, and leg segments in target-reaching movements. Journal of Neurophysiology, 93(1), 352–364. https://doi.org/10.1152/jn.00582.2004
- Vaillancourt, D. E., & Newell, K. M. (2002). Changing complexity in human behavior and physiology through aging and disease. Neurobiology of Aging, 23(1), 1–11. https://doi.org/10.1016/S0197-4580(01)00247-0
- Verrel, J., Pologe, S., Manselle, W., Lindenberger, U., & Woollacott, M. (2013). Coordination of degrees of freedom and stabilization of task variables in a complex motor skill: Expertise-related differences in cello bowing. Experimental Brain Research, 224, 323–334. https://doi.org/10.1007/s00221-012-3314-2
- Winges, S. A., & Furuya, S. (2015). Distinct digit kinematics by professional and amateur pianists. Neuroscience, 284, 643–652. https://doi.org/10.1016/j.neuroscience.2014.10.041
- Winter, D. A. (2005). Biomechanics and motor control of human movement (3rd ed.). Wiley.
- Yang, J. F., & Scholz, J. P. (2005). Learning a throwing task is associated with differential changes in the use of motor abundance. Experimental Brain Research, 163(2), 137–158. https://doi.org/10.1007/s00221-004-2149-x
- Yeow, C. H., Lee, P. V. S., & Goh, J. C. H. (2009). Effect of landing height on frontal plane kinematics, kinetics and energy dissipation at lower extremity joints. Journal of Biomechanics, 42(12), 1967–1973. https://doi.org/10.1016/j.jbiomech.2009.05.017
- Zanone, P. G., & Kelso, J. S. (1997). Coordination dynamics of learning and transfer: Collective and component levels. Journal of Experimental Psychology: Human Perception and Performance, 23(5), 1454. https://doi.org/10.1037/0096-1523.23.5.1454