
Abstract
The classic rubber hand illusion (RHI), based on visual, proprioceptive, and tactile feedback, can affect actions. However, it is not known whether these effects still occur if the paradigm is administered without visual feedback. In this study, we used the somatic RHI to test in thirty-two healthy individuals whether the incorporation of the rubber hand based on proprioceptive and tactile information only is sufficient to generate changes in actions. We measured maximum grip aperture (GA) changes towards a target and associated brain activations within the dorsal stream before and after the somatic RHI. Behavioural and neuroimaging data do not support an effect on maximum GA when the RHI is based on proprioceptive and tactile information only.
INTRODUCTION
By walking or by grasping objects, we can explore and interact with the surrounding environment (Gabbard, Citation2008; Luo et al., Citation2007). We cannot perform these movements without the mental and cognitive representations of our body. Sense of Body Ownership (SoBO), our ability to feel and know that our body parts belong to us, emerges through the integration of multisensory information, such as visual, somatosensory and motor ones (Ehrsson, Citation2012). Literature on motion planning and execution suggests an interesting interplay between the body in action and SoBO (e.g., Heed et al., Citation2011; Kammers et al., Citation2009, Citation2010; Zopf et al., Citation2011). For instance, SoBO facilitates the estimation of limb positions in space (Faivre et al., Citation2017), providing useful feedback to perform actions (Shibuya et al., Citation2018).
Studies exploring this interplay between SoBO and actions relied on different methods to perturb the SoBO, such as virtual reality (Ambron et al., Citation2020), computer-manipulated video feedback (Bernardi et al., Citation2013; Karok & Newport, Citation2010; Newport et al., Citation2010), and the rubber hand illusion (RHI) (Heed et al., Citation2011; Kammers et al., Citation2009, Citation2010; Zopf et al., Citation2011). The classic version of the RHI (Botvinick & Cohen, Citation1998), an illusion targeting ownership of hands, is a behavioural paradigm where the integration of tactile, visual and proprioceptive information might lead individuals to feel a fake hand is their own (Shimada et al., Citation2009; Tamè et al., Citation2018). The illusion is based on synchronous stimulation of the fake and real hand, which allows integration of information. On the contrary if this stimulation is not congruent, in other words asynchronous, there is no incorporation of the fake hand and hence no illusion.
The results of the studies on the influence of the classic RHI on movement parameters are not always consistent (). For example, while showing in a first study the absence of effects of the classic RHI on reaching and grasping movements (Kammers et al., Citation2009), in a following study Kammers et al. (Citation2010) observe that the maximum grip aperture (GA) of participants changes during their reach-to-grasp towards a target, if the GA of the rubber hand used is incongruent with the real hand GA. However, Heed et al. (Citation2011) only partially confirm these results. Using a similar set-up and measuring the vertical endpoint error towards a target, Heed and colleagues show a mislocalization in the reaching endpoint towards the target to grasp caused by the embodiment of the dummy hand (reduced or enlarged compared to the real hand) (Heed et al., Citation2011). Importantly, changes in participants’ maximum GA are observed independently from the presence of the illusion (Heed et al., Citation2011). The vision of a reduced or enlarged rubber hand induces an effect on the grasping action, even when the participants are not incorporating the fake hand (Heed et al., Citation2011). Given these results, the authors suggest a possible role for the visual input provided by the sight of the artificial hand on movement parameters. This is in line with results from Holmes and colleagues (Holmes et al., 2006), suggesting that “proprioception is recalibrated following visual exposure to prosthetic hands and that this recalibration is independent of the rubber hand illusion.” (Holmes et al., 2006, p. 685).
Table 1. The table summarises the types of movement and corresponding movement parameters assessed by the studies.
In order to rule out the role of vision (Heed et al., Citation2011), the somatic version of the RHI (Ehrsson et al., Citation2005) could be used. The somatic RHI allows to explore whether motion planning and execution is influenced when the changes in ownership are induced through tactile stimulation. With our study, we aim to test this hypothesis, measuring the somatic RHI effects on the maximum GA, and on the associated brain activation within the visual (i.e., vision for action) and tactile (i.e., somatosensory processing for the guidance of action) dorsal streams (de Haan & Dijkerman, Citation2020; Dijkerman & De Haan, Citation2007; Goodale et al., Citation1994; Goodale & Milner, Citation1992; Milner & Goodale, Citation2008), recorded by means of a near-infra-red-spectroscopy (NIRS) device.
Previous studies used different types of movement parameters to evaluate the influence of the visual RHI on reach to grasp and reaching actions (as shown in ). The only measure in common between Heed et al. (Citation2011) and Kammers et al. (Citation2010) is the maximum GA, and the two studies show inconsistent results. Thus, in our study, we focussed on the maximum GA parameter only as outcome of movement planning and execution.
At the brain level, the body in action and SoBO share a common neural substate. For example, SoBO sees the involvement of a network encompassing frontal and parietal cortices (e.g., premotor cortex, supplementary motor area (SMA), motor cortex (M1), primary somatic sensory cortex, superior parietal lobe, and the intraparietal sulcus) (see Grivaz et al., Citation2017 for a meta-analysis of fMRI studies on SoBo; Arizono et al., Citation2016; della Gatta et al., Citation2016; Fossataro et al., Citation2018; Isayama et al., Citation2019). Similarly, planning and execution of actions such as grasping relies on the frontal and parietal portions of the brain (e.g., Cavina-Pratesi et al., Citation2010; Citation2010; de Haan & Dijkerman, Citation2020; Dijkerman & De Haan, Citation2007; Konen et al., Citation2013). As such, we focussed our analysis of changes in brain activation on these regions rather than using a whole brain approach.
In this study, thirty-two healthy individuals performed reach to grasp movements towards a target before and after the administration of the somatic RHI. The possibility to rely on proprioception information is of relevance in the planning and execution of movements (e.g., de Haan & Dijkerman, Citation2020). Thus, being the somatic RHI based on tactile and proprioceptive inputs, its administration should perturb the “accuracy” of the proprioceptive information used by the real hand under the illusion. As a consequence, we hypothesise that a more conservative GA, in other words a wider aperture, would be adopted in case of such an uncertainty, if the system needs updating the movement planning (Milner & Goodale, Citation2006; Schlicht & Schrater, Citation2007). Moreover, if the somatic RHI affects grasping planning and execution, changes in brain activation within the visual (as in our task participants could see their hands while grasping) and tactile dorsal streams (Dijkerman & De Haan, Citation2007; Milner & Goodale, Citation2008) should be detected.
METHODS
Sample
Our experiment is a mixed design study, with two factors, each of them on two levels. More in detail, the within-subject factor was Session (pre-RHI vs. post-RHI), while the between-subject factor was Order of Stimulation (Asynchronous to Synchronous vs. Synchronous to Asynchronous).
In order to compute the sample size necessary to observe the effect if present, a power analysis has been performed using G*Power 3.1 (Erdfelder et al., Citation2009; Faul et al., Citation2007) to detect a significant main effect using a mixed repeated measures analysis of variance (ANOVA RM).
The effect size has been determined on the basis of the lowest effect size available in the literature for a study that applied the classic version of the RHI (Ferri et al., Citation2017). We calculated the sample size considering the questionnaire (η2p= .30), as there was no proprioceptive drift measure in the study considered (Ferri et al., Citation2017). The same effect size η2p = .30, has been selected also in a more recent study (Gallagher et al., Citation2021) which applied the somatic RHI. It might be worth clarifying that we have chosen an effect size from the RHI literature, and not from the movement literature, as we needed to ensure first the effectiveness of the illusion, and secondly the results in the literature on the possible influence of the RHI paradigm on motion planning and execution are not consistent.
We selected an a-priori power of 1 – β = .90 with an alpha error probability of α = .05; 2 group and 2 measurements as other input parameters.
The resulting sample size was n = 32 participants, 16 participants in each group (Demographics were similar across the two groups, Asynchronous to Synchronous stimulation group: mean age = 30.1, SD = 4.7, 4 males; Synchronous to Asynchronous group; mean age = 29.1, SD = 6.3, 5 males), providing a power of 90%.
Thus, 32 healthy individuals were recruited for this study, through word of mouth, personal and professional contacts at Heriot-Watt University (n = 32; mean age ± SD: 29.59 ± 5.61; mean level of education ± SD: 18.25 ± 2.49; 23 females).
Inclusion criteria were absence of history of head injury, degenerative neurological conditions (such as Parkinson’s disease), psychiatric conditions (such as schizophrenia), motor/tactile sensory impairments or visual impairments (i.e., participants should be able to see without glasses, as glasses cannot be worn during the study). Only right-handed participants were enrolled by means of the Edinburgh Handedness Inventory-Short Form (Veale, Citation2014) to avoid confounding factors from the supposedly different cerebral lateralisation of cognitive functions and presence of different cognitive effects in left handed individuals (Ionta & Blanke, Citation2009).
Informed consent was obtained prior to participation. The study was designed according to the ethical standards of the Declaration of Helsinki and received approval from the local ethical committee at Heriot-Watt University (approval number: 2019-022).
Experimental Measures and Techniques
Behavioural Measure: The Somatic Rubber Hand Illusion (RHI)
Description
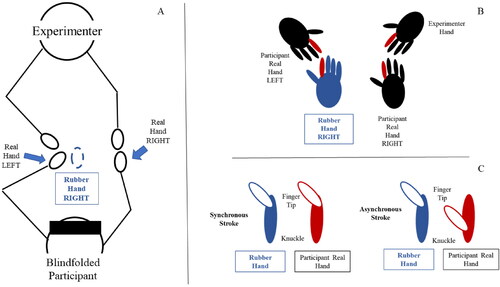
A rubber hand has been used in order to elicit the body ownership illusion (Botvinick & Cohen, Citation1998). We administered the somatic version of the illusion (Ehrsson et al., Citation2005): the SoBO of the fake hand in participants is elicited using only tactile and proprioceptive integration and not vision. We have adopted the procedure used in Gallagher et al., Citation2021; Ehrsson et al., Citation2005; Lopez et al., Citation2012. In our study, we wanted participants to experience the embodiment of a fake right hand. Therefore, the rubber hand used is a right fake hand because the real hand under illusion is the right hand ( panel A). The participant left index finger was placed above the right index finger of the rubber hand ( panel B). Participants were blindfolded, while their left index was moved by the experimenter over the right index finger of the rubber hand (from the knuckle to the tip), at the same time, the experimenter touched the participant’s right hand executing the same movement over the right index finger of the participants’ hand. The touches were administered synchronously or asynchronously ( panel C). When the touches were administered synchronously, the right index finger of the rubber hand and the right index finger of the participants were touched at the same time, in other words the left index was moved from the knuckle to the tip by the experimenter over the right index finger of the rubber hand with the same velocity and at the same time as the real hand. Differently, in the asynchronous condition, the right index finger of the rubber hand and the right index finger of the participants were moved in different moments. In total, the stimulation lasted one minute and half on average (90 strokes in total). Each stroke lasted 500 ms (as confirmed with a chronometer in front of the experimenter). The synchronous condition was used as an index to evaluate the perceived ownership of the fake hand.
Figure 1. Panel A shows the setup for the somatic RHI. Panel B zooms into the hands (highlighting in red the fingers used for stroking and the stimulated fingers to induce the illusion) and panel C shows how the synchronous and asynchronous strokes differ.
We used two parameters to assess the strength of the illusion: proprioceptive drift and ownership questionnaire. To evaluate the proprioceptive drift participants had to indicate with their left index the perceived position of their right index finger while blindfolded, before and after the stimulation (Synchronous or Asynchronous), on a ruler placed in front of them (Gallagher et al., Citation2021). In an attempt to avoid that the participants’ responses were affected by learning, the starting position of the left index over the ruler varied by about several centimetres in each trial (Flögel et al., Citation2016; Lopez et al., Citation2012; Radziun & Ehrsson, Citation2018). One might wonder if by changing the position of the index finger, the experimenter also modifies proprioceptive information related to the finger starting position. It should be noted however that the left index finger, as explained above, is the index of the hand not under the illusion. For this reason, even if we change the starting position of the left index finger over the ruler between measurements, this change in proprioception does not affect the right index finger and hand, where the illusion is established. As such, this method allows to avoid that the subjects rely on memory of where the right hand is, and at the same time does not impact on the illusion because the illusion is for the other hand. The difference between the perceived position before and after stimulation was therefore used as the proprioceptive drift measure. To assess the strength of the somatic RHI, we administered the RHI questionnaire for the somatic version by Lopez et al. (Citation2012) (). Consisting of 13-statements, for each statement participants indicated the level of agreement using a seven-point Likert scale ranging from “I totally disagree” to “I totally agree” (i.e., I felt as if I was touching my right hand with my left index finger).
Table 2. Table shows the original statements by Lopez et al. (Citation2012) for the somatic RHI used in the current study.
Data Processing
Data were processed using Excel. The parameters used (questionnaire and proprioceptive drift) do not suffer from anticipation or distraction effects, thus, we did not looked for outliers (e.g., of similar studies which did not look for outliars: Flögel et al., Citation2016; Lenggenhager et al., Citation2015 ). Below is a description of processing for each of the different measures.
Proprioceptive drift was calculated as the difference, in centimetres, between the indicated positions of the right finger index at the end and at the start of the stimulation. If participants experienced a drift towards the fake right rubber hand this would be reflected in a drift to the left, resulting in a negative value. For example, if the real hand is positioned with the right finger index at 50 cm (ruler used to measure), the fake right hand would be positioned with its right finger index at 35 cm (ruler). Participants report a value around 50 cm before the stimulation (e.g., 49.5) and a smaller value if a drift towards the rubber hand is experienced after the stimulation (e.g., 45). This results in the calculation of the proprioceptive drift as 45 cm − 49.5 cm= − 4.5 cm, a negative value.
As for the questionnaire, statements were grouped in five domains: Ownership, Deafference, Movement, Compliance, and Affect (Gallagher et al., Citation2021). Responses ranged through ‘Totally Disagree’, ‘Disagree’, ‘Somewhat Disagree’, ‘Neutral’, ‘Somewhat Agree’, ‘Agree’, ‘Totally Agree’, scoring −3 to +3 respectively; negative scores corresponded to disagreement while positive scores corresponded to agreement. Questionnaire statements 1, 8, 9 and 10 assessed Ownership; 2, 3, 4, and 5 assessed Compliance; 7 assessed Affect; 6 and 11 assessed Movement; and 12 and 13 assessed Deafference. Averages of these statements therefore gave the scores for each of the domains.
Motion Analysis System: Grip Aperture
Description
Movement of participants was recorded by a motion capture system (Qualisys Track Manager (QTM) (from Qualysis AB, Gothenburg, Sweden). This non-invasive system allows recording hand movements by means of infra-red cameras that register the light reflected by markers attached to the participant’s fingers at 240 Hz. The parameter of our interest was the maximum GA, the maximum distance between the thumb and index finger during the grasping actions (Jeannerod, Citation1984). The maximum GA was tracked by means of three reflecting markers attached to the participant’s thumb, index finger, and wrist (reference point). The reflecting markers were attached through Blu Tack, without causing any pain or discomfort. The target of the grasp out movements was a black plastic block measured 3 × 3 × 3 cm.
Data Processing
The raw data as recorded by the motion analysis system were extracted and processed with MATLAB (MathWorks®, Natick, MA, USA, Version R2018a) applying a script designed to extract the maximum GA of each trial. Moreover, for each trial, the script provided the spatial coordinate data (X, Y and Z) allowing a visual inspection of the data. First of all, we made a visual inspection of each of the ten movements for each block in order to verify if the maximum GAs observed were readable. In order to use the data of the participants, 80% of the trials were expected to be readable, for each block. Following the removal of the maximum GA of the discarded trials, the average of the maximum GA was calculated.
Brain Imaging Technique: Near-Infrared Spectroscopy (NIRS)
Description
In order to collect neural activity data, we used a NIRS 24 channel Oxymon MKIII system (Artinis Medical Systems B.V., Elst, The Netherlands), with four receivers and eight dual wavelength transmitters. This modality of registration is through continuous wave, without frequency modulation. This NIRS device uses 765 nm and 855 nm laser diodes for its transmitters and has Avalanche Photo Diode receivers. The diode light power at the fibres end is < 4 mW∕cm2, within the limits of the American National Standards Institute and thus permitting safe measurements. The distance between each receiver/transmitter pair was approximately 30 mm providing an optical penetration depth (about 25 mm), sufficient to record changes in the cortical tissue (Franceschini et al., Citation2000). As mentioned in the introduction section, NIRS device is able to measures relative changes in the concentration of HbO and HbR in the brain (Sato et al., Citation2013).
Participants wore a cap (similar to those worn in in EEG studies) which carried the probes linked to the receiver and transmitter fibres. Our target brain areas were identified based on previous literature (Ehrsson et al., Citation2005) and on the knowledge of both sensory and motor control processes of hands (An et al., Citation2013; Yeo et al., Citation2013) and reaching and grasping (Cavina-Pratesi et al., Citation2010; van Polanen & Davare, Citation2015). Accordingly, the regions of interest were the premotor cortex, supplementary motor area (SMA), motor cortex (M1), primary somatic sensory cortex, superior parietal lobe and the intraparietal sulcus of the contralateral hemisphere of the limb under illusion ().
Table 3. Table reports the areas of interest of the study and the corresponding channels over the brain regions. * = indicates right side of the brain, which is ipsilateral to the limb under illusion.
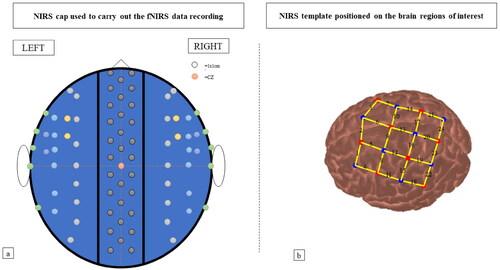
In order to identify the position of the brain regions of interest on the cap, we used the international 10/20 system (Jasper, Citation1958), as in previous NIRS studies (Arizono et al., Citation2016; Filippetti et al., Citation2015; Yeo et al., Citation2013) ().
The optical fibres template was placed on a 10 cm x 10 cm square area (approximately) on the left side (), with midline central location (Cz) located beneath the 4th channel, between the first receiver and the fourth receiver.
Figure 2. Panel a) shows the NIRS cap utilised to carry out the NIRS data recording. Coloured circles indicate cap holes (default). Panel b) shows the disposition of the transmitters (red circles) and receivers (blue circles) of the template adopted (image produced by Homer2 NIRS Processing package) and the channels provided.
We used a sampling frequency of 10 Hz; the closest option available to the value used in the literature (i.e., 8.68 Hz, Ferri et al. (Citation2017)). Usually, studies report the changes in the oxy-Hb concentration as this is considered to be the most sensitive parameter of hemodynamic responses (Strangman et al., Citation2002). However, we decided to report both HbO and HbR, in order to provide a complete overview of the results (see Filippetti et al., Citation2015; Lloyd-Fox et al., Citation2010, Menant et al., Citation2020).
Data Processing
Original data recorded were converted using the oxysoft2matlab function in MATLAB (MathWorks®, Natick, MA, USA, Version R2018a) provided by Artinis Medical Systems B.V, Elst, The Netherlands. The optical signal processing was performed using Homer2 NIRS Processing package (Huppert et al., Citation2009) ().
Figure 3. Figure shows the flowchart of the data processing of NIRS data from the recording of raw data till the calculation of the averaged HbO and HbR concentrations. HbO = oxygenated haemoglobin; HbR deoxygenated haemoglobin.
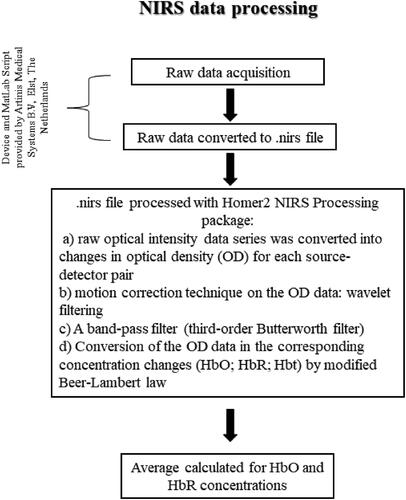
The processing stream that we applied incorporates the principal steps suggested by previous studies (Arizono et al., Citation2016; Brigadoi et al., Citation2014; Ferri et al., Citation2017). Firstly, a) the raw optical intensity data series was converted into changes in optical density (OD) for each source-detector pair (Brigadoi et al., Citation2014; Ferri et al., Citation2017). Then, b) we applied the motion correction technique on the OD data. As a filter we adopted the wavelet filtering, a channel-by-channel approach designed to correct motion artefacts. The α parameter, a probability threshold able to detect outliers, was set at 0.1 (Brigadoi et al., Citation2014; Cooper et al., Citation2012; Molavi & Dumont, Citation2012). c) A band-pass filter (third-order Butterworth filter) with cut-off frequencies of 0.01 for the high pass filter and 0.5 Hz for the low pass filter (Arizono et al., Citation2016; Brigadoi et al., Citation2014; Ferri et al., Citation2017) was applied for removing the drift component and physiological noise that are not detected using the wavelet filtering (i.e., respiratory and cardiac artefacts) (Sasai et al., Citation2011). d) In order to convert the OD data into the corresponding concentration changes (HbO and HbR), the modified Beer-Lambert law (Cope & Delpy, Citation1988; Delpy et al., Citation1988) was then applied with an age-corrected differential-pathlength factor (DPF = 4.99 + 0.067xAGE0.814) (Duncan et al., Citation1996).
As a result of the processing, we obtained the filtered concentration of HbO and HbR for each of the 24 channels; then, we calculated the average concentration of HbO and HbR for each channel (Menant et al., Citation2020). Signals were expressed as the product of the changes in haemoglobin concentration (mM) and optical path length (mm) in the recorded region (effective optical path length) (Sato et al., Citation2013).
Concerning the somatic RHI data, we discarded the first 30 seconds of the recording (Arizono et al., Citation2016) because the illusion should start after 14.3 ± 9.1 s (mean ± SD) (Arizono et al., Citation2016; Ehrsson et al., Citation2007) from the beginning of the stimulation. For the brain data recorded during the reach to grasp movements, we considered the whole registration for the data pre-RHI, while, we divided the post-RHI data into two recording. More in detail, we wanted to explore if differences were present in the first and last trials of the task, where in this latter case a normalisation of the signal could occur due to the repetition of the movement. However, because the recording was continuous and not separated for each movement (10 trials for each block), we defined a timeframe using the kinematic data on timing of movements, identified as the first 39 seconds (i.e., the very first 3 movements) and the last 39 seconds (i.e., the very last 3 movements) of the recording. Each trial was expected to last 13 seconds (i.e. 4 seconds for the trial to start, 7 seconds of recording, 2 seconds for the window of the program to pop in and to ask if the experimenter would like to continue with the recording after each trial).
Procedure
The procedure is reported in . Participants were seated comfortably on a chair with a table in front of them. At the beginning of the experiment, participants were asked to read and sign the ethics material, provide general information (i.e., age, education level etc.), and fill in the Edinburgh Handedness Inventory - Short Form (Veale, Citation2014).
Figure 4. Figure shows the flowchart of the experiment. R&G = reach to grasp movement; ½ = half of participants; As = asynchronous stimulation; Sy = Synchronous stimulation.
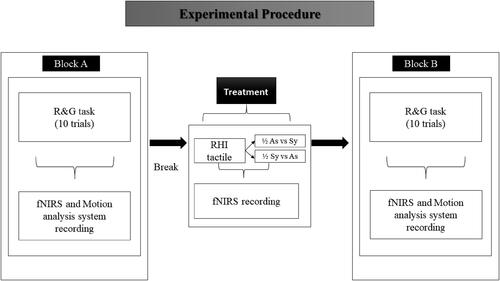
Brain activity was recorded by the NIRS device; the maximum GA was recorded using the Qualisys Track Manager (QTM). Before starting the study, participants were asked to wear the NIRS cap linked with receiver and transmitter fibres. After this, the experimenter attached the reflecting markers over the index, thumb and wrist of the participants, on their right dominant hand. Participants underwent two blocks of tasks. During the first block, participants performed reach to grasp movements to reach and grasp a black plastic block positioned in front of them at a distance of 20 cm (peripersonal space, aligned with participant midline), from a start position located 10 cm from the near edge of a table located in front of them. They started each trial by resting their closed thumb and index finger of their dominant right hand on the table and aligned to their body midline. Participants were cued to move by means of the verbal cue “go”. The movement trial duration was 7 seconds. The intertrial interval was 6 seconds (2 seconds for the window of the program to pop asking to continue with the next recording, plus, 4 seconds for the next trial to start).
Participants performed a total of 10 trials using a precision grip with their thumb and index finger (10 movements).
During the second block, participants first underwent the somatic RHI paradigm and then the same grasping and reaching task as performed during the first block. Participants were asked to wear a rubber glove on both hands, as well as the experimenter did. Even the rubber hand “wore” a glove. Participants were blindfolded. By means of each hand, real and fake, wearing a glove, we ensured a consistent tactile perception. The right fake hand was placed in the space between the two hands with its index finger at 15 cm from the real index finger of the right hand (Kammers et al., Citation2009). The ruler used to define the proprioceptive drift was placed above the hands of the participant, suspended with a wooden support. During the asynchronous stimulation, the left index finger of the participant was moved by the experimenter onto the right index finger of the fake hand from the knuckle to the tip, with a frequency of one stroke per second, meanwhile the experimenter stroked the right index finger, from the knuckle to the tip, in an asynchronous way (the right index finger of the rubber hand and the right index finger of the participants’ hand were touched with different timing). Each stroke lasted 500 ms (as confirmed with a chronometer in front of the experimenter). In total, the stimulation lasted one minute and half on average (90 strokes in total). In this asynchronous condition it is known that the participant should not experience the ownership of the fake hand. In the synchronous condition, the participant underwent the same procedure but with the strokes being synchronous. In the synchronous condition, participants should experience the ownership of the fake hand. The right index finger of the rubber hand and the right index finger of the participants were touched at the same time during the synchronous stimulation. The proprioceptive drift measure was evaluated as described in the somatic RHI methods: before undergoing the somatic RHI and after each stimulation (synchronous/asynchronous), the participants were asked to reach the location on the ruler that they feel is above the right index finger with their left index finger. After the evaluation of the proprioceptive drift, the participants were asked to fill in a questionnaire on the illusion experienced.
Half of the participants underwent first the asynchronous stimulation then the synchronous and the other half underwent first the synchronous stimulation and then the asynchronous stimulation. The reason why we decided to consider the order of stimulation as a between-subjects factor is that we wanted to verify if the order of stimulation would have influenced the outcome of the maximum GA. We expected a change in the maximum GA only for those participants exposed to the order of stimulation first asynchronous, then synchronous, because these participants would have experienced the embodiment of the fake hand immediately before the (second) motion task. Differently, for the order of stimulation synchronous first and then asynchronous, we did not expect changes in the maximum GA because the sense of ownership towards the hand would have been restored before the (second) motion task. As shown in , participants performed only one round of block B. This means that we have examined the influence of the second of the two stimulations (i.e., synchronous for the order of stimulation asynchronous to synchronous, and asynchronous for the order of stimulation synchronous to asynchronous) on maximum GA.
After participants had undertaken the RHI and the proprioceptive drift measure was collected, the experimenter removed the blindfold as well as the gloves. The experimenter then asked participants to answer the ownership questionnaire using their left hand (i.e. the hand not under the influence of the illusion). Participants were instructed not to move their right hand. The right hand was only passively touched by the experimenter to attach the reflective markers on the thumb, index finger and wrist before the participants performed the second block of reach to grasp movements towards the black plastic cube. Overall, these steps that transition from the RHI stimulation to the grasping block took no more than five minutes.
Data Analysis
The collected data was analysed using Statistical Package for Social Science (IBM® SPSS® Statistic, Version 25). Alpha level was set at p<.05 for all analyses. The main analysis performed is a mixed ANOVA, then, if the assumption of sphericity was violated in the Mauchly’s sphericity test, the Greenhouse-Geisser correction coefficient epsilon was used to correct the degrees of freedom.
Behavioural Measures: The Somatic Rubber Hand Illusion (RHI)
In order to ensure the establishment of the illusion and absence of differences between groups, for each dependent variable (proprioceptive drift and each of the five questionnaire measures) a 2 (Stimulation: synchronous vs asynchronous) x 2 (Order of Stimulation: Asynchronous to Synchronous or Synchronous to Asynchronous) repeated measure analysis of variance (RM ANOVA) was conducted. Stimulation was the within-subject factor, while Order of Stimulation was the between-subject factor.
Bonferroni correction was applied to questionnaire variables, with critical α = .01. Thus, only results under this value were considered significant.
Motion Analysis System: Grip Aperture
To test whether the treatment (the somatic RHI) affected the maximum GA (dependent variable), a 2 (Session: pre-RHI vs post-RHI) x 2 (Order of Stimulation: Asynchronous-Synchronous or Synchronous-Asynchronous) RM ANOVA was conducted, with Session as within-subject factor and Order of Stimulation as between-subject factor.
Brain Imaging: Near-Infrared Spectroscopy (NIRS)
GA and NIRS
To evaluate possible changes of the brain activation during the reach to grasp movements (maximum GA) due to the treatment (the somatic RHI), a 3 (Time: pre-RHI vs post-RHI1 vs post-RHI2) x 2 (Order of Stimulation: Asynchronous-Synchronous or Synchronous-Asynchronous) RM ANOVA was conducted, with Time as within-subject factor and Order of Stimulation as between-subject factor.
Somatic RHI and NIRS
To test whether the differences in the brain activation occurred during the somatic RHI paradigm between the conditions of not illusion and illusion, we carried out paired t-tests for each channel within each group, synchronous to asynchronous and asynchronous to synchronous. Due to the large amount of t-test performed, to control for false-positive channels, we have also performed false discovery rate (FDR) analysis (Benjamini & Hochberg, Citation1995). The syntax used to perform such control can be found at: https://www.ibm.com/support/pages/node/418001.
Due to the large amount of data used in the analysis performed for NIRS data, only the results of channels showing significant differences were reported and discussed. However, tables with the main statistics and the results obtained for all analyses have been made available (Supplementary materials 1 and 2).
RESULTS
Behavioural Measures: The Somatic Rubber Hand Illusion (RHI)
Proprioceptive Drift
The RM ANOVA revealed a significant main effect of Stimulation, with a higher proprioceptive drift for synchronous (M = −2.71 cm, SE = 0.10 cm) versus asynchronous (M = −.78 cm, SE = 0.20 cm) stimulation (F(1, 30) = 95.183, p < .001, ηp2 = 0.76) (). The main effect of Order of Stimulation (F(1, 30) = .112 p =.760, ηp2 = .004) and the interaction between Stimulation and Order of Stimulation (F(1, 30) = .440, p =.512, ηp2 = .014) was not statistically significant. Independent from the order of stimulation, participants experienced more drift in the direction of the rubber hand for the synchronous stimulation.
Figure 5. Figure shows the average of proprioceptive drift observed after synchronous and asynchronous stimulation. Bars represent the average of the group, while dots individual data points. Participants experienced greater drift (*) when the synchronous condition was experienced.
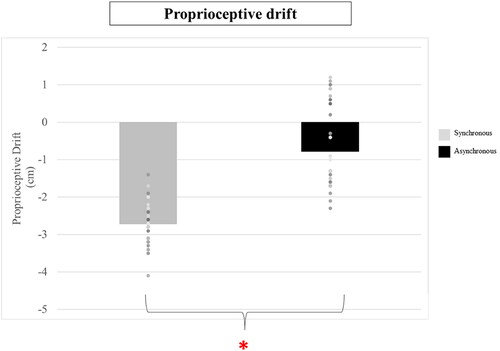
The results are in line with what was observed in previous studies, a mislocalization of the real hand occurred after the synchronous stimulation (Ehrsson et al., Citation2005; Lopez et al., Citation2012).
Questionnaire
Ownership
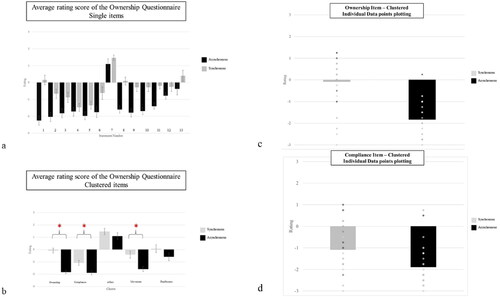
The RM ANOVA revealed a significant main effect of Stimulation, with a significant difference in the experience of ownership for synchronous (M = −0.078, SE = 0.19) versus asynchronous (M = −1.83, SE = 0.14) stimulation (F(1, 30) = 90.483, p < .001, ηp2 = 0.75). The main effect of Order of Stimulation (F(1, 30) =1.314 p =.261, ηp2 = 0.042) and the interaction of the main effect (F(1, 30) = 3.816, p =.060, ηp2 = .113) were not statistically significant. Independently by the order of stimulation, participants experienced ownership differently in the synchronous stimulation ().
Figure 6. Panel a) shows the average rating for each of the 13 items (statements) in the ownership questionnaire after the synchronous and asynchronous stimulation. While panel b) shows the average for the five questionnaire clusters, and the differences (*) observed between synchronous and asynchronous stimulation. The bars indicate the Standard Error (SE). Panel c) shows individual data plotting for the ownership cluster of the questionnaire. This information is relevant given the known variability in RHI studies, and helps the Reader appreciating the spread of Group data, that would not otherwise be visible. Panel d) Compliance individual data plotting shows that the group average, which is significantly different between conditions, is not reflected so clearly as for other clusters when the individual data points are considered.
Deafference
The main effects as well as their interaction were not statistically significant (p > .01). In both groups, participants experienced a comparable amount of deafference for asynchronous and synchronous stimulations ().
Movement
The RM ANOVA revealed a significant main effect of Stimulation, with a different experience of movement for synchronous (M = −0.41, SE = 0.29) versus asynchronous (M = −1.58, SE = 0.20) stimulation (F(1, 30) = 21.120, p < .001, ηp2 = 0.41). The main effect of Order of Stimulation (F(1, 30) = 2.027 p =.165, ηp2 = 0.063) or the interaction between the two main effects (F(1, 30) = .184, p =.671, ηp2 = 0.006) were not statistically significant. Independent from the order of stimulation, participants experienced differently movement for the synchronous stimulation ().
Affect
The main effects as well as their interaction were not statistically significant (p > .01). Participants of both groups experienced a comparable amount of enjoyability for asynchronous and synchronous stimulations ().
Compliance
The RM ANOVA revealed a significant main effect of Stimulation, with different compliance for synchronous (M = −1.09, SE = 0.20) versus asynchronous (M = −1.88, SE = 0.17) stimulation (F(1, 30) = 15.415, p < .001, ηp2 = 0.33). The main effect of Order of Stimulation (F(1, 30) = .475 p =.496, ηp2 = .016) as well as for the interaction (F(1, 30) = .480, p =.494, ηp2 = .016) was not statistically significant. In both groups, the participants experienced more compliance following the synchronous stimulation ().
Overall, the ownership questionnaire results showed that independently from the order of stimulation, both group of participants experienced the tendency to embodiment of the rubber hand in the synchronous stimulation.
Motion Analysis System: Grip Aperture
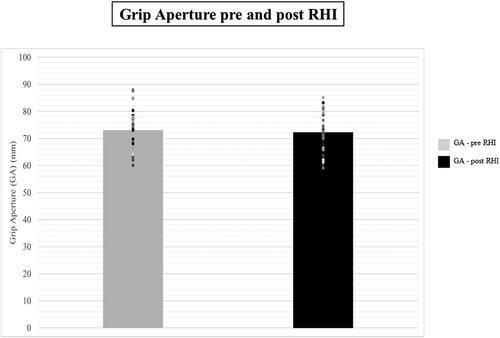
The ownership illusion (the somatic RHI) did not affect the maximum GA of the participants. We did not observe a significant main effect of Session (F(1, 30) = .630, p = .433, ηp2 = .021; Grip Aperture pre-RHI: M = 72.97 mm, SE = 1.40 mm, Grip Aperture post-RHI: M = 72.14 mm, SE = 1.34 mm) () or of Order of Stimulation (F(1, 30) = .252, p = .619, ηp2 = .008). Moreover, no interaction was found (F(1, 30) = .173, p = .680, ηp2 = .006).
Figure 7. Figure shows the average of the maximum GA as observe before and after the exposure to the somatic RHI (treatment). Bars represent the average of the group, while dots and individual data points. The maximum GA remained stable between measurements (p>.05).
When a non-significant result counts against a theory, Bayes factor can be used to determine whether non-significant results support a null hypothesis over a theory, or whether the data are just insensitive (Dienes, Citation2014). Using this approach, we can further check what is the strength of the evidence we provide.
We wished to test whether the somatic RHI increases GA. If there is an influence, then the effect should be present (i.e. the GA larger) in the post RHI movements if the movements are done immediately after the synchronous stimulation. If there is no influence, the GA should be the same in the pre and post RHI movements, independently from which order is followed. Our data returns a Bayes Factor of 0.09 (https://harry-tattan-birch.shinyapps.io/bayes-factor-calculator/), which suggests strong evidence for the model that predicts no effect.
Behavioural data of maximum GA showed that the induction of the somatic RHI does not change the outcome of planning. The maximum GA observed before and after the application of the somatic RHI remained stable.
Brain Imaging: Near-Infrared Spectroscopy (NIRS)
GA and NIRS
No statistically significant difference was observed either in HbO or in HbR average concentrations due to the treatment (Supplementary material 1). However, a trend occurred in channel 7 (right SMA) of the HbR concentration.
HbR - Channel 7 (Right SMA)
The RM ANOVA revealed a significant main effect of Time (F(1.116, 60) = 4.230, p = .044, ηp2 = 0.12). Bonferroni corrected post hoc tests showed a trend (p = .093) in terms of greater averaged HbR concentration in the right SMA following the somatic RHI (pre-RHI exposure: M = .349 mMmm, SE = .59 mMmm; post1-RHI: M = 4.48 mMmm, SE = 2.00 mMmm). The main effect of Order of Stimulation (F(1, 30) = 1.990 p =.169, ηp2 =.06) as well as the interaction (F(2, 60) = 2.049, p = .138, ηp2 = .06) was not statistically significant.
Somatic RHI and NIRS
Considering the group of participants differentiated according to the order of stimulation, for the case of synchronous to asynchronous stimulation, no statistically significant difference was observed either in HbO or in HbR concentrations (Supplementary material 2). Differently, when the order of stimulation was asynchronous to synchronous, the HbR concentration revealed significant differences between the two conditions in channels 8 and 13; the rest of the channels did not reveal any differences either in HbO or in HbR concentrations (Supplementary material 2).
HbR - Channel 8 and 13 (Left M1)
The analysis showed greater averaged HbR concentration in the left M1 during the synchronous stimulation (Ch8: M= .93, SD= 1.87; Ch13: M= −.03, SD= .85) compared to the asynchronous (Ch8: M= .14, SD= 1.14; Ch13: M= −.35, SD= 1.2) stimulation (Ch8: t(15) = 2.703, p= .016; Ch13: t(15) = 2.489, p= .025). However, the two channels did not survive the FDR correction.
DISCUSSION
Motion planning and execution is a fundamental ability to successfully interact with the environment (Gabbard, Citation2008; Luo et al., Citation2007). Previous findings show how incorporating a fake hand, such as in the classic version of the rubber hand illusion (RHI), can affect motion planning and execution in healthy participants (Heed et al., Citation2011; Kammers et al., Citation2010; Zopf et al., Citation2011). However, previous research was based on a visual version of the RHI, as such the role of the visual input provided by the sight of the rubber hand was not studied, hence the impact of vision was not clarified (Heed et al., Citation2011). Human beings base their actions not only on vision, but also on other sensory modalities (Castiello, Citation1996; Sedda et al., Citation2011). Hence, in this study, we used a somatic version of the RHI (Ehrsson et al., Citation2005) to explore if modifying ownership of a hand using only touch still affects maximum GA. In our study, as explained in the introduction, we focussed our attention on a specific motion parameter, the maximum grip aperture (GA), as this parameter was inconclusive in previous studies.
In our experiment, participants performed grasping movements towards a target object before and after being subjected to the somatic RHI. During the experiments, participants’ brain activity was monitored using a NIRS device. We hypothesised an increase of the maximum GA due to the influence of the fake handFootnote1 incorporation (i.e., the embodiment of an external body object makes you unsure of the ownership of your own body). As a result, participants’ GA would be altered to execute an efficient and precise movement: the new movement parameters, driven by the fake hand influence, should have been taken into account, which would be reflected in a wider maximum GA given the new uncertainty (Milner & Goodale, Citation2006; Schlicht & Schrater, Citation2007).
Our findings did not confirm this hypothesis: the maximum GA observed in our experiments remained stable before and after experiencing the somatic RHI. These findings are in agreement with the hypothesis of Heed et al. (Citation2011) and previously Holmes et al. (Citation2006) who attribute a pivotal role to the visual input in the impact of the fake hand on actions. Differently from the somatic version, in the visual, or classic, RHI, the input provided by the fake limb is sufficient to change the maximum GA, even when the hand is not embodied (such as in the asynchronous condition) (Heed et al., Citation2011). This finding suggests that, if the embodiment of the rubber hand is based only on tactile and proprioceptive input, this is not sufficient to elicit a change in the maximum GA because this sensory information is not as powerful as the visual input (Goodale & Humphrey, Citation1998).
However, the role of the visual input in ours and other experimental set-ups might not be so clear cut. In our experiment, neither the rubber hand, nor the target to grasp were visible during the illusion, while during the movements, both the grasping hand as well as the target to grasp were visible. In the work of Zopf et al. (Citation2011), during the illusion, the rubber hand was visible and the target to reach was not, while during the movements only the target to reach was visible. Differently from ours and Zopf et al. (Citation2011), in both Heed et al. (Citation2011) and Kammers et al. (Citation2010), during the illusion both the rubber hand and the target to grasp were visible, while during the movement neither the grasping hand nor the target to grasp were visible. One could assume that in these two studies (Heed et al., Citation2011; Kammers et al., Citation2010) the movement was guided via the memory of the target location and via the features in the ventral stream (Milner & Goodale, Citation2008). In our study the movement was visually guided: this suggests that an online update of the dorsal stream might have occurred due to the new visual input during the movements: even if the tactile and proprioceptive inputs affected the sense of body ownership (SoBO) of participants’ hands via the somatic RHI, the vision of the real hand during the grasping actions can have fostered an online re-update of the system previously perturbed by the somatic RHI, which resulted in an execution that is comparable to the one before the perturbation. We appreciate that the vision of the real hand might have disturbed the persistence of the illusion. Given in our setup participants could see their hand while performing the grasping action, one could wonder if the lack of effects observed is due to this methodological element. In other words, three possible scenarios can be developed to interpret these results: a) the effects of the somatic RHI disappears because participants see their own hand – no residual effects of body ownership modulation b) the effects of the somatic RHI diminishes because participants see their own hand – residual effects of body ownership modulation remains but are not as powerful as they could be, and finally c) the effects of the somatic RHI persists even when participants see their own hand – strong effects of body ownership modulation should be expected. Previous studies suggest that seeing the rubber hand and knowing that the rubber hand is a fake limb does not prevent the illusion from occurring. For example, in Radziun & Ehrsson, (Citation2018) participants see the rubber hand before the illusion is induced. Results of this study confirm that, what we could call awareness or semantic knowledge of the body, achieved via vision, does not prevent body ownership modifications. As such, why should we think that seeing the hand after the illusion and knowing that what was touched was a fake limb should immediately return body ownership to a different baseline level? A second work of interest here is the one conducted in Faivre et al. (Citation2017). This work shows that vision interacts with proprioception when the somatic RHI is used, as demonstrated not only by behavioural data but also by brain waves recording. In this work, the Authors show that “the position of an afterimage depends on the synchrony of tactile-proprioceptive stimulation” and “we report that the Taylor illusion does not just depend on bodily inputs, but also on the sense of body ownership.”. So, proprioception and body ownership modulate vision, and not only the contrary. These are just two examples, but we think they are helpful in conveying the message that assuming that vision overrules the effects of the somatic RHI in full is risky. One cannot assume that simply seeing their hand cancels completely the effects of the RHI. On the contrary one can hypothesise that because of the somatic RHI the visual input is not treated equally as before the illusion. We think it is unlikely that illusions such as the RHI (and others such as the full body version) have hours long lasting effects, independently from what is done (i.e. participants seeing or not their limbs). Because body ownership is not a “basic sensory experience”, rather it involves also higher-level representation, we think what we described as scenario b) is the most likely hypotheses. To experimentally rule out which of the scenario occurs, the experiment we run with the somatic RHI could be used, and adjusted so that participants do not see their hands during the grasping, while still seeing the target (as they are blindfolded during the illusion induction, they cannot rely on memory of the target position). In the somatic version of the RHI, the experimenter induces the illusion by moving the participants index finger, as we describe in our methods. As such, using a platform such as the one in Heed et al. (Citation2011) is not really feasible: such platform would need to be at least at eye level, and indeed allow for the right space for the experimenter to stimulate the participant hand with the participant left index finger, avoiding contact with the platform surface during the induction of the RHI. This means that consequently the target object would need to be elevated above the platform to be visible to the individual. After the illusion, either one would need to ask participants to perform an awkwardly elevated grasping need to remove the platform, which would induce other methodological issues. In other words, a set up to test the scenarios above needs careful consideration.
Another relevant methodological difference, related to the role of vision, is the type of rubber hand used by Kammers et al. (Citation2010) and Heed et al. (Citation2011). These hands had visual features which differed from the rubber hand we used. Kammers et al. (Citation2010) and Heed et al. (Citation2011) manipulated the GA of the rubber hand (large or small) (Kammers et al., Citation2010), or used different hand sizes, reduced and enlarged rubber hands (Heed et al., Citation2011). In the case of the somatic RHI, these manipulations are not possible, or even feasible, otherwise one would lose the consistency between the proprioceptive input (what the participant feels) and the tactile input (what the participant touches), which are the core inputs of this version of the illusion. Nonetheless, a RHI in general modifies where the position of the limb is perceived in space, and to plan a GA it is not only the shape required that is taken into account but also the location of the hand compared to the target to be grasped. As such, despite the limitations of the somatic RHI (i.e. not changing the hand shape) there is still a good rationale to test whether it affects the GA.
The absence of changes in the maximum GA, following the exposure to the somatic RHI, might be due to the request of completing both the proprioceptive drift task and the ownership questionnaires straight after the administration of the somatic RHI paradigm. This may have reduced the strength of any possible effects of the illusion over time. However, as explained above, the disruption of the SoO experienced after the establishment of the RHI is not expected to go back to baseline levels straight after the end of the illusion and scenario b) still applies.
One final factor that should be taken into account is the strength of the illusion experienced: the greater the strength of the illusion, the greater the effects on maximum GA. In our study we used a horizontal set-up, while Kammers et al. (Citation2010) and Heed et al. (Citation2011) used a vertical set-up which is thought to induce a stronger embodiment experience (questionnaire ratings) during the classic version of the RHI (Bekrater-Bodmann et al., Citation2012). The overall agreement in the subjective questionnaire statements in our experiment is also lower compared to the previous studies (Lopez et al., Citation2012; Radziun & Ehrsson, Citation2018). The mean value of ownership is close to zero and negative (-0.078), which can indicate uncertainty rather than full ownership. Despite the overall lower agreement, the effect size observed for the statements related to Ownership cluster (, statements 1, 8, 9 and 10), which is the core of the external body object ownership experience indeed indicates a change in the feeling of body ownership between the synchronous and asynchronous condition, despite being less evident than in the visual RHI (Gallagher et al., Citation2021). Moreover, the huge variability among procedures and questionnaire measures (Riemer et al., Citation2019), in conjunction with the scarce amount of studies based on the somatic version of the RHI, makes a direct comparison with previous studies difficult. Interestingly, the greater agreement observed for the Compliance cluster following the synchronous stimulation can lead to thinking that the suggestibility of participants might have a role in the establishment of the illusion. Our finding is partially in line with the study of Lopez et al. (Citation2012); these authors observed greater agreement after the delivery of synchronous stimulation in one of the statements of the cluster Compliance (, statements 4: “I experienced that my right hand was moving”). Particularly, the individual data plotting of the Compliance statement in our study might be in support of the idea that ownership studies should investigate individual differences for these aspects, as we show that the average of the group might be masking a varied performance. The role of suggestibility in the explanation of the RHI phenomenon has been discussed recently. For example, Marotta et al. (Citation2016) explore sensory suggestibility in the RHI, Lush et al. (Citation2020) and Lush et al. (Citation2020) suggest that the RHI findings are the result of top-down factors, and invite researchers to account for suggestibility. We cannot rule out if a stronger sense of ownership would change the effects on the GA, and future studies could indeed look at either developing a stronger version of the somatic RHI (i.e. able to induce a stronger sense of ownership, more implicit so that it controls also for suggestibility and compliance) or at reducing the time interval between the illusion and the movement.
Despite the limitations of relying on the questionnaire results to identify changes in ownership, we observed a clear drift in the direction of the rubber hand, the strength of which was comparable to previous findings (Ehrsson et al., Citation2005; Lopez et al., Citation2012). Although we acknowledge the presence of a debate about the fact that the proprioceptive drift measure may or may not be considered as a proxy of the ownership experience towards the rubber hand (Rohde et al., Citation2011), a general consensus has not yet been reached about the exclusion of this parameter as indicative of the embodiment of the rubber hand. As such, we believe that our measures indicate a change in proprioception and this is robust enough to say that something did change in the system used to plan the grasp.
In summary, our behavioural results suggest that when the RHI is induced via touch only, there is not enough impact on the motion planning and execution, at least for the grip aperture, to change the movement itself. However, our study is also helpful in highlighting the many experimental challenges that one faces when trying to test such a hypothesis using the somatic version of the illusion, and we hope it provides useful reflections for future studies on the same topic.
However, this is just the behavioural outcome: it could be that the internal processes related to maximum GA in the brain could have been impacted by the illusion. As such we did explore also the brain activity within the visual and tactile dorsal stream (Dijkerman & De Haan, Citation2007; Milner & Goodale, Citation2008).
Interestingly, we observed a trend in terms of deactivation of the right supplementary motor area (SMA) after the somatic RHI. The right SMA is one of the brain regions of the dorsal streams (Cavina-Pratesi et al., Citation2010; van Polanen & Davare, Citation2015) whose caudal portion directly projects to the motor cortex (M1) (Liu et al., Citation2002; Luppino et al., Citation1993). The right SMA is involved in different motion related functions (Duque et al., Citation2010; Nachev et al., Citation2008). For example, SMA modulates the interhemispheric interactions with M1 during movement preparation (Welniarz et al., Citation2019). Our trend for SMA suggests that the illusion might affect the communication between the ipsilateral SMA (right) and the contralateral M1 (left). However, the perturbation of the SoBO in our experiments was not strong enough to elicit a robust change. An initial perturbation of the right SMA, suggested by our findings, might not have lasted long because of the visual input being available very shortly after experiencing the illusion by the participant, as discussed above, which might have restored the interhemisperic communication between the areas. To clarify the presence of an effect on the brain activity due to the exposure to the somatic RHI, conducting only a synchronous stimulation and for a longer duration (Gallagher et al., Citation2021) could reveal more in terms of processes changes, as interhemispheric communication might then be slower to restore even in the presence of a visual input due to the bodily illussion being stronger itself.
We also run an exploratory analysis of the brain activity during the establishment of the somatic RHI. Given the relevance of the order of stimulation (asynchronous versus synchronous as first stimulation) and the implication this might have for our results, as explained above, we had hoped that the brain imaging data acquired during the somatic RHI might further clarify the complex picture that emerged. Unfortunately, our data did not survive statistical corrections, as such they should be interpreted with caution. We observed a non-corrected change of the left M1 only in the participants who experienced first the asynchronous stimulation and then the synchronous stimulation. On a more general level, such finding if confirmed would be in agreement with the recent literature on the cortical excitability of M1 during the classic RHI (Fossataro et al., Citation2018). On a more specific level, it might suggest caution with order of stimulation in RHI experimental set ups, as order matters if one is looking at brain activations and not only behavioural parameters.
Overall our findings, despite the limitations mentioned above, are more aligned with previous work suggesting that rather than the RHI being responsible for changes in movement, the visual input is the most influential parameter taken into account when planning and executing a grasping action.
Supplemental Material
Download MS Excel (22.9 KB)Supplemental Material
Download MS Excel (39.1 KB)Supplemental Material
Download MS Excel (129.7 KB)ACKNOWLEDGMENTS
We would like to thank two anonymous reviewers for their suggestions to improve the clarity of the manuscript and for their constructive feedback.
DISCLOSURE STATEMENT
No potential conflict of interest was reported by the authors.
DATA AVAILABILITY STATEMENT
The data that support the findings of this study are openly available in OSF at https://osf.io/963cq/ [DOI 10.17605/OSF.IO/963CQ].
Additional information
Funding
Notes
1 It should be noted that even if the strokes in the RHI are focused on the index finger, this is enough to modify the SoO of the entire hand (Botvinik & Cohen, 1998). Hence one can imagine an effect also on the GA, because of the influence that goes beyond the single digit (e.g., index finger).
Related Research Data
REFERENCES
- Ambron, E., Miller, A., Connor, S., & Coslett, H. B. (2020). Virtual image of a hand displaced in space influences action performance of the real hand. Scientific Reports, 10(1), 1–11. https://doi.org/10.1038/s41598-020-66348-4
- An, J., Jin, S. H., Lee, S. H., Jang, G., Abibullaev, B., Lee, H., Moon, J. I. (2013). Cortical activation pattern for grasping during observation, imagery, execution, FES, and observation-FES integrated BCI: An fNIRS pilot study. In Proceedings of the Annual International Conference of the IEEE Engineering in Medicine and Biology Society, EMBS. https://doi.org/10.1109/EMBC.2013.6611005
- Arizono, N., Ohmura, Y., Yano, S., & Kondo, T. (2016). Functional connectivity analysis of NIRS data under rubber hand illusion to find a biomarker of sense of ownership. Neural Plasticity, 2016, 6726238. https://doi.org/10.1155/2016/6726238
- Bekrater-Bodmann, R., Foell, J., Diers, M., & Flor, H. (2012). The perceptual and neuronal stability of the rubber hand illusion across contexts and over time. Brain Research, 1452, 130–139. https://doi.org/10.1016/j.brainres.2012.03.001
- Benjamini, Y., & Hochberg, Y. (1995). Controlling the false discovery rate: A practical and powerful approach to multiple testing. Journal of the Royal Statistical Society: Series B (Methodological), 57(1), 289–300.
- Bernardi, N. F., Marino, B. F., Maravita, A., Castelnuovo, G., Tebano, R., & Bricolo, E. (2013). Grasping in wonderland: Altering the visual size of the body recalibrates the body schema. Experimental Brain Research, 226(4), 585–594.
- Botvinick, M., & Cohen, J. (1998). Rubber hands “feel” touch that eyes see. Nature, 391(6669), 756–756. https://doi.org/10.1038/35784
- Brigadoi, S., Ceccherini, L., Cutini, S., Scarpa, F., Scatturin, P., Selb, J., Gagnon, L., Boas, D. A., & Cooper, R. J. (2014). Motion artifacts in functional near-infrared spectroscopy: A comparison of motion correction techniques applied to real cognitive data. NeuroImage, 85, 181–191. https://doi.org/10.1016/j.neuroimage.2013.04.082
- Castiello, U. (1996). Grasping a fruit: Selection for action. Journal of experimental psychology. Human perception and performance, 22(3), 582–603. https://doi.org/10.1037/0096-1523.22.3.582
- Cavina-Pratesi, C., Ietswaart, M., Humphreys, G. W., Lestou, V., & Milner, A. D. (2010). Impaired grasping in a patient with optic ataxia: Primary visuomotor deficit or secondary consequence of misreaching? Neuropsychologia, 48(1), 226–234. https://doi.org/10.1016/j.neuropsychologia.2009.09.008
- Cavina-Pratesi, C., Monaco, S., Fattori, P., Galletti, C., McAdam, T. D., Quinlan, D. J., Goodale, M. A., & Culham, J. C. (2010). Functional magnetic resonance imaging reveals the neural substrates of arm transport and grip formation in reach-to-grasp actions in humans. Journal of Neuroscience, 30(31), 10306–10323. https://doi.org/10.1523/JNEUROSCI.2023-10.2010
- Cooper, R. J., Selb, J., Gagnon, L., Phillip, D., Schytz, H. W., Iversen, H. K., Ashina, M., & Boas, D. A. (2012). A systematic comparison of motion artifact correction techniques for functional near-infrared spectroscopy. Frontiers in Neuroscience, 6 https://doi.org/10.3389/fnins.2012.00147
- Cope, M., & Delpy, D. T. (1988). System for long-term measurement of cerebral blood and tissue oxygenation on newborn infants by near infra-red transillumination. Medical & Biological Engineering & Computing, 26(3), 289–294. https://doi.org/10.1007/BF02447083
- de Haan, E. H. F., & Dijkerman, H. C. (2020). Somatosensation in the brain: A theoretical re-evaluation and a new model. Trends in Cognitive Sciences, 24(7), 529–541. https://doi.org/10.1016/j.tics.2020.04.003
- della Gatta, F., Garbarini, F., Puglisi, G., Leonetti, A., Berti, A., & Borroni, P. (2016). Decreased motor cortex excitability mirrors own hand disembodiment during the rubber hand illusion. eLife, 5 https://doi.org/10.7554/eLife.14972
- Delpy, D. T., Cope, M., Van Der Zee, P., Arridge, S., Wray, S., & Wyatt, J. (1988). Estimation of optical pathlength through tissue from direct time of flight measurement. Physics in Medicine and Biology, 33(12), 1433–1442. https://doi.org/10.1088/0031-9155/33/12/008
- Dienes, Z. (2014). Using Bayes to get the most out of non-significant results. Frontiers in psychology, 5, 781. https://doi.org/10.3389/fpsyg.2014.00781
- Dijkerman, H. C., & De Haan, E. H. F. (2007). Somatosensory processes subserving perception and action. The Behavioral and brain sciences, 30(2), 189.
- Duncan, A., Meek, J. H., Clemence, M., Elwell, C. E., Fallon, P., Tyszczuk, L., Cope, M., & Delpy, D. T. (1996). Measurement of cranial optical path length as a function of age using phase resolved near infrared spectroscopy. Pediatric Research, 39(5), 889–894. https://doi.org/10.1203/00006450-199605000-00025
- Duque, J., Lew, D., Mazzocchio, R., Olivier, E., & Ivry, R. B. (2010). Evidence for two concurrent inhibitory mechanisms during response preparation. Journal of Neuroscience, 30(10), 3793–3802. https://doi.org/10.1523/JNEUROSCI.5722-09.2010
- Ehrsson, H. H. (2012). The concept of body ownership and its relation to multisensory integration. In The New handbook of multisensory process.
- Ehrsson, H. H., Holmes, N. P., & Passingham, R. E. (2005). Touching a rubber hand: Feeling of body ownership is associated with activity in multisensory brain areas. Journal of Neuroscience, 25(45), 10564–10573. https://doi.org/10.1523/JNEUROSCI.0800-05.2005
- Ehrsson, H. H., Wiech, K., Weiskopf, N., Dolan, R. J., & Passingham, R. E. (2007). Threatening a rubber hand that you feel is yours elicits a cortical anxiety response. Proceedings of the National Academy of Sciences, 104(23), 9828–9833. https://doi.org/10.1073/pnas.0610011104
- Erdfelder, E., FAul, F., Buchner, A., & Lang, A. G. (2009). Statistical power analyses using G*Power 3.1: Tests for correlation and regression analyses. Behavior Research Methods, 41(4), 1149–1160. https://doi.org/10.3758/BRM.41.4.1149
- Faivre, N., Dönz, J., Scandola, M., Dhanis, H., Bello Ruiz, J., Bernasconi, F., Salomon, R., & Blanke, O. (2017). Self-grounded vision: Hand ownership modulates visual location through cortical β and γ oscillations. The Journal of neuroscience : The official journal of the Society for Neuroscience, 37(1), 11–22.
- Faul, F., Erdfelder, E., Lang, A. G., & Buchner, A. (2007). G*Power 3: A flexible statistical power analysis program for the social, behavioral, and biomedical sciences. Behavior Research Methods, 39(2), 175–191. https://doi.org/10.3758/BF03193146
- Ferri, F., Ambrosini, E., Pinti, P., Merla, A., & Costantini, M. (2017). The role of expectation in multisensory body representation – neural evidence. European Journal of Neuroscience, 46(3), 1897–1905. https://doi.org/10.1111/ejn.13629
- Filippetti, M. L., Lloyd-Fox, S., Longo, M. R., Farroni, T., & Johnson, M. H. (2015). Neural mechanisms of body awareness in infants. Cerebral Cortex, 25(10), 3779–3787. https://doi.org/10.1093/cercor/bhu261
- Flögel, M., Kalveram, K. T., Christ, O., & Vogt, J. (2016). Application of the rubber hand illusion paradigm: Comparison between upper and lower limbs. Psychological Research, 80(2), 298–306. https://doi.org/10.1007/s00426-015-0650-4
- Fossataro, C., Bruno, V., Giurgola, S., Bolognini, N., & Garbarini, F. (2018). Losing my hand. Body ownership attenuation after virtual lesion of the primary motor cortex. European Journal of Neuroscience, 48(6), 2272–2287. https://doi.org/10.1111/ejn.14116
- Franceschini, M. A., Toronov, V., Filiaci, M. E., Gratton, E., & Fantini, S. (2000). On-line optical imaging of the human brain with 160-ms temporal resolution. Optics Express, 6(3), 49–57. https://doi.org/10.1364/oe.6.000049
- Gabbard, C. P. (2008). Lifelong motor development (5th ed.). Pearson-Benjamin Cummings.
- Gallagher, M., Colzi, C., & Sedda, A. (2021). Dissociation of proprioceptive drift and feelings of ownership in the somatic rubber hand illusion. Acta Psychologica, 212, 103192. https://doi.org/10.1016/j.actpsy.2020.103192
- Grivaz, P., Blanke, O., & Serino, A. (2017). Common and distinct brain regions processing multisensory bodily signals for peripersonal space and body ownership. NeuroImage, 147, 602–618.
- Goodale, M. A., & Humphrey, G. K. (1998). The objects of action and perception. Cognition, 67(1–2), 181–207. https://doi.org/10.1016/S0010-0277(98)00017-1
- Goodale, M. A., Meenan, J. P., Bülthoff, H. H., Nicolle, D. A., Murphy, K. J., & Racicot, C. I. (1994). Separate neural pathways for the visual analysis of object shape in perception and prehension. Current Biology, 4(7), 604–610. https://doi.org/10.1016/S0960-9822(00)00132-9
- Goodale, M. A., & Milner, A. D. (1992). Separate visual pathways for perception and action. Trends in Neurosciences, 15(1), 20–25. https://doi.org/10.1016/0166-2236(92)90344-8
- Heed, T., Gründler, M., Rinkleib, J., Rudzik, F. H., Collins, T., Cooke, E., & O'Regan, J. K. (2011). Visual information and rubber hand embodiment differentially affect reach-to-grasp actions. Acta Psychologica, 138(1), 263–271. https://doi.org/10.1016/j.actpsy.2011.07.003
- Holmes, N. P., Snijders, H. J., & Spence, C. (2006). Reaching with alien limbs: Visual exposure to prosthetic hands in a mirror biases proprioception without accompanying illusions of ownership. Perception & Psychophysics, 68(4), 685–701. https://doi.org/10.3758/bf03208768
- Huppert, T. J., Diamond, S. G., Franceschini, M. A., & Boas, D. A. (2009). HomER: A review of time-series analysis methods for near-infrared spectroscopy of the brain. Applied Optics, 48(10), D280–D298. https://doi.org/10.1364/ao.48.00d280
- Ionta, S., & Blanke, O. (2009). Differential influence of hands posture on mental rotation of hands and feet in left and right handers. Experimental Brain Research, 195(2), 207–217. https://doi.org/10.1007/s00221-009-1770-0
- Isayama, R., Vesia, M., Jegatheeswaran, G., Elahi, B., Gunraj, C. A., Cardinali, L., Farnè, A., & Chen, R. (2019). Rubber hand illusion modulates the influences of somatosensory and parietal inputs to the motor cortex. Journal of Neurophysiology, 121(2), 563–573. https://doi.org/10.1152/jn.00345.2018
- Jasper, H. (1958). The ten twenty electrode system of the international federation. Electroencephalography and Clinical Neurophysiology,
- Jeannerod, M. (1984). The timing of natural prehension movements. Journal of Motor Behavior, 16(3), 235–254. https://doi.org/10.1080/00222895.1984.10735319
- Kammers, M. P., de Vignemont, F., Verhagen, L., & Dijkerman, H. C. (2009). The rubber hand illusion in action. Neuropsychologia, 47(1), 204–211. https://doi.org/10.1016/j.neuropsychologia.2008.07.028
- Kammers, Marjolein, P. M., Kootker, J. A., Hogendoorn, H., & Dijkerman, H. C. (2010). How many motoric body representations can we grasp? Experimental Brain Research, 202(1), 203–212. https://doi.org/10.1007/s00221-009-2124-7
- Karok, S., & Newport, R. (2010). The continuous updating of grasp in response to dynamic changes in object size, hand size and distractor proximity. Neuropsychologia, 48(13), 3891–3900.
- Konen, C. S., Mruczek, R. E. B., Montoya, J. L., & Kastner, S. (2013). Functional organization of human posterior parietal cortex: Grasping- and reaching-related activations relative to topographically organized cortex. Journal of Neurophysiology, 109(12), 2897–2908. https://doi.org/10.1152/jn.00657.2012
- Lenggenhager, B., Hilti, L., & Brugger, P. (2015). Disturbed body integrity and the “rubber foot illusion. Neuropsychology, 29(2), 205–211. https://doi.org/10.1037/neu0000143
- Liu, J., Morel, A., Wannier, T., & Rouiller, E. M. (2002). Origins of callosal projections to the supplementary motor area (SMA): A direct comparison between pre-SMA and SMA-proper in macaque monkeys. Journal of Comparative Neurology, https://doi.org/10.1002/cne.10087
- Lloyd-Fox, S., Blasi, A., & Elwell, C. E. (2010). Illuminating the developing brain: The past, present and future of functional near infrared spectroscopy. Neuroscience and Biobehavioral Reviews, https://doi.org/10.1016/j.neubiorev.2009.07.008
- Lopez, C., Bieri, C. P., Preuss, N., & Mast, F. W. (2012). Tactile and vestibular mechanisms underlying ownership for body parts: A non-visual variant of the rubber hand illusion. Neuroscience Letters, 511(2), 120–124. https://doi.org/10.1016/j.neulet.2012.01.055
- Luo, Z., Jose, P. E., Huntsinger, C. S., & Pigott, T. D. (2007). Fine motor skills and mathematics achievement in East Asian American and European American kindergartners and first graders. British Journal of Developmental Psychology, 25(4), 595–614. https://doi.org/10.1348/026151007X185329
- Luppino, G., Matelli, M., Camarda, R., & Rizzolatti, G. (1993). Corticocortical connections of area F3 (SMA‐proper) and area F6 (pre‐SMA) in the macaque monkey. Journal of Comparative Neurology, https://doi.org/10.1002/cne.903380109
- Lush, P., Botan, V., Scott, R. B., Seth, A. K., Ward, J., & Dienes, Z. (2020). Trait phenomenological control predicts experience of mirror synaesthesia and the rubber hand illusion. Nature Communications, 11(1), 1–10. https://doi.org/10.1038/s41467-020-18591-6
- Lush, P. (2020). Demand characteristics confound the rubber hand illusion. Collabra: Psychology, 6(1) https://doi.org/10.1525/collabra.325
- Marotta, A., Tinazzi, M., Cavedini, C., Zampini, M., & Fiorio, M. (2016). Individual differences in the rubber hand illusion are related to sensory suggestibility. Plos One, 11(12), e0168489. https://doi.org/10.1371/journal.pone.0168489
- Menant, J. C., Maidan, I., Alcock, L., Al-Yahya, E., Cerasa, A., Clark, D. J., de Bruin, E. D., Fraser, S., Gramigna, V., Hamacher, D., Herold, F., Holtzer, R., Izzetoglu, M., Lim, S., Pantall, A., Pelicioni, P., Peters, S., Rosso, A. L., St George, R., … Mirelman, A. (2020). A consensus guide to using functional near-infrared spectroscopy in posture and gait research. Gait & Posture, 82, 254–265.
- Milner, A. D., & Goodale, M. A. (2008). Two visual systems re-viewed. Neuropsychologia, 46(3), 774–785. https://doi.org/10.1016/j.neuropsychologia.2007.10.005
- Milner, D., & Goodale, M. (2006). The visual brain in action. OUP Oxford. https://doi.org/10.1093/acprof:oso/9780198524724.001.0001
- Molavi, B., & Dumont, G. A. (2012). Wavelet-based motion artifact removal for functional near-infrared spectroscopy. Physiological Measurement, 33(2), 259–270. https://doi.org/10.1088/0967-3334/33/2/259
- Nachev, P., Kennard, C., & Husain, M. (2008). Functional role of the supplementary and pre-supplementary motor areas. Nature Reviews Neuroscience, 9(11), 856–869. https://doi.org/10.1038/nrn2478
- Newport, R., Pearce, R., & Preston, C. (2010). Fake hands in action: Embodiment and control of supernumerary limbs. Experimental Brain Research, 204(3), 385–395. https://doi.org/10.1007/s00221-009-2104-y
- Radziun, D., & Ehrsson, H. H. (2018). Auditory cues influence the rubber-hand illusion. Journal of Experimental Psychology: Human Perception and Performance, 44(7), 1012–1021. https://doi.org/10.1037/xhp0000508
- Riemer, M., Trojan, J., Beauchamp, M., & Fuchs, X. (2019). The rubber hand universe: On the impact of methodological differences in the rubber hand illusion. Neuroscience and Biobehavioral Reviews, https://doi.org/10.1016/j.neubiorev.2019.07.008
- Rohde, M., Luca, M., & Ernst, M. O. (2011). The rubber hand illusion: Feeling of ownership and proprioceptive drift Do not go hand in hand. PLoS One. 6(6), e21659. https://doi.org/10.1371/journal.pone.0021659
- Sasai, S., Homae, F., Watanabe, H., & Taga, G. (2011). Frequency-specific functional connectivity in the brain during resting state revealed by NIRS. NeuroImage, 56(1), 252–257. https://doi.org/10.1016/j.neuroimage.2010.12.075
- Sato, H., Yahata, N., Funane, T., Takizawa, R., Katura, T., Atsumori, H., Nishimura, Y., Kinoshita, A., Kiguchi, M., Koizumi, H., Fukuda, M., & Kasai, K. (2013). A NIRS-fMRI investigation of prefrontal cortex activity during a working memory task. NeuroImage, 83, 158–173. https://doi.org/10.1016/j.neuroimage.2013.06.043
- Schlicht, E. J., & Schrater, P. R. (2007). Effects of visual uncertainty on grasping movements. Experimental Brain Research, 182(1), 47–57.
- Sedda, A., Monaco, S., Bottini, G., & Goodale, M. A. (2011). Integration of visual and auditory information for hand actions: Preliminary evidence for the contribution of natural sounds to grasping. Experimental Brain Research, 209(3), 365–374. https://doi.org/10.1007/s00221-011-2559-5
- Shibuya, S., Unenaka, S., Zama, T., Shimada, S., & Ohki, Y. (2018). Spontaneous imitative movements induced by an illusory embodied fake hand. Neuropsychologia, 111, 77–84.
- Shimada, S., Fukuda, K., & Hiraki, K. (2009). Rubber hand illusion under delayed visual feedback. PLoS One. 4(7), e6185. https://doi.org/10.1371/journal.pone.0006185
- Strangman, G., Culver, J. P., Thompson, J. H., & Boas, D. A. (2002). A quantitative comparison of simultaneous BOLD fMRI and NIRS recordings during functional brain activation. NeuroImage, 17(2), 719–731. https://doi.org/10.1006/nimg.2002.1227
- Tamè, L., Linkenauger, S. A., & Longo, M. R. (2018). Dissociation of feeling and belief in the rubber hand illusion. Plos One, 13(10), e0206367. https://doi.org/10.1371/journal.pone.0206367
- van Polanen, V., & Davare, M. (2015). Interactions between dorsal and ventral streams for controlling skilled grasp. Neuropsychologia, 79, 186–191. https://doi.org/10.1016/j.neuropsychologia.2015.07.010
- Veale, J. F. (2014). Edinburgh handedness inventory - short form: A revised version based on confirmatory factor analysis. Laterality: Asymmetries of Body, Brain and Cognition, https://doi.org/10.1080/1357650X.2013.783045
- Welniarz, Q., Gallea, C., Lamy, J., Méneret, A., Popa, T., Valabregue, R., Béranger, B., Brochard, V., Flamand‐Roze, C., Trouillard, O., Bonnet, C., Brüggemann, N., Bitoun, P., Degos, B., Hubsch, C., Hainque, E., Golmard, J., Vidailhet, M., Lehéricy, S., … Roze, E. (2019). The supplementary motor area modulates interhemispheric interactions during movement preparation. Human Brain Mapping, 40(7), 2125–2142. https://doi.org/10.1002/hbm.24512
- Yeo, S. S., Chang, P. H., & Jang, S. H. (2013). The cortical activation differences between proximal and distal joint movements of the upper extremities: A functional NIRS study. NeuroRehabilitation, 32(4), 861–866. https://doi.org/10.3233/NRE-130910
- Zopf, R., Truong, S., Finkbeiner, M., Friedman, J., & Williams, M. A. (2011). Viewing and feeling touch modulates hand position for reaching. Neuropsychologia, 49(5), 1287–1293. https://doi.org/10.1016/j.neuropsychologia.2011.02.012