
Abstract
The CO2 corrosion behavior of IG-110 nuclear graphite has been investigated using the gas chromatography method which allows the continuous analysis of the CO2/CO gas mixture at the outlet of the corrosion chamber. The effects of temperature and initial CO2 concentration are studied based on the Arrhenius-type reaction model. From 745 to 995 °C, the Arrhenius curve shows a linear behavior. For higher temperatures, a non-linear behavior is observed. The activation energy is calculated as 210 kJ/mole and is independent of the initial CO2 inlet concentrations of 10%, 14% and 17%. The corrosion behavior at 1145 °C, in the diffusion-controlled regime, has also been investigated. At this temperature, the interior of IG-110 graphite is severely attacked by CO2, and the material's surface morphology is changed drastically. A measurement of the corrosion rate against corrosion time shows that the corrosion rate initially increases to a maximum value at a weight loss degree of 30%–35%, after which it begins to decline.
1. Introduction
The high temperature gas-cooled reactor (HTGR) is one of the most promising advanced nuclear energy systems due to its inherent safety and economic competitiveness [Citation1,2]. A 10 MW high-temperature pebble-bed reactor (HTR-10) has been successfully designed and constructed at the Institute of Nuclear and New Energy of Technology (INET), Tsinghua University [Citation3]. On the basis of this success, two 250 MW high-temperature prototype modules (HTR-PM) are now under construction in China.
In HTGR, nuclear graphite is applied as the moderator, reflector and structure material because of its excellent performance and mechanical stability under the hostile radiation conditions. In the helium-cooled HTR-PM reactor, the nuclear graphite IG-110 produced by Toyo Tanso Co. Ltd. is used. When the reactor is in normal operation, the oxidizing impurities in the helium coolant may corrode the nuclear graphite thereby degrading its mechanical and thermal properties. Ultimately this corrosion process may negatively affect the safety of the reactor [Citation4–7]. Thus, one of the main safety subjects is to study the corrosion behavior of nuclear graphite by oxidizing substances in the coolant.
The impurity contents of the primary helium coolant in HTR-PM under normal operation conditions (referred to as the HTR-10 values [Citation3,Citation8]) are shown in . From this data, it follows that the content of CO2 is the highest among the main oxidizing impurities which include H2O, O2 and CO2. In this work, the corrosion behavior of IG-110 nuclear graphite by CO2 is investigated in detail.
Table 1. Impurity contents in the primary helium coolant in HTR-PM under normal operation conditions.
Thermo gravimetric analysis is the usually applied method for the investigation of carbon gasification [Citation1,Citation9,Citation10,11], where the reaction time and the weight loss of the carbon are recorded, usually as a function of temperature, initial gas concentration and weight loss degree. However, with this method, it is not possible to study the effect of the composition of the gaseous corrosion products. In the present study, we therefore have used the gas chromatography (GC) method which allows the continuous analysis of the gas flow at the outlet of the corrosion chamber. In this way, not only the effect of temperature, initial gas concentration and weight loss degree, but also the influence of the gaseous product composition and partial concentration are taken into account when investigating the corrosion behavior.
In the literature, the gasification of carbon is usually divided into two regimes: the kinetic-controlled regime at low temperatures and the diffusion-controlled regime at high temperatures [Citation12,13]. In the kinetic-controlled regime, the corrosion rate is controlled by the reaction kinetics; while in the diffusion-controlled regime, the corrosion rate is limited by the diffusion of the reacting gas. In general, most studies deal with the corrosion behavior in the kinetic-controlled regime [Citation9,Citation14,Citation15], and less attention is given to the corrosion behavior in the diffusion-controlled regime. In this work, the focus is on the corrosion behavior of IG-110 nuclear graphite in the diffusion-controlled regime.
2. Experimental
2.1. Apparatus and experiment
The IG-110 nuclear graphite is a quasi-isotropic fine-grained graphite manufactured by cold isostatic pressing. The main properties of this type of graphite are shown in [Citation16]. The specimens used in the present experiment were machined to a cuboid shape with average outer dimensions of 28.6 mm×28.1 mm×2.0 mm. The bulk density of the specimens before and after corrosion is determined by dividing the mass of the sample by its volume. The specific surface area is measured by a BET (Brunauer, Emmett and Teller) surface area analyzer (QuadraSorb SI-MP). The variation of the surface area among the specimens is minor in this work. The microstructure of the graphite is observed by scanning electron microscopy (SEM, JEOL JSM-7001F, Japan Electron Optics Laboratory Co. Ltd.).
Table 2. Main properties of IG-110 nuclear graphite.
The gas flow route of the experimental setup is shown schematically in . Two mass flow meters (D07-19B, Sevenstar Electronics Co. Ltd.) with a detection accuracy of 1% were used to monitor the mass flow of the helium carrier gas (99.999%) and the reacting CO2 gas (⩾ 99.995%). After mixing, the CO2/He mixture was fed into the corrosion chamber which is a quartz tube surrounded by a temperature-controlled oven. The length of the tube is 120 cm, and its inner diameter is 29 mm. The uniformity (within 1 °C) of the temperature inside the oven was monitored by three thermocouples evenly distributed over the hot area of the oven right under the tube. The corrosion temperature was calibrated by a fourth thermocouple placed in the center of the tube at the position of the graphite samples. During heating up, only the He carrier gas was admitted into the tube. Once the pre-set temperature was reached and became stable, the He and CO2 gas valves were adjusted to obtain a flow of reactant gas with the desired He/CO2 composition. During the corrosion process, the composition of the outlet gas (concentrations of CO and CO2) were measured by a gas chromatograph (GC-1100, Purkinje Co. Ltd.).
Figure 1. Gas flow route of the experimental setup.
Two kinds of corrosion experiments have been performed. In the first type, the composition of the outlet gas was monitored as a function of corrosion temperature and as a function of the He/CO2 composition at the inlet. It has been reported in the literature that the corrosion rate depends on the weight loss degree, and the corrosion rate RC is determined during the induction period when the weight loss degree is very low [Citation14,Citation17]. To decrease the weight loss degree when determining RC, five samples were placed side by side as one set in the center of the corrosion chamber. The second type of experiment involves one sample which was kept at a constant temperature of 1145 °C in the diffusion-controlled regime. The composition of the outlet gas was monitored as a function of time.
2.2. Measurement of corrosion rate by GC
The stoichiometric equation of carbon dioxide–carbon reaction is given by
(1) Based on the conservation of total oxygen species between the inlet and outlet gas flow, the corresponding corrosion rate is given by
(2) where RC is the mass corrosion rate of IG-110 specimen. Ci is the specific outlet gas concentration measured by the gas chromatograph, vCO2 is the flow rate of CO2 gas and ρCO2 is the density of CO2 gas at room temperature. MC and MCO2 are the molar mass of carbon and carbon dioxide, respectively.
By defining
(3) and
(4) the corrosion rate can be expressed as
(5) Because the gas flow meter was kept at room temperature and ρCO2 can be considered as a constant, the corrosion rate RC is proportional to Q value when the flow rate of CO2 is kept constant.
3. Results and discussion
3.1. Effect of temperature and initial CO2 concentration
It is well known that the graphite corrosion rate follows the Arrhenius-type reaction equation,
(6) where K0 is the pre-exponential factor and Ea is the activation energy. R is the gas constant. PCO2 is the partial pressure of the CO2 gas at the reacting surface and the superscript n reflects the reaction order. A is the active surface area which is a fraction of the total surface area [Citation12]. The active surface refers to the carbon atoms at lattice discontinuities including the prismatic and pyramidal faces of the graphite crystallites and those at defective centers in the basal planes.
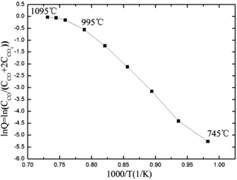
shows the Arrhenius plot for an initial CO2 concentration of 17%. The curve shows a linear relation between lnQ and reciprocal temperature from 745 to 995 °C. The activation energy Ea can be calculated as 210 kJ/mole in this temperature interval. For the temperature range above 995 °C, the behavior is no longer linear. Since Ea and the reactive surface area (A) are determined by the carbon dioxide–carbon reaction and the nature of the IG-110 graphite, respectively, they are both independent of temperature [Citation12]. Thus the reason for the observed deviation is thought to lie in the change of PCO2 at the reacting surface.
Figure 2. Curve of lnQ against 1000/T from 745 to 1095 °C for an initial CO2 concentration of 17%.
The CO2/IG-110 corrosion processes involve a series of diffusional and chemical steps [Citation14,Citation18], which are summarized as follows:
diffusion of CO2 to the external surface of the sample from the gas fluid stream;
diffusion of CO2 to the internal surface through the pore structure;
surface chemical reaction;
diffusion of corrosion product away from the internal and external surfaces to the gas fluid stream.
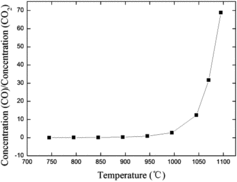
The CO2/IG-110 corrosion begins at 745 °C, and the corrosion rate is controlled by chemical kinetics in the linear regime from 745 to 995 °C. It is called the kinetic-controlled regime. In this regime, the CO2 concentration on the internal and external surfaces is equal to that of the gas fluid stream. shows that above 995 °C, the CO to CO2 ratio measured at the outlet increases steeply. This has as an effect that large quantities of CO molecules formed retard the required diffusion of CO2 molecules to the corrosion surface. Besides, not enough CO2 molecules are supplied to the corrosion surface since the increase of the diffusion rate with temperature cannot keep pace with that of the chemical rate [Citation18]. Due to these two effects, a CO2 concentration gradient develops from the gas fluid stream to the corrosion surface. In this temperature range, the corrosion rate is thus controlled by the diffusion processes. From the analysis above, it is concluded that the reason for the deviation of Arrhenius behavior lies in the change of PCO2 in the diffusion-controlled regime.
Figure 3. Outlet gas concentration ratio of CO to CO2 from 745 to 1095 °C for an initial CO2 concentration of 17%.
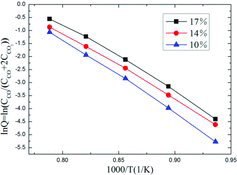
shows the Arrhenius curves of CO2/IG-110 corrosion from 795 to 995 °C for three initial CO2 concentrations of 10%, 14% and 17%, respectively. It is found that the curves share the same trend. Since the activation energy Ea is calculated through multiplying the slope value by the gas constant R, it can be seen that the activation energy values are almost the same for the three initial CO2 concentrations.
Figure 4. Curves of lnQ against 1000/T from 745 to 1095 °C for three initial CO2 concentration of 10%, 14% and 17%.
3.2. Corrosion behavior at 1145 °C
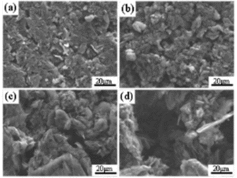
The investigation of CO2 corrosion behavior in the diffusion-controlled regime is performed at the temperature of 1145 °C. The CO2 concentration is 14%. shows the SEM micrographs of the graphite surface at different weight loss degrees. These specimens have been corroded for different time to weight loss degrees of 10.4%, 25.0% and 41.7%, respectively. The micrographs reveal that the pores on the surface grow larger and deeper with increasing weight loss degree.
Figure 5. SEM micrograph of the surface of IG-110 corroded to weight loss degrees of 0%, 10.4%, 25.0% and 41.7% at 1145 °C.
shows some parameters of the specimens corroded to different weight loss degrees. It should be noted that there is no pronounced dimensional change for the specimens with a weight loss degree of 7.3%, 10.4%, 14.4% and 25.0%. For the sample with a weight loss degree of 41.7%, the volume change is higher but still much lower than the weight loss degree of 41.7%. In , it is found that the bulk density decreases more drastically than the volume which implies that under the experimental conditions at 1145 °C, mainly, the interior of the specimen is corroded by CO2.
Table 3. Some parameters of the specimens corroded to different weight loss degrees at 1145 °C.
Based on the average dimension of the pristine specimens (see ) an external surface of about 1.6 × 103 mm2 is obtained. The BET surface area is measured as 0.086 m2/g, which is close to 0.090 m2/g measured by Choi [Citation19]. By multiplying the specific surface area by the specimen mass, a total surface area of 2.4 × 105 mm2 is calculated, which is much (two orders of magnitude) higher than the external surface area. This reveals that the corrosion occurs mainly on the internal surface.
shows the calculated Q value and the individual CO2 and CO outlet gas concentrations as function of corrosion time at 1145 °C. One piece of IG-110 graphite with the initial mass of 2.80 g is used and the initial CO2 concentration is 14%. After finishing the corrosion experiment (after about 15 h), only graphite powder with a total mass of about 0.2 g was found remaining in the tube. After the initial stage of approximately 50 min, the corrosion rate reaches a maximum value at around 300 min. The outlet gas concentration ratio of CO to CO2 at this stage is around 5, much less than the value that can be extrapolated from . The reason is that only one piece of specimen is used, and the corrosion surface area is much less, compared with five pieces in . After the maximum value, the corrosion rate begins to decline. In this range, the outlet gas concentration ratio of CO to CO2 decreases, which decreases the retardation effect of CO on the diffusion steps.
Figure 6. Q value and CO2/CO concentration as a function of corrosion time at 1145 °C.
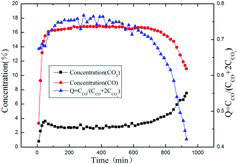
During the CO2/IG-110 corrosion processes with time, on one hand, the blind pores which initially are inaccessible for the CO2 are opened and the smaller pores are widened [Citation14,Citation20]. They allow the increase of the active surface area. On the other hand, the pores may connect to other pores adjacent and even collapse [Citation14,Citation20], which leads to the decrease of the active surface area. In the first stage of the Q curve between 50 and 300 min, the former process is dominant, and the latter becomes dominant after 300 min in the second range. The maximum corrosion rate is therefore indicative of the highest reactive surface area [Citation14,Citation21,Citation22].
By assigning the integral under the whole Q curve to represent complete weight loss, the weight loss degree at which the maximum rate is observed can be calculated as below:
(7) where w is the weight loss degree at which the maximum corrosion rate is observed. Sm and Swhole are the integral area from the beginning to the moment at which the maximum rate is observed and the integral area of the whole curve, respectively. The initial mass minitial is 2.80 g, and the mass loss mloss is 2.60 g. The weight loss degree at which the maximum corrosion rate is observed is calculated as 30%–35%. It is similar to the result of 35%–40% by Kim et al. [Citation15].
4. Concluding remarks
GC method is used to study the CO2 corrosion behavior of IG-110 nuclear graphite. A series of experiments have been performed and the major findings are as follows.
The Arrhenius curve shows a linear behavior from 745 to 995 °C. At higher temperatures, a non-linear behavior is observed. In the lower temperature range, the activation energy is calculated as 210 kJ/mole and is independent of the initial CO2 inlet concentrations of 10%, 14% and 17%.
Mainly the interior of the IG-110 specimen is corroded by CO2 at 1145 °C. The corrosion rate increases because the blind pores are opened and the small pores are widened. After passing through the peak value, the corrosion rate declines because the pores are connected and collapsed. The maximum corrosion rate is indicative of the highest reactive surface area, and it is observed at weight loss degree of 30%–35%.
Additional information
Funding
Related Research Data
References
- Contescu CI, Azad S, Miller D, Lance MJ, Baker FS, Burchell TD. Practical aspects for characterizing air oxidation of graphite. J Nucl Mater. 2008;381(1–2):15–24.
- Li ZC, Chen DY, Fu XG, Miao W, Zhang ZJ. The influence of pores on irradiation property of selected nuclear graphites. Adv Mater Sci Eng. 2011;2012:1–6.
- Yu XL, Yu SY. Analysis of fuel element matrix graphite corrosion in HTR-PM for normal operating conditions. Nucl Eng Des. 2010;240(4):738–743.
- Berre C, Fok SL, Marsden BJ, Babout L, Hodgkins A, Marrow TJ, Mummery PM. Numerical modelling of the effects of porosity changes on the mechanical properties of nuclear graphite. J Nucl Mater. 2006;352(1–3):1–5.
- Kurumada A, Oku T, Harada K, Kawamata K, Sato S, Hiraoka T, McEnaney B. Effects of burn-off on thermal shock resistances of nuclear carbon materials. Carbon. 1997;35(8):1157–1165.
- Lim YS, Chi SH, Cho KY. Change of properties after oxidation of IG-11 graphite by air and CO2 gas. J Nucl Mater. 2008;374(1–2):123–128.
- Takahashi M, Kotaka M, Sekimoto H. Burn-off and production of CO and CO2 in the oxidation of nuclear reactor-grade graphites in a flow system. J Nucl Sci Tech. 1994;31(12):1275–1286.
- Luo XW, Yu SY. Assessment of graphite oxidation in HTR-10. Nucl Power Eng. 2007;28:67–70. Chinese.
- Hinssen HK, Kuhn K, Moormann R, Schlogl B, Fechter M, Mitchell M. Oxidation experiments and theoretical examinations on graphite materials relevant for the PBMR. Nucl Eng Des. 2008;238(11):3018–3025.
- Chi SH, Kim GC. Comparison of the oxidation rate and degree of graphitization of selected IG and NBG nuclear graphite grades. J Nucl Mater. 2008;381(1–2):9–14.
- Chen DY, Li ZC, Miao W, Zhang ZJ. Effects of porosity and temperature on oxidation behavior in air of selected nuclear graphites. Mater Trans. 2012;53(6):1159.
- El-Genk MS, Tournier JMP. Development and validation of a model for the chemical kinetics of graphite oxidation. J Nucl Mater. 2011;411(1–3):193–207.
- Luo XW, Robin JC, Yu SY. Effect of temperature on graphite oxidation behavior. Nucl Eng Des. 2004;227(3):273–280.
- Fuller L, Okoh JM. Kinetics and mechanisms of the reaction of air with nuclear grade graphites: IG-110. J Nucl Mater. 1997;240(3):241–250.
- Kim ES, No HC. Experimental study on the reaction between nuclear graphite IG-110 and carbon dioxide. J Nucl Mater. 2006;350(1):96–100.
- Kim ES, Lee KW, No HC. Analysis of geometrical effects on graphite oxidation through measurement of internal surface area. J Nucl Mater. 2006;348(1–2):174–180.
- Kim ES, No HC. Experimental study on the oxidation of nuclear graphite and development of an oxidation model. J Nucl Mater. 2006;349(1–2):182–194.
- Story SR, Fruehan RJ. Kinetics of oxidation of carbonaceous materials by CO2 and H2O between 1300 degrees and 1500 degrees. Metallurgical Mater Trans B. 2000;31(1):43–54.
- Choi WK, Kim BJ. Oxidation behavior of IG and NBG nuclear graphites. Nucl Eng Des. 2011;241(1): 82–87.
- Guo WM, Xiao HN, Zhang GJ. Kinetics and mechanisms of non-isothermal oxidation of graphite in air. Corrosion Sci. 2008;50(7):2007–2011.
- Lu GQ, Do DD. Preparation of economical sorbents for SO2 and NOX removal using coal washery reject. Carbon. 1991;29(2):207–213.
- Detorre LEC, Llanos JL, Bottani EJ. Graphite oxidation in air at different temperatures. Carbon. 1991;29(7):1051–1052.