
Abstract
The L X-ray photons emitted by transuranic (TRU) elements are expected to be useful for developing nondestructive TRU monitors. Energy spectra of L X-rays emitted by 241Am, 238Pu and 239Pu sources were measured by a transition edge sensor (TES) microcalorimeter, which allowed precise peak identification with high energy resolution. In the measurements using the TES microcalorimeter, the full width at half-maximum energy resolution was 62.6 eV at 17.222 keV for 239Pu source, 62.5 eV at 17.222 keV for 238Pu source and 60.9 eV at 17.751 keV for 241Am source. This study demonstrates the separation of 241Am and plutonium isotopes by L X-ray spectroscopy using a TES microcalorimeter.
1. Introduction
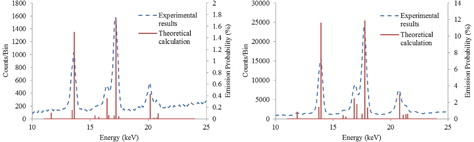
Plutonium management is necessary in nuclear plants, such as spent nuclear fuel reprocessing and mixed oxide fuel fabrication facilities. Currently, the plutonium isotopes are managed by α-ray spectroscopy after a complicated chemical process to remove 241Am, which is the progeny nuclide of 241Pu [Citation1]. Most transuranic (TRU) elements emit L X-ray photons following α decay. Because the energy of L X-ray photons emitted by TRU elements ranges from 10 to 22 keV, they are expected to be useful for developing nondestructive TRU monitors. shows an experimental energy spectrum of L X-rays (dashed lines) emitted by residual elements of 237Np resulting from α decay of 241Am, and of 235U resulting from α decay of 239Pu. Dashed and solid lines indicate spectra measured by conventional semiconductor detectors and determined by theoretical calculations, respectively [Citation2,Citation3]. The energy resolution of the semiconductor detector is insufficient to identify all L X-ray peaks in a mixture of these elements.
Figure 1. L X-ray energy spectra emitted by 239Pu (left) and 241Am (right) radiation sources measured by a semiconductor detector.
A microcalorimeter with a superconducting transition edge sensor (TES) has been developed that posse- sses excellent energy resolution [Citation4,Citation5]. We had previously developed a TES microcalorimeter with an absorption efficiency of 50% for photons with an energy of 20 keV to detect L X-ray photons emitted by TRU elements [Citation6]. However, we could not evaluate the energy resolution for peaks in the energy spectra of L X-rays emitted by 238Pu and 239Pu sources because of insufficient statistics. In this work, L X-ray photons emitted by 239Pu, 238Pu and 241Am sources were measured using a TES microcalorimeter with the energy resolution superior to that in previous work for the purpose of separation of plutonium isotopes and 241Am by L X-ray spectroscopy. A liquid-helium-free 3He–4He dilution refrigerator was used to maintain the operating temperature of the TES microcalorimeter over uninterrupted extended period [Citation7].
2. TES microcalorimeter
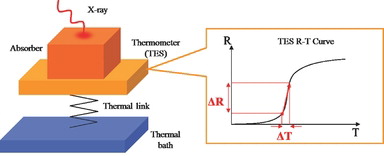
A microcalorimeter is a detector that measures the energy of an incident X-ray photon by the temperature rise of the device, which operates at very low temperature. illustrates the principles of a TES microcalorimeter, which consists of an energy absorber, thermometer and thermal bath weakly linked to the thermometer. Within the TES microcalorimeter the energy of the incident X-ray photon is converted into a temperature rise in the absorber. The magnitude of the temperature rise is measured by the TES, and then the TES returns to a state where it can measure the incident X-ray energy by a heat flow through a thermal link. A sensitive thermometer is needed to achieve excellent energy resolution. The TES microcalorimeter uses the strong temperature dependence of the electric resistance of a superconducting thin film in the phase transition region to achieve precise measurement of the tem-perature rise.
Figure 2. Schematic diagram of a TES microcalorimeter.
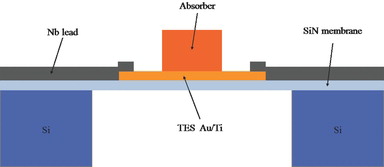
A photograph and cross-sectional view of the TES device are shown in and , respectively. A layer of the TES is deposited on the silicon nitride (SiN) membrane which operates as a weak thermal link and the Au absorber is deposited on the TES. The TES consists of a bilayer structure of thin films of Ti and Au. The phase transition temperature of the TES was designed to be 200 mK by making use of the proximity effect between Ti and Au. The thickness of the Ti and Au layers was 50 and 120 nm, respectively. A 5.0 μm thick Au layer is used as an absorber to detect L X-ray photons with an energy of 20 keV with an absorption efficiency of 50%. The dimensions of the thermometer and absorber are 350×350 and 150 ×150 μm2, respectively. The TES chip was provided by Hitachi High-Tech Science Corporation, Tokyo, Japan.
Figure 3. Photograph of a TES microcalorimeter device.
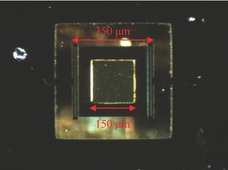
Figure 4. Cross-sectional view of a TES microcalorimeter.
3. Detection of L X-rays emitted by TRU elements
Because the handling of plutonium isotopes is strictly controlled under various safety regulations, it is difficult to use plutonium isotopes with strong radioactivity in experiments. In this work, checking sources of plutonium isotopes and 241Am for lung counter were used [Citation8]. The plutonium isotope radiation sources are cylindrical lymph node blocks containing 238Pu or 239Pu [Citation9]. The activities and dimensions of the radiation sources are summarized in . The 241Am sealed source with an activity of 370 kBq is covered with plate-like acrylic with dimensions of 24.4×11.1×2.08 mm3. First, U L X-ray measurement using 238-1, 2 and 3 sources, U L X-ray measurement using 239-1, 2 and 3 sources and Np L X-ray measurement using an 241Am source were conducted respectively. Then a mixed L X-ray measurement was performed using 241Am, 238-1 and 239-1 sources. In the mixed L X-ray measurement, the three radiation sources were taped together. The measurement times and count rates were 50 hours and 1.5 counts per minute (cpm) for the 241Am source, 70 hours and 0.4 cpm for the 238Pu source, 190 hours and 0.3 cpm for the 239Pu source and 70 hours and 2.4 cpm for the mixed L X-ray measurement. The TES microcalorimeter was placed inside of a liquid-helium-free 3He–4He dilution refrigerator and detected L X-rays pass through a 1 mm beryllium window and four thin aluminum films of thermal radiation shields. The count rates were low because the radiation sources were weak and placed outside of the refrigerator.
Table 1. Activities and dimensions of plutonium isotope radiation sources. The sources are cylindrical lymph node blocks.
Detection signal pulses were observed while holding the temperature of the cold stage at 160 mK and keeping the electric resistance of the TES at 40% of its normal resistance. For detector response analysis detection signal pulses were digitized and recorded to make averaged detection signal pulses in a personal computer. shows an example of averaged detection signal pulses of U Lβ1 X-ray photons emitted by the 239Pu source. The rise and decay time constants of the pulse are 8.6 and 338 μs, respectively. The pulse height distribution of detection signals was obtained using the optimal filter method [Citation10]. shows the obtained energy spectrum of U L X-rays emitted by the 239Pu source. U L X-ray peaks in the energy spectrum in are expanded in to highlight the corresponding energy regions. Values of full width at half-maximum energy resolution were estimated by fitting individual L X-ray peaks in the experimental energy spectra with the Voigt function, which is the convolution of a Gaussian with the natural profile of the L X-ray lines, as shown in . and show the obtained energy spectra of U L X-rays emitted by the 238Pu source and Np L X-rays emitted by the 241Am source. shows the energy spectrum of U and Np L X-rays obtained by mixed L X-ray measurement by placing the 238Pu, 239Pu and 241Am sources together. The values of peak energy, energy resolution and natural line widths for the samples are summarized in . In the mixed L X-ray spectrum, major peaks with high intensities can be distinguished, while minor peaks overlap. The degradation of energy resolution and decrease of peak event were observed in the Lα region in the mixed L X-ray measurement. The following are regarded as possible causes of these phenomena. Since the plutonium isotope sources were placed in front of Am source, another characteristic X-rays generated by Am γ-rays overlapped with Lα and/or Np L X-rays were absorbed in the lymph node blocks. We cannot estimate the peak intensity by analyzing the obtained U L X-ray energy spectra shown in – and because of a lack of information on the specifications of the lymph node blocks concerning the composition of the tissue-equivalent material. It is necessary to measure the spectra of L X-rays emitted by a thin unsealed plutonium isotope source for precise analysis of the L X-ray energy spectrum of U.
Figure 5. Averaged pulse of the U Lβ1 detection signals. Rise and decay time constants of the pulse are 8.6 and 338 μs, respectively.

Figure 6. Measured U L X-ray energy spectrum emitted by the 239Pu source. The whole energy range of U L X-rays is shown. Each peak is labeled.
Figure 7. Expanded view of each region of the U L X-ray energy spectrum emitted by the 239Pu source in . The circles are experimental results. The solid lines show calculated best fits. The dotted lines show the intrinsic line shapes of L X-rays [Citation12,Citation13]. Energy resolutions were estimated with respect to each region of Lα (12.8–14 keV), Lβ (16–17.8 keV) and Lγ (19.5–21.5 keV).
![Figure 7. Expanded view of each region of the U L X-ray energy spectrum emitted by the 239Pu source in Figure 6. The circles are experimental results. The solid lines show calculated best fits. The dotted lines show the intrinsic line shapes of L X-rays [Citation12,Citation13]. Energy resolutions were estimated with respect to each region of Lα (12.8–14 keV), Lβ (16–17.8 keV) and Lγ (19.5–21.5 keV).](/cms/asset/6a7dcb4b-4b39-4aa6-9787-df321364834a/tnst_a_957744_f0007_b.gif)
Figure 8. Measured U L X-ray energy spectrum emitted by the 238Pu source. Each peak is labeled. The energy resolution of each region is listed.
Figure 9. Measured Np L X-ray energy spectrum emitted by the 241Am source. Each peak is labeled. The energy resolution of each region is listed.
Figure 10. L X-ray energy spectrum measured for L X-rays emitted by Am and Pu radiation sources. Each peak is labeled. The energy resolution of each region is listed.
Table 2. The energy resolution of each spectrum obtained in the experiment. Peak energies and natural widths are cited from the literature [Citation11] and [Citation12,Citation13], respectively.
4. Conclusion
The L X-rays emitted by TRU elements were measured using a TES microcalorimeter over a long time period for application as a nondestructive TRU monitor. The TES was cooled by a liquid-helium-free dilution refrigerator. Major L X-ray peaks with high intensities were distinguished in the obtained energy spectra. The experimental results demonstrated the separation of 241Am and plutonium isotopes by L X-ray spectroscopy using a TES microcalorimeter.
Acknowledgements
The authors thank T. Hasuo for technical support.
Additional information
Funding
References
- Benedict M, Pigford TH, Levi HW. Nuclear chemical engineering. New York (NY): McGraw-Hill; 1981.
- Lépy MC, Plagnard J, Ferreux L. Measurement of 241Am L X-ray emission probabilities. Appl Radiat Isotopes. 2008;66:715–721.
- Lépy MC, Dvchemin B, Morel J. Comparison of experimental and theoretical L X-ray emission probabilities of 241Am, 239Pu and 240Pu. Nucl Instruments Methods A. 1994;353:10–15.
- Bandler SR, Adams JS, Bailey CN, Busch SE, Chervenak JA, Eckart ME, Ewin AE, Finkbeiner FM, Kelley RL, Kelly DP, Kilbourne CA, Porst JP, Porter FS, Sadleir JE, Smith SJ, Wassell EJ. Advances in small pixel TES-based X-ray microcalorimeter arrays for solar physics and astrophysics. IEEE Trans Appl Superconductivity. 2013;23:2100705–2100709.
- Hoover AS, Hoteling N, Rabin MW, Ullom JN, Bennett DA, Karpius PJ, Vo DT, Doriese WB, Hilton GC, Horansky RD, Irwin KD, Kotsubo V, Lee DW, Vale LR. Large microcalorimeter arrays for high-resolution X- and gamma-ray spectroscopy. Nucl Instruments Methods A. 2011;652:302–305.
- Maehata K, Nakamura K, Yasumune T, Ishibashi K, Takasaki K, Tanaka K, Odawara A, Nagata A. Development of a TES microcalorimeter for spectroscopic measurement of L X-rays emitted by transuranium elements. J Nucl Sci Technol. 2010;47(3):308–313.
- Yamanaka Y, Ito T, Umeno T, Suzuki Y, Yoshida S, Kamioka Y, Maehata K. J Phys. 2009;150:012055.
- Kramer GH, Burns LC, Yiu S. Lung counting: evaluation of uncertainties in lung burden estimation arising from a heterogeneous lung deposition using Monte Carlo code simulations. Radiat Prot Dosimetry. 1997;74:173–182.
- Kramer GH, Hauck BM. Comparison of the 1st, 2nd and 3rd generation Lawrence Livermore National Laboratory Torso phantoms. Radiat Prot Dosimetry. 2002;102:323–332.
- Szymkowiak AE, Kelley RL, Moseley SH, Stahlet CK. Signal processing for microcalorimeters. J Low Temperature Phys. 1993;93:281–285.
- Exploring the table of isotopes [Internet]. Berkeley (CA): The Berkeley Laboratory Isotopes Project [cited 2014 Apr 22]. Available from: http://ie.lbl.gov/education/ isotopes.htm
- Campbell JL, Papp T. Widths of the atomic K-N7 levels. At Data Nucl Data Table. 2001;77:1–56.
- Perkins ST, Cullen DE, Chen MH, Hubbell JH, Rathkopf J, Scofield J. Tables and graphs of atomic subshell and relaxation data derived from the LLNL Evaluated Atomic Data Library (EADL), Z = 1-100. Livermore (CA): Lawrence Livermore National Laboratory; 1991. (UCRL-50400 Vol. 30).