
 ?Mathematical formulae have been encoded as MathML and are displayed in this HTML version using MathJax in order to improve their display. Uncheck the box to turn MathJax off. This feature requires Javascript. Click on a formula to zoom.
Abstract
The quantification of information in the interface design is a critical issue. Too much information on an interface can confuse a user while executing a task, and too little information may result in poor user performance. This study focused on the quantification of visible information on computer-based procedures (CBPs). Levels of information quantity and task complexity were considered in this experiment. Simulated CBPs were developed to consist of three levels: high (at least 10 events, i.e. 3.32 bits), medium (4–8 events, i.e. 2–3 bits), and low information quantity (1 or 2 events, i.e. 0 or 1 bits). Task complexity comprised two levels: complex tasks and simple tasks. The dependent variables include operation time, secondary task performance, and mental workload. Results suggested that medium information quantity of five to eight events has a remarkable advantage in supporting operator performance under both simple and complex tasks. This research not only suggested the appropriate range of information quantity on the CBP interface, but also complemented certain deficient results of previous CBP interface design studies. Additionally, based on results obtained by this study, the quantification of information on the CBP interface should be considered to ensure safe operation of nuclear power plants.
1. Introduction
The main control room (MCR) of a nuclear power plant (NPP) presents an extremely complex control system. Operators in the MCR are required not only to monitor the system states using mimic and visual display units but also to execute routine tasks such as reactor startups and shutdowns. In addition, operators must handle emergency tasks when the NPP is under an emergent situation. In order to execute such tasks effectively and efficiently and to maintain a safe environment, specific NPP procedures have been developed to guide operator action when performing a task (i.e. monitoring, decision-making, and controlling) to enhance the likelihood that the actions will safely achieve the task goal [Citation1,2].
Nuclear power plant procedures can be divided into three categories: paper-based procedures, electronic procedures, and computer-based procedures (CBPs). According to the results of previous studies, CBPs can generate a number of performance benefits such as performing tasks more quickly, reducing the overall workload, minimizing the cognitive workload, and reducing human error when transitioning through or between different procedures [Citation3–6]. Therefore, along with the general advance of computer and information technologies in the MCR, CBPs have been implemented at a number of more advanced NPPs around the world. Fink et al. [Citation7] reviewed such applications of CBPs, including the COMPRO system in Switzerland and the Czech Republic, the N4 Computerized Procedure System in France, the plant safety monitoring and assessment system (PLASMA) in Hungary, and the on-line procedures system at the Lungmen NPP in Taiwan.
In the NPP, operators have to memorize and be familiar with more than 100 operation procedures. The detail steps of each procedure are various, which increase the difficulty of operation and might result in the miss operation of the forthcoming events. As CBPs have been widely used in advanced NPPs, the issues of interface design and human–computer interaction become increasingly important research topics. A well-designed human–computer interface can enhance human performance and decrease the probability of human error [Citation8–13]. Logically, a good human–computer interface design can assist operators to understand system states with higher accuracy and agility [Citation14,15]. Hence, several studies have been developed to evaluate different formats of the CBP interface with an aim to improve the performance of the operators. Wourms and Rankin [Citation16] found that usage of a flowchart was better than text in the procedure format because of its ability to explicitly relate procedural elements. Jung et al. [Citation17] investigated coherently coupled frames that reduced navigation time, using flowcharts and success trees where the tall processed information was shown on the interface. Xu et al. [Citation18] compared these two mainstream graphical computerized procedures and indicated that flowcharts were superior to success trees because they resulted in a lower error rate without extra task time or a higher workload. Carvalho et al. [Citation19] developed a new CBP interface and compared it with existing interfaces. Their results showed that the time spent by the operator to identify two accidents was faster with their new interface than the existent interface. Su et al. [Citation20] developed a cognitive style CBP interface and assessed the operators’ performance by the Myers–Briggs type indicator. Their results showed that the reaction times and number of mistake of operators were reduced when using the cognitive-style CBP interface.
However, only a few studies investigated the quantification of the information presented on the design of CBP interface. The quantification of information is a critical issue in human–computer interface. Kang and Seong [Citation21,22] attempted to evaluate the complexity of interface and alarm system and found that evaluating the quantification of information is an effective manner for quantitatively evaluating the human–machine interface. Operators who work in the MCR of an NPP are understandably influenced by the amount of information on the computer screen [Citation23,24]. Shneiderman et al. [Citation24] indicated that the quantification of the information is a major issue in interface design. Too much information on an interface can confuse a user while executing a task. On the other hand, too little information may result in poor user performance. However, only a few studies investigated the quantification of the information presented on the design of CBP interface [Citation21–23,Citation25].
A preliminary study [Citation25] has indicated that the medium information quantity with four events’ information can enhance the operators’ performance comparing to one event and eight events. Since the information quantity on CBP interface is usually in a various range rather than a fixed value, the present study further defined the quantification of information as three different ranges and investigated the appropriate range of information quantity on the CBP interface with more participants in the present experiment. In addition, the quantitation of information refers to the channel capacity of operator [Citation23]. Wickens and Hollands [Citation23] indicated that the maximum channel capacity of operator is between 2 and 3 bits (4–8 events), which implied the operation performance might decrease when the information quantity exceeded the maximum channel capacity. Since Hsieh and Hwang [Citation25] did not consider the influence between information quantity and channel capacity in their experiment, continuation of Hsieh and Hwang's [Citation25] research was necessary. The first objective of the present study was to further examine operator performance while using computerized procedures from the perception of the different quantification of information. In addition, an appropriate range of information quantity on the CBP interface in accordance with the equation of information quantity, channel capacity of operators, and the elements of previous CBP interface design research was investigated. This study aimed to complete previous CBPs interface design studies by reducing the mental workload of the operators in the MCR and executing required tasks effectively, efficiently, and safely.
2. Methodology
Information quantity issues related to the CBP interface were investigated in an experiment conducted with subject participation. Details about the independent and dependent variables as well as the experiment process are introduced in this section.
2.1. Independent variables
Two independent factors were considered in this experiment: levels of information quantity and task complexity. The information quantity consisted of three levels: high, medium, and low information quantity. Task complexity comprised two levels: complex tasks and simple tasks.
2.1.1. The quantification of information
Wickens and Hollands [Citation23] indicated that the number of possible events occurring on the interface could influence the quantification of the information. Using the information conveyed by an event Hs, in bits, and N as the number of alternatives, the amount of information, bits, is simply equal to the base 2 logarithm of the number of alternatives, which can be expressed by the formula as follows [Citation26]:
(1)
(1) For example, if there were four events, the information conveyed by the formula would be log24 = 2 bits. Hence, based on the formula, this study divided the quantification of the information into high, medium, and low levels. High level refers that the quantification of the information is more than the maximum channel capacity (at least 10 events’ information, log210 = 3.32 bits). Medium level means the quantification of the information is equal to the maximum channel capacity (four to eight events’ information, log24 = 2 bits, log28 = 3 bits). Low level implies the quantification of the information is less than the maximum channel capacity (one or two events’ information, log21 = 0 bits, log22 = 1bits). The layout of the three information quantities is shown in , and the CBP interface information quantities are shown in .
Table 1. Different information quantity of CBP interfaces.
Figure 1. The layout of presentation style used in this experiment. (A) High information quantity; (B) low information quantity; and (C) medium information quantity.
Xu et al. [Citation18] indicated that a flowchart procedure generated better performance than other methods. Hence, this study deferred to their experimental results regarding the format of the CBP interface. The interface in this experiment included one-dimensional and two-dimensional flowcharts and a display of the current (NPP) system states. As shown in , one-dimensional flowcharts located on the left side of the computer screen displayed main steps of the procedure while highlighting the current step. The two-dimensional flowcharts in the center of the screen displayed the detailed sub-steps structure of the current (highlighted) step. Current system states (or events) were located on the right side of the display using slightly different levels of information quantity.
With regard to low information quantity interface, the participants should follow the procedure and select the item from sub-steps, and the system will produce one or two current system states depending on the flowchart of the detailed sub-steps by one click of the participant. For medium information quantity interface, the participants should follow the procedure and select the item from sub-steps, and the system will produce four to eight current system states at the same time based on the flowchart of the detailed sub-steps by one click of the participant. In terms of high information quantity interface, the participants do not have to select the item of sub-steps, because all detailed sub-steps will be displayed on the right side of the display. The participant only needs to follow the main steps and make sure the current system states in normal.
2.1.2. Task complexity
With regard to task complexity, there were two levels of task complexity in this experiment. The procedure with high complexity had nearly twofold amount of steps and parameters than the one with low complexity. The complex task had nine main steps with approximate 100 parameters, and the simple task had five main steps with approximate 50 parameters. In addition to difference of the step/parameter numbers between complex and simple task, the amount of determination requirements in complex and simple task is also different. In complex task, it has 27 requirements of determination that need participant to determine the trend of the procedure. In simple task, it has 13 requirements of determination that need participant to determine the trend of the procedure. The difference between complex and simple task is shown in .
Table 2. The difference between complex and simple task.
2.2. Dependent variable
Both objective and subjective indexes were used to evaluate operation performance. The objective indexes included operation time (the time that the participants complete the task successfully) and secondary task performance. The operation time in this experiment was defined as the required time that the participants completed the task successfully in each experimental condition.
To impose a secondary task as a measure of residual resource or capacity is a technique in the field of workload research [Citation23]. Secondary task performance is assumed to be inversely proportional to the demand of attention resource of primary task. It can reflect the differences in primary task resource demand of participant, which means that more demand of attention resource of secondary task could result in the worse performance of operators. Thus, in order to reflect the demand of attention resource and mental workload in the MCR, a secondary task was applied in this experiment. Secondary task in this experiment involved identification mission and employed two types of signals, which were single dot and double dots. The signal appeared 10 times randomly on the wall in front of the participant, and if the participants detected and responded to a signal over 15 s, it was recorded as 15 s. When a single dot appeared on the wall, the participant should report it as “single”. When the double dots appeared, the participant was asked to report them as “noise”. The response time of the participants were recorded as secondary task performance measure.
With regard to the workload, the quantitation of information on the control interface might influence the mental workload of operators during tasks [Citation23,24]. Therefore, this experiment also investigated the relationship between mental workload and performance under different quantitation of information on CBP interface. The National Aeronautics and Space Administration task load index (NASA-TLX) was widely applied in cognitive experiment [Citation27,28]. NASA-TLX is a subjective assessment tool that contains six different dimensions: mental demand, physical demand, temporal demand, performance, effort, and frustration. Hence, this research utilized NASA-TLX to measure the subjective workload in the experiment. The questionnaire is divided into two sections. Section one is to compare all of the importance of six different dimensions in the pair-wise fashion, and the results can be a weight of each dimension. Section two is to evaluate each of the importance of these six different dimensions (0: not important and 100: very important). The formula of the NASA-TLX is as follows:
(2)
(2)
2.3. Experimental design and procedure
Thirty-six college students were recruited as participants in this experiment. The age range of the participants was from 22 to 29 years, with an average age of 26.3 years. All participants had a nuclear engineering education background and all were trained prior to the formal experiment. A between- and within-participants’ mixed-experiment design was adopted wherein a participant would perform in the experimental condition of one quantification of information and both task complexity levels, which means each participant was asked to perform two experimental conditions. The participants were randomly assigned to one of the three levels of information quantity. Half of the participants in each information quantity level started the formal experiment at the complex task level, while the other half started at the simple task level and vice versa.
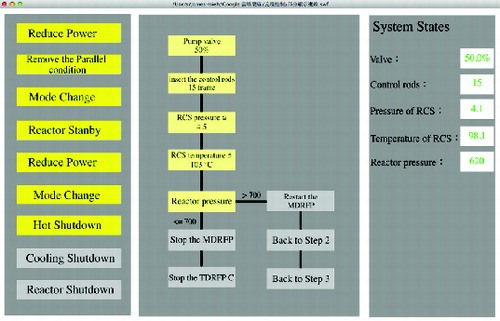
The CBP interface (as shown in ) was simulated using a computer program developed by Adobe FLASH CS6®. A touch screen was used as an input device, so the participants could control the simulated CBP intuitively. Due to the limitations of equipment and participant, a simplified reactor shutdown task was utilized in this experiment. Participants were asked to perform the reactor shutdown task and were told to complete the task as soon as possible while avoiding mistakes during the experiment. During the reactor shutdown task, participant checked the reactor shutdown procedures, and followed instructions step-by-step to control and identify the system states such as power rate and flow rate, and required to detect a random signal 10 times as a secondary task simultaneously.
Figure 2. Interface of the experiment platform (information quantity: medium; task: complex).
Before the formal experiment, the participants listened to an explanation of the experimental procedures given by the researcher and then practiced the simulated CBP interface. In order to minimize the influence of learning effect of participants, the participants practiced the reactor shutdown task at least twice without secondary task before the formal experiment. During the formal experiment, the operation time that the participants completed the reactor shutdown task and the secondary performance was recorded. After the participants finished their initial experiment session, they took the first NASA-TLX questionnaire. Then, participants continued to complete the remaining experiment sessions and take the second NASA-TLX questionnaire, which completed the experiment.
3. Experimental results and discussion
Multivariate analysis of variance (MANOVA) was computed for the operation time, secondary task performance, and workload. After MANOVA, the post hoc test was applied to further analyze the difference between the levels of independent variable in this experiment. The data distribution of the experiment was close to normal distribution after normality test, and corresponded to the three basic assumptions of the MANOVA. The significance level was set at 0.05 for all analyses. In this experiment, all statistical analyses were carried out with MINITAB 16®.
The results of MANOVA indicated that the levels of information quantity (Wilks’ λ = 0.299, P < 0.001) and task complexity (Wilks’ λ = 0.384, P < 0.001) had significant effects on the dependent measures, as shown in . There was no significant interaction between the levels of information quantity and task complexity on operation time, secondary task performance, or workload (Wilks’ λ = 0.902, P > 0.05).
Table 3. The MANOVA results of this experiment.
According to the results of post hoc test (), there were significant differences between high and low information quantity (P < 0.001), and low and medium information quantity (P < 0.001) on operation time. There were significant differences between high and medium information quantity (P < 0.001), and low and medium information quantity (P < 0.001) on mental workload. There were significant differences between high and low information quantity (P = 0.014), high and medium information quantity (P < 0.001), and low and medium information quantity (P = 0.018) on secondary task performance.
Table 4. The results of post hoc test for each dependent variable.
depicts the operation time under each information quantity. Comparing the data for each quantity level shows that the operation time required at both high and medium information quantities was faster than that for low information quantity. When the CBP interface presents a high information quantity, participants must pay more attention to the primary task, which means they may ignore the secondary task and increase their mental workload. Alternatively, low information quantity of CBP interface only presents one or two current system parameters on the screen, the participants must exert more steps to select sub-steps of the procedure that located in the center of the screen, afterward the hidden system states were displayed on the right side of the screen. Thus, more time is spent to complete the primary task.
Figure 3. The interval plot for operation time.
is an integrated result of this experiment, which showed the relationship between levels of information quantity and performance in terms of secondary task performance and mental workload. Results indicate that the secondary task performance at the medium information quantity level was significantly better than high and low information quantity levels. Two reasons may explain this result. First, there were more than 10 events in the high level that distracted the participants. Therefore, participants in the high level had to draw more attention to the primary task and less attention to the secondary task due to less residual mental capacity. As a result, the participants took more response time to the signal in the secondary task. Second, there were only one or two events in the low information quantity. In order to release the following system information from sub-steps that are located in the center of the screen, the participants have to pay more attention in selecting items of sub-step and less attention to the secondary task. The phenomenon of attention resource allocation was related to the operators’ mental workload in accordance with the results of this experiment. In addition, comparing the data among these three levels demonstrated that the workload in the medium quantity was lower than that at both the high and low quantities. Due to the results of attention resource allocation, participants can comprehend system states more efficiently and induce a lower mental workload. These results suggested that medium information quantity of CBP interface is superior to the other levels.
Figure 4. The integrated results of workload and secondary task performance.
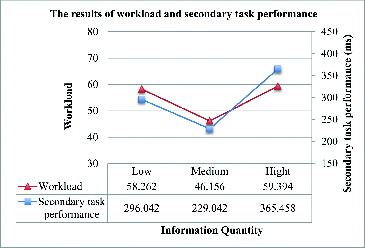
Another element worth noting is comparative results of operation time, mental workload, and secondary task performance. Although the high information quantity on a CBP interface produced a shorter operation time than the medium and low information quantities, the mental workload was higher and the secondary task performance was lower than the other two information quantity types. This implies that the primary task may have already occupied most of an operator's mental capacity in the high information quantity case and prevented the operator from paying more attention to the secondary task. On the other hand, participants confronted low information quantity had a higher mental workload, a longer operation time, and worse secondary task performance than those presented with the medium information quantity.
With regard to the individual dependent variables, task complexity significantly influenced the operation time (F = 104.87, P < 0.001) and workload (F = 15.32, P = 0.02). There was no significant difference of task complexity on secondary task performance. The influence of operation time on the complexity of these two tasks demonstrated that the operation time for the simple task was faster than complex task, which was consistent with Xu et al. [Citation18]. Workload difference on these two tasks indicated that the workload for the simple task was lower than the complex task. The results of mental workload and operation time supported that more complex tasks were responsible for higher mental workload and longer task time [Citation3,Citation23].
According to the results of this experiment, a medium information quantity level performed a better performance than high and low information quantity levels, which is consistent with the preliminary study [Citation25]. Although the definition of information quantity is different, the trend of operators’ performance in terms of secondary task and mental workload between preliminary study and present study is the same. More quantification of information that displayed on the CBP interface could occupy more attention resource of operators and might decrease operation performance [Citation23]. Based on , the trend of results of this experiment can be summarized into an inverted-U model as shown in . depicts the inverted-U relationship between performance and levels of information quantity, where the X-axis is the quantity scale of the levels of information quantity in this experiment. The Y-axis is the performance scale, relevant to the mental workload and secondary task performance in this experiment. The X-axis represents low to high information quantity from left to right. The left side of the graph presents an operator with a poor performance. The middle of the graph describes an operator is working at peak effectiveness, suggesting the operator achieved the maximal channel capacity in the medium information quantity situation. For NPP operators, the medium information quantity level provides the most appropriate workload and offers the most resources available for the secondary task. Hence, the experiment results show that the medium information quantity level outperformed the other two types in terms of mental workload and secondary task performance. The right-hand side of the graph () shows that an operator becomes less efficient under the stress of a high information quantity situation. In this experiment, the operators were overwhelmed by the event volume and the secondary task placed competing demands on their attention, and they started to exhibit panic. Stress began to produce the attention and memory difficulties that caused performance to decrease. These findings strongly suggest that the interface designer should consider the matter of information quantity when designing a control interface for use in the MCR of an NPP.
Figure 5. The inverted-U relationship between information quantity and performance.
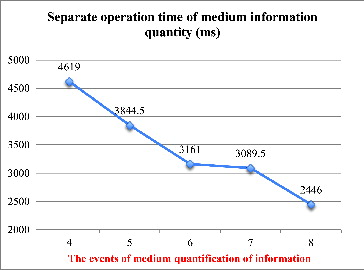
In general, the results indicated that the operation time increased as the number of events decreased, and the secondary task performance began to increase when four to eight events were used. However, in order to understand the appropriate quantification of information among four to eight events, the event categories were further analyzed. illustrates a run chart of the separate operation times (based on number of events) with medium information quantity. Notably, this study found a declining trend in the experimental data, which have not been discussed in previous literatures. A phenomenon clearly illustrates that having less information on the CBP interface might cause operators to spend more time on the task. Moreover, the operation time with four events was significantly higher than with eight events (T = 13.17, P < 0.05), but there was no significant difference between five, six, seven, and eight events on operation time, as shown in . Therefore, according to these findings, this study suggests that the most appropriate information quantity of events on a CBP interface is five to eight events, which is also the maximum channel capacity of operators when using the CBP in an NPP.
Table 5. T-test result of separate operation time.
Figure 6. The separate operation time of medium quantification of information.
4. Conclusion
The computer interface in the MCR of an advanced NPP is modernized, fully integrated digital designs, wherein CBPs have a range of capabilities that may support operators in controlling the plant operation [Citation3]. This study focused on the quantification of information issues of the CBP interface intended to enhance the performance of NPP control room operators. The experiment's methodology used both subjective and objective measurement analysis to evaluate participant performance. Results indicate that an appropriate quantity of information on CBP interface may increase an operators’ ability in terms of operation time, secondary task performance, and mental workload. This research is not only a pilot study of the CBP interface design for NPPs in Taiwan, but also complements certain deficient results of previous CBP interface design studies.
In addition, there were three limitations existing in this study. First, although the participants in this experiment have background of nuclear engineering education, they are still not licensed operators who have sufficient knowledge and experience in the field of NPP. Second, since the participants are not licensed operators who are the users of CBPs, the simulated CBPs need to be simplified to ensure the success of this experiment. Third, the experimental environment is not in the MCR of NPP, which could not completely represent the situation of the MCR. According to the study limitations, the finding of this experiment might not fully reflect the real situation of operators in the NPP. Therefore, further investigation is necessary based on the results of this study.
With regard to the future research, the results of this study must be further investigated with real control system and licensed operators in the NPPs of Taiwan so as to address the design of information displays for other computerized systems such as process control, petrochemical industry, and flight management.
Acknowledgements
This work was partially supported by the National Science Council, Taiwan, ROC, under project no. NSC 102 -2221-E-007-058-MY3 and no. NSC 101- 2221-E-007-013- MY2.
References
- O’Hara J, Brown WS, Lewis PM, Persensky JJ. Human–system interface design review guidelines. Washington (DC): U.S. Nuclear Regulatory Commission; 2002. ( Tech. Rep. NUREG-0700 Rev. 2).
- Hong JH, Lee MS, Hwang DH. Computerized procedure system for the APR 1400 simulator. Nucl Eng Des. 2009;239(12):3092–3104.
- Yang CW, Yang LC, Cheng TC, Jou YT, Chiou SW. Assessing mental workload and situation awareness in the evaluation of computerized procedures in the main control room. Nucl Eng Des. 2012;250:713–719.
- O’Hara J, Higgins J, Stubler W, Kramer J. (2000). Computer-based procedure systems: technical basis and human factors review guidance. Washington (DC): U.S. Nuclear Regulatory Commission; 2000. (NUREG/CR-6634).
- Roth E, O’Hara J. Integrating digital and conventional human system interface technology: lessons learned from a control room modernization program. Washington (DC): U.S. Nuclear Regulatory Commission; 2002. (NUREG/CR-6749).
- O’Hara J, Pirus D, Nilsen S, Biso R, Hulsund JE, Zhang W. Computerization of procedures: lessons learned and future perspectives (HWR-355). Halden, Norway: Institutt for Energiteknikk, OECD Halden Reactor Project; 2003.
- Fink RT, Killian CD, Hanes LF, Naser JA. Guidelines for the design and implementation of computerized procedures. Nuclear News. 2009;52(3): 85–90.
- Han SH, Yang H, Im DG. Designing a human–computer interface for a process control room: a case study of a steel manufacturing company. Int J Ind Ergon. 2007;37(5):383–393.
- Drivalou S, Marmaras N. Supporting skill-, rule-, and knowledge-based behavior through an ecological interface: an industry-scale application. Int J Ind Ergon. 2009;39(6):947–965.
- Hwang SL, Liang SF, Yeh Liu TY, Yang YJ, Chen PY, Chuang CF. Evaluation of human factors in interface design in main control room. Nucl Eng Des. 2009;239(12):3069–3075.
- Lin CH, Hwang SL, Wang EMY. Design for usability on supply chain management system implementation. Hum Factors Ergon Manuf. 2009;19(5):378–403.
- Ponsa P, Vilanova R, Amante B. Human intervention and interface design in automation system. Int J Comput Commun. 2011;6(1):166–174.
- Ujita H. Human error classification and analysis in nuclear power plant. J Nucl Sci Technol. 1985;22(6):496–498.
- Kitamura M, Fujita Y, Yoshikawa H. Review of international standards related to the design for control rooms on nuclear power plant. J Nucl Sci Technol. 2005;42(4):406–417.
- Hsieh MC, Chiu MC, Hwang SL. An interface redesign for the feed-water system of the advanced boiling water reactor in a nuclear power plant in Taiwan. J Nucl Sci Technol. 2014;51(5):720–729.
- Wourms D, Rankin W. Computer-based procedures. OH: Armstrong Aerospace Medical Research Laboratory, Crew System Ergonomic Information Analysis Center (CSERIAC); 1994. (CSERIAC-RA-94-002).
- Jung Y, Seong PH, Kim MC. A model for computerized procedures based on flowcharts and success logic trees. Reliab Eng Syst Saf. 2004;26(3):351–362.
- Xu S, Song F, Li Z, Zhao Q, Luo W, He X, Salvendy G. An ergonomics study of computerized emergency operating procedures: presentation style, task complexity, and training level. Reliab Eng Syst Saf. 2008;93(10):1500–1511.
- Carvalho PVR, dos Santos IL, Gomes JO, Borges MRS, Guerlain S. Human factors approach for evaluation and redesign of human–system interfaces of a nuclear power plant simulator. Display. 2008;29(3):273–284.
- Su KW, Chen CJ, Shue LY. Implication of cognitive style in designing computer-based procedure interface. Hum Factors Ergon Manuf. 2013;23(3):230–242.
- Kang HG, Seong PH. An information theory-based approach for quantitative evaluation of user interface complexity. IEEE Trans Nucl Sci. 1998;45(6):3165–3174.
- Kang HG, Seong PH. Information theoretic approach to man–machine interface complexity evaluation. IEEE Trans Syst Man Cybern A Syst Hum. 2001;31(3):163–171.
- Wickens CD, Hollands JG. Engineering psychology and human performance. NJ: Prentice-Hall Inc.; 2002.
- Shneiderman B, Plaisant C. Designing the user interface: strategies for effective human–computer interaction. NJ: Prentice-Hall Inc.; 2004.
- Hsieh MC, Hwang SL. The effect of information quantity on CBP interface in the advanced nuclear power plant. In: Kurosu M, editor. Users and Contexts of Use. Proceedings of the 15th International Conference on Human Computer Interaction; 2013 Jul 21–26; Las Vegas (NV): Mirage Hotel; 2013.
- Shannon CE, Weaver W. The mathematical theory of communications. ACM SIGMOBILE Mob Com Commun Rev. 2001;5(1):3–55.
- Hart SG, Staveland LE. Development of NASA-TLX (task load index): results of empirical and theoretical research. Adv Psychol. 1988;52:139–183.
- Kaber DB, Onal E, Endsley MR. Design of automation for telerobots and the effect on performance, operator situation awareness, and subject workload. Hum Factors Ergon Manuf. 2000;10(4):409–430.