
 ?Mathematical formulae have been encoded as MathML and are displayed in this HTML version using MathJax in order to improve their display. Uncheck the box to turn MathJax off. This feature requires Javascript. Click on a formula to zoom.
ABSTRACT
To improve the uranium recovery rate in pyroprocessing, it is crucial to develop a planar-type electrorefiner. This can be achieved prior to actual experiments by using computer simulations to analyze the shape, arrangement, and size of the cathode. In this paper, tertiary-model-based computational analysis was performed on a planar-type electrorefiner. Flat-plate and rod-type cathodes were analyzed under constant-current condition; calculations were performed on high-efficiency-type electrodes with convection effects under the same conditions by comparing the dependence of the generated overpotential on the applied current. Analytic and experimental results were analyzed by comparing the electric potential of the plate-type device with that of a uranium electrorefiner while varying the arrangement of the electrodes.
1. Introduction
Pyroprocessing using molten salt for fuel cycle technology is attracting attention owing to its applicability in fast reactor systems and its resistance to nuclear proliferation compared with those characteristics of conventional wet reprocessing technology. However, implementing pyroprocessing is difficult, because it involves a high-temperature process in a high-radiation environment. The Korea Atomic Energy Research Institute has been pursuing the development of pyroprocessing for the treatment of light-water reactor spent nuclear fuel, to recycle that fuel into sodium-cooled fast reactor fuel [Citation1–3]. Pyroprocessing comprises multiple stages, and the electrorefining is one of the most important steps because the quality of the recovered material is determined during this process; treating a large amount of uranium is thought to cause a bottleneck in pyroprocessing [Citation4–5]. Therefore, in order to increase the efficiency of pyroprocessing, the throughput of the electrorefiner must be increased. In the United States, the planar electrode electrorefiner (PEER) was recently reported through Mark-V, and research on it is in progress [Citation6–7]. The development of a compact electrorefiner with high throughput is desired by all of the countries in this field, including Japan [Citation8,Citation9] and Korea [Citation10–12]. The increase in electrorefiner throughput is based on the electrochemical equivalent, in which the applied current is proportional to the amount of metal deposit to recover. However, anode and cathode potentials should be maintained within the cutoff potential to suppress the deposition of unfavorable elements [Citation13]. Hence, an increase in the electrode area is the most straightforward method in that regard, but the scale itself directly causes a cost increase in hot cell operation. Use of a PEER is an effective way to increase the electrode area, and this method has been applied in the Cu electrorefining industry [Citation14]. The PEER for collecting uranium and the existing high purity that can be obtained using a Cu-collecting electrorefiner have in common the use of a flat-plate cathode. However, in case of Cu, the electrorefiner has a flat-plate cathode shape and can be easily scrapped owing to the nature of the material. On the other hand, it is difficult to collect uranium electrodeposits owing to the strong adhesion force of uranium to the cathode; thus, a simple flat-plate cathode arrangement cannot be adopted [Citation15]. Therefore, considerable effort has been directed toward developing a good cathode material and an effective electrode arrangement [Citation16,Citation17]; however, the uranium electrodepositing behavior with respect to the cathode shape (i.e. flat plate or rod-type) must be analyzed in order to increase the throughput and efficiency of the scrapping process. Furthermore, in the computation model of the high-temperature-melting electrolytic dissociation process, numerous chemical elements cause electrochemical reactions at high temperature, and the model must account for the electrodeposition of metal ions. Various efforts have been made to model electrorefiners to improve the cell configuration [Citation18,Citation19]. Until now, no reliable model has been developed, as it is a very difficult problem considering the complexity of the numerical analysis involved, especially for a three-dimensional (3D) system.
In this study, we attempted to predict the current density distribution and uranium deposition behavior in an electrorefining process using rod and flat-plate multi-configurational electrodes. Two 3D models with different electrode configurations were employed to interpret mass transfer during electrorefining for the improvement of electrorefiner performance; the calculation results were compared to actual experimental data corresponding to the surface ratio of the electrodes. The results of this study introduce a new direction for the development of technology and contribute basic data for scale-up, with computational analysis of the operational process of electrorefiners.
2. Theory of electrorefiner modeling
2.1. Fundamental theory
In the case of the formula Ox + ne− = Red for an electrochemical reaction, if the electric charge transfer process determines the overall speed, the speed of the forward reaction (vf) and the speed of the inverse reaction (vb), then i can be written as follows:
(1)
(1)
(2)
(2)
(3)
(3) where vf and vb are forward and backward reaction rates (mol cm−2 s−1]; k0 is the standard rate constant; kf and kb are rate constants for oxidation and reduction, respectively (cm s−1); COx (0, t) and CRed (0, t) represent the concentrations of oxidation and reduction (mol cm−3); ia and ic are anodic and cathode component currents (A); n is the number of electrons; F is the Faraday constant (C); A is the area (cm2); i is the current (A); α is the transfer coefficient; E and E0 are potentials of an electrode versus a reference and standard potential of an electrode (V); R is the gas constant (J mol−1 K−1); and T is the absolute temperature (K). For the electrochemical reaction, the speeds of the forward and inverse reactions can be written as shown in EquationEquation (2)
(2)
(2) . Using EquationEquations (1)
(1)
(1) and (Equation2
(2)
(2) ), we can arrange the equations to represent reduction current and oxidation current as shown in EquationEquation (3)
(3)
(3) .
During the electrodeposition process in an electrochemical reaction, primary current density appears if the ion conduction determines the overall speed in the electrolyte; secondary current density appears if the electric charge transfer process determines the speed of the total reaction. Tertiary current density appears when matter transfer of metal ions determines the speed of the total reaction. Using the Butler–Volmer equation [Citation20–23], we interpreted the uranium electrodeposition behavior for both types of planar electrorefiner — rod cathode and flat-plate cathode — and analyzed the electrochemical efficiency and convection effectiveness; then, we conducted a verification experiment using an electrorefiner with uranium. For the computational analysis of an existing Lab scale electrorefiner, the COMSOL code was used; in particular, computational codes were verified using actual experimental results obtained in this study [Citation24].
2.2. Rod and flat-plate cathode geometry for planar electrorefiner
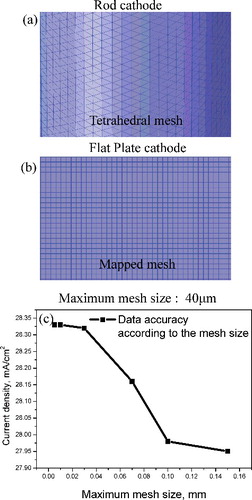
In order to calculate the current density, the electrodeposition behavior, and the process variables with respect to the cathode shape using the Butler–Volmer equation, we configured the size of the cathode surface to be 1256 cm2 and experimented with both flat-plate and rod cathode shapes, while keeping the shape and size of the anode constant, as shown in Figure 1(a) and 1(b). The calculated size of the electrorefiner bath was 220 mm × 120 mm × 200 mm, and electrolyte composition was LiCl--KCl (LiCl:KCl = 59.2:40.8 mol%). For the simulation of a multi-arrayed electrorefiner, the unit electrode pairs were arranged in rows comprising up to four cathodes and five anodes. To validate the simulation results, the experimental device for the electrorefiner using Cu was layered out as shown in (c), and the electrodeposition conditions were considered. The volume of the electrorefiner was 13.95 L; the diameter and depth of the vessel were 300 mm × 150 mm and 310 mm, respectively. The properties of the materials and the boundary conditions used in the experiment are shown in . In this calculation, the U dendrite density selected was 2000 kg m−3, and this value was assumed to be independent from the current density. The value of the parameters used in this calculation are as follows: anodic transfer coefficient, 0.5 [Citation21]; cathodic transfer coefficient, −0.5 [Citation21]; diffusion coefficient of U3+ in molten salt, 1.03e−9 m2 s−1 at 500 °C [Citation25]; electrical mobility, −4.64e−8 m2 (Vs)−1 (calculated value based on the Nernst--Einstein relation [Citation26]); and exchange current density, 60 mA cm−2 [Citation27,Citation28]. Also, in order to create an efficient grid from the cathode shape, a tetrahedral mesh was used for the rod cathode and mapped mesh was used for the flat-plate cathode, as shown in (a) and 2(b), respectively. To ensure credibility of the data and calculation efficiency based on the fact that the results change depending on the maximum mesh size, as shown in (c), the mesh size chosen should be appropriate, but also as small as possible. However, the calculations took too long with maximum mesh size at 30 μm; hence, in this study, to save time and to ensure reliability, the maximum mesh size selected was 40 µm. The total mesh numbers were 2.2 million and 2.1 million for the rod and flat-plate electrorefiner geometries, respectively.
Figure 1. (a) Schematic of rod-type ER geometry; (b) flat-plate-type ER geometry for numerical analysis; and (c) electrorefiner for validation.
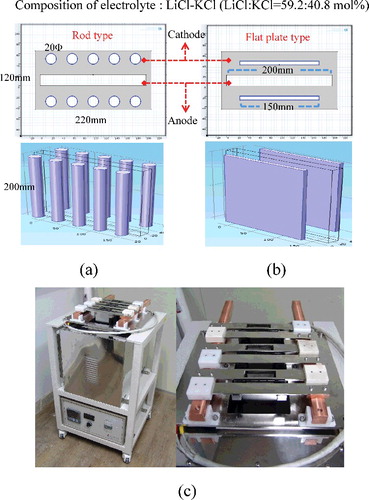
Table 1. Boundary condition and parameters.
Figure 2. (a) Grid of rod cathode using tetrahedral mesh; (b) grid of flat-plate cathode using mapped mesh; (c) changes in current density depending on changes in maximum mesh size.
3. Theory of electrorefiner modeling
3.1. Comparison of current density distribution between rod and flat-plate cathode
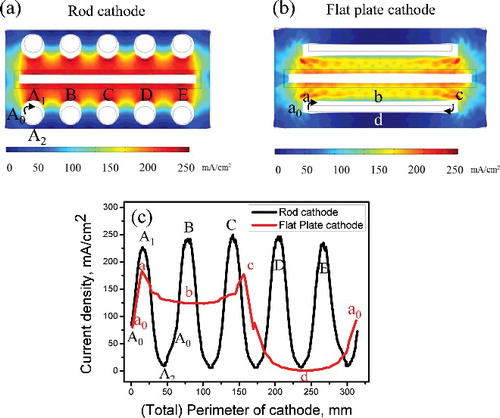
When 150 mA cm−2 of electric current was applied, the current density on the rod cathode was concentrated at the part where the cathode and anode face each other, as shown in (a), whereas the current density on the flat-plate cathode was concentrated at both ends of the cathode owing to the edge effect, as shown in (b). Black lines indicate the initial electrode surface's boundary; the crescent and blank boxes surrounding the electrode represent the shape of the deposition. In both cases, the opposite sides of the cathodes, up to the anode plate, did not undergo deposition. This is not favorable if uniform electrodeposition of uranium on the cathode is important for scrapping of the deposit. In order to compare the current density distribution induced for the different cathode shapes, the current densities were drawn along the rims of the cathode, as shown in (c). The data collection for the rod cathode starts from A0 and finishes A0 via A1 and A2 in cathode A, as shown in (a)). The same order was applied for cathodes B, C, D, and E in the same manner. The data collection for the flat-plate cathode starts from a0 to a0 via a, b, c, and d, as shown in (b). The corresponding locations are also indicated in (c). In the case of the rod cathode, the values formed the shape of a sine function, a typical feature of a circular cathode, and had maximum current density values at points A, B, C, D, and E, which are the closest points facing the anode. In the flat-plate cathode, because of the edge effect, the maximum current density was located at the edges (i.e. at points a and c) of the flat-plate cathode. Compared with the rod cathode, points b and d exhibited relatively stable current density values. Because the surface area was identical in both cases, the total allowable amount of current should also have been the same. However, the peak current density of the rod electrode was far greater than those of the flat-plate electrode. In this case, co-deposition of an impurity would be favorable in the rod electrode under the same applied current owing to the induction of higher reduction potential.
Figure 3. (a) Current density distribution on rod cathode and (b) flat-plate cathode. (c) Comparison of uniformity of current density distribution at locations on rod and flat-plate cathodes.
3.2. Comparison of anodic dissolution and cathodic deposition behavior of rod and flat-plate electrodes with respect to applied current
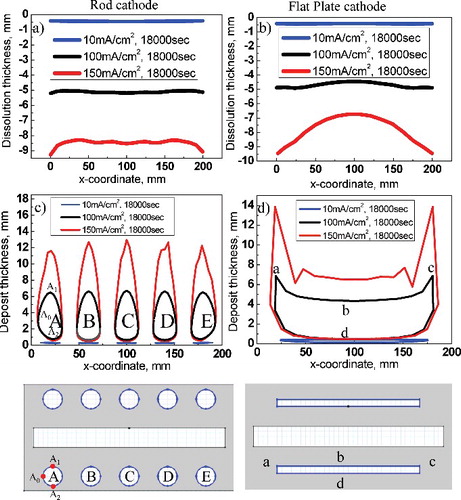
Anodic dissolution of uranium and cathodic electrodeposition with respect to the cathode's shape were compared, as shown in . Changing the shape of the cathode causes a change in the electric field, which changes the anode uranium's dissolution rate and aspect. (a) shows the results of anode uranium's dissolution aspect at 18,000 s for the rod cathode. These results indicate that when the applied current increased, the amount of dissolution increased, and that dissolution started unevenly from both ends of the anode. (b) shows that, for the flat-plate cathode, the amount of dissolution at the anode increased as the applied current increased, which is similar to the case of the rod cathode; the difference in uniformity between the anode's edges and center was larger than that in the rod cathode because electric current induced at the anode to the rod cathodes is relatively uniformly distributed along the rim of the anode. However, there are two edges on the anode facing the flat-plate cathode, these edges induce high current density, as shown in (b) and 3(c). (c) shows the aspect of uranium electrodeposition in the rod cathode, indicating that for greater applied current density, the electrodeposit layer was thicker. The electrodeposition grows toward the normal direction of the anode where the physical path is short, rather than toward the backside of the cathode, where the electric field is relatively weak. That is, under the condition of 100 mA cm−2, there are three points (A0, A1, and A2), and each point indicates the deposition thickness. Here, A1 has higher value than A0 and A2 because the point of A1 has a shorter physical path than A0 and A2. (d) shows the aspect of uranium electrodeposition in the flat-plate cathode, indicating that a thick uranium electrodeposit grows slowly at both ends of the cathode owing to the edge effect (points a and c) and that an even layer of electrodeposit grows at parts (point b) with even current density, as shown in (b). In contrast, deposition of uranium hardly ever occurs on the back side (point d) under all current density conditions. There are deposit-free layers on the side of the cathode facing away from the anode; this situation agrees with the calculation data for the current density, shown in
Figure 4. (a) Graph of anode dissolution on rod cathode and (b) flat-plate cathode. (c) Graph of cathode electrodeposition on rod cathode (d) flat-plate cathode.
3.3. Efficiency comparison between rod and flat-plate electrodes
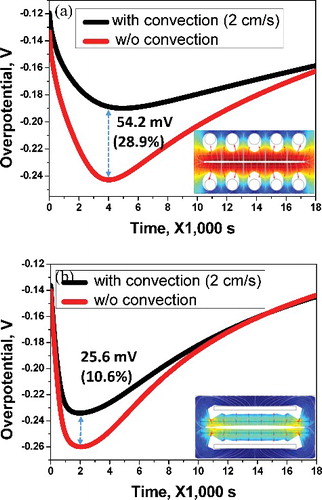
(a) shows the current densities induced at the center of the cathodes: No. 1 and No. 3 correspond to rod and flat-plate cathodes, respectively. There is negligible difference between the flat-plate and rod cathodes under 40 mA cm−2 of current density, but when the electric current is greater than 60 mA cm−2, differences arise: the potential of the flat-plate cathode increases by 3.3 mV at 100 mA cm−2 and by 2.7 mV at 150 mA cm−2. In order to interpret the potential difference between flat-plate and rod cathodes, overpotentials of the electrode system were compared. (b) shows the overpotential change with respect to time passed until 18,000 s at the No. 1 and No. 3 points of the rod and flat-plate cathodes, where the overpotential is defined as the difference between the reversible electromotive force of the cell (theoretical deposition potential) and the effective deposition potential. During the initial 2000 s, the overpotential of the flat-plate cathode was high; however, after 4400 s, the overpotential was relatively low compared with that of the rod cathode. This can be explained by the uranium ion concentration on the surface of the cathode. That is, the ion concentration of the cathode was rapidly depleted as the current flowed over the deposition potential. As the electrodeposition proceeded, the ion concentration gradually increased on the cathode because of the diffusion of metal ions that were dissolved from the anode side. (c) shows the ion concentration with respect to the time spent at each location of the rod and flat-plate cathodes. Regarding locations No. 1 and No. 2 of the rod cathode, the uranium ions were preferentially supplied to location No. 1, which was relatively closer to the anode, but uranium ions with relatively low density were supplied to location No. 2. These results define the shape of the uranium electrodeposits. Comparing locations No. 1 and No. 3, which were the same locations in the rod and flat-plate cathodes, the uranium ion concentration for the rod cathode remained high as time passed. This is because the higher current density was applied to location No. 1 on the rod cathode than to location ‘3’ on the flat-plate cathode, as shown in (a). The overpotential on the flat-plate cathode increased during the initial 2000 s owing to the insufficient uranium ion supply, but it stabilized afterwards and then decreased. The calculations performed up to now have been based only on diffusion, which is known as the most dominant factor in the electrodeposition process. However, in order to evaluate the efficiency of electrorefining for the two different cathode geometries, the difference in the overvoltage with respect to the convection influence was examined. It was assumed that the electrolyte for different geometries was agitated with the same velocity, so 2 cm −s of velocity component was applied in the diagonal direction, from bottom left corner to upper right corner. In the case of the rod cathode, this value was −0.24 V at 4000 s without the influence of convection and −0.19 V with the influence of convection, resulting in a 54.2 mV (28.9%) decrease in overvoltage, as shown in (a). As can be seen in (b), there was also an increase of 25.6 mV (10.6%) in overvoltage, from −0.26 V before the influence of convection to −0.23 V. When the convection term is added to the calculation, this represents the diffusional metal ion flux being added to the convectional ion flux, generally leading to a decrease in the overvoltage. Hence, the overvoltage is thought to decrease because, in the case of the rod cathode, of the distance between the cathode rods, the amount of movement and the diffusion of ions needed to cause electrodeposition increases. However, the flat-plate cathode completely blocks convection of metal ions from the anode to the cathode. Accordingly, it has been shown that the rod cathode is more efficient than the flat-plate cathode with regard to the convection effect.
Figure 5. (a) Potential–current curve for rod and flat-plate cathode at No. 1 and No. 3. (b) Overpotential for rod and flat-plate cathodes as time passes at No. 1 and No. 3. (c) Uranium ion concentration depending for time spent at each location on rod and flat-plate cathodes.
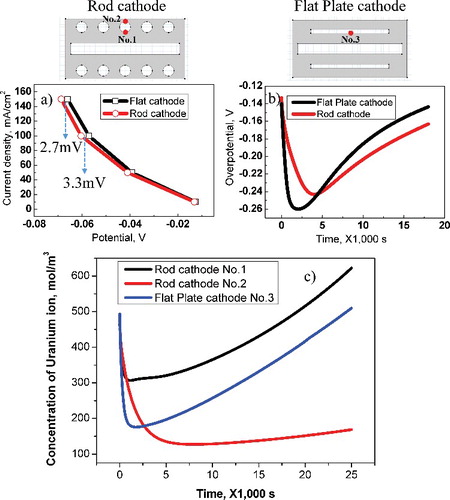
Figure 6. (a) Comparison of differences in overpotential with respect to rod cathode convection effect. (b) Comparison of differences of overpotential with respect to the flat-plate cathode convection effect.
3.4. Comparison of current density distribution with respect to electrode array extension
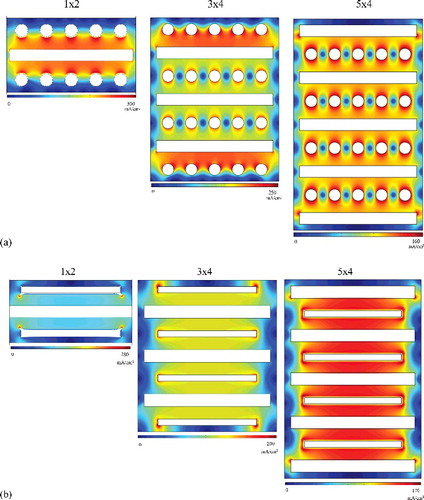
A dynamic simulation for a cell in a cascade unit of flat-plate and rod cathodes was conducted on the basis of the fact that when the anode and cathode are multi-arrayed, there are differences in the electric field due to the influence of adjacent electrodes. shows the current density in a 1 × 2 cell array – an array of one anode and two cathodes – and the concentration of the current density toward the direction in which the cathode faces the anode. As for the 3 × 4 cell array, the current density is concentrated at the last cathode in the row. There is a large difference in current densities in the middle rows. In the case of the 5 × 4 cell array, the current density moving toward the center can be confirmed. Similarly, in the case of the flat-plate cathode shown in (b), when cathodes are placed at both ends of the array, the current density is concentrated toward both ends, whereas it is concentrated evenly at the center when anodes are placed at both ends. This phenomenon appears to depend on whether the anodes are placed at the last rows of the electrorefiner.
Figure 7. (a) Current density distribution on multi-arrayed (1 × 2, 3 × 4, 5 × 4) rod cathode; and (b) multi-arrayed (1 × 2, 3 × 4, 5 × 4) flat-plate cathode.
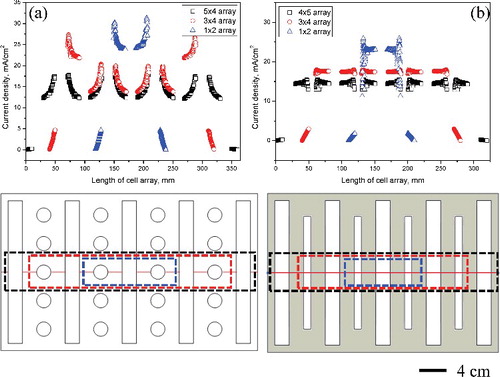
(a) shows the current density distribution quantitatively. It presents the current density distribution for each cell type size (marked with a dotted line) when the applied current is 150 mA cm−2 for 3000 s. In the case of the rod cathode, an increased cell configuration decreases the current density. As shows, the current density is concentrated at the point where the anode and cathode are facing each other. In the case of the 3 × 4 cell array, owing to the absence of anodes at both ends, the center has a different current density from the cathode. In the case of the 5 × 4 cell array, the current density applied to the entire cell is uniformly distributed. The flat-plate cathode, as shown in (b), exhibits current density distribution changes with respect to cell array expansion identical to those of the rod cathode. Thus, it is shown that when recovering uranium during the electrorefining process, placing anodes at the ends of the array increases the efficiency owing to the uniformity of the current.
Figure 8. (a) Comparison of the differences in current density distribution on multi-arrayed (1 × 2, 3 × 4, 5 × 4) rod cathode, and (b) on multi-arrayed (1 × 2, 3 × 4, 5 × 4) flat-plate cathode.
3.5. Electrorefiner verification comparison results
In order to validate the numerical model, a series of experiments and simulations were conducted with the geometry depicted in (a). (b) shows the overpotential curve for the computational analysis results, for each surface area ratio. (c) and 9(d) shows the calculated and experimental cathodic potential--current curves, respectively, for different surface area ratio between cathode and anode. Regarding the experimental condition, anode basket and rod-type cathode were used. The surface ratios between the cathode and anode (A/C) were 1.06, 1.67, and 3.14 under the condition of constant current density of 20, 40, 80, 120, 160, 200, and 240 mA cm−2. As the surface area ratio between the cathode and anode increased, the overpotential also increased in the positive direction because the resistance of the cell decreased. (c) and 9(d) shows the potential–current curve, obtained by computational analysis and experiment. Comparing the computational and experimental results, the surface area ratio of the cathode and the anode has a potential difference in the range of 0.833%–3.946% in the case of 1.06. The deviation increased as the current density increases with the exception of 20 mA cm−2 condition. Given the uncertainties of the material properties, such as the fact that they may limit the current density and diffusion coefficient, the deviations were fairly small. The potential differences were found to range from 0.009% to 6.513% and from 1.395% to 4.695% as the surface ratio (A/C) increased from 1.67 to 3.14, respectively. Hence, the experimental and simulation results were in good agreement under all conditions. However, to improve the reliability of the calculation results based on the proposed model, it is necessary to perform the calculation with a greater variety of conditions. This is because it is difficult to repeat the experiment with exactly identical simulation environments. And, it is possible to recover a large amount of uranium by using the electrorefiner used in the above verification experiments. The amount of U deposit and current efficiency is summarized in . In case of 1.06 of surface area ratio with 120 mA cm−2 of current density for 2100 s, the total amount of uranium deposit was 15.36 g before washing. The weight of uranium deposit decreased to 8.48 g after washing which means significant amount of salt was contaminated during withdrawal of uranium deposit from electrolyte. Thus the calculated current efficiency taking into account of electrochemical equivalent of uranium was 85.67%. Since the total amount of current decreased with increasing surface area ratio, the amount of uranium deposit also decreased. However, current efficiency increased with increasing surface area ratio due to decreasing overpotential explained in (b). Because impurities such as actinides and lanthanides were avoided in this calculation and experiment, they could not affect the current efficiency. Therefore, that the current efficiency increased with increasing surface area ratio, was attributed to the decreases of ohmic resistance and concentration polarization.
Figure 9. (a) Current density distribution, (b) overpotential curve according to surface area ratio, (c) calculated potential--current curve, and (d) experimental potential--current curve according to the surface area ratio of anode to cathode.
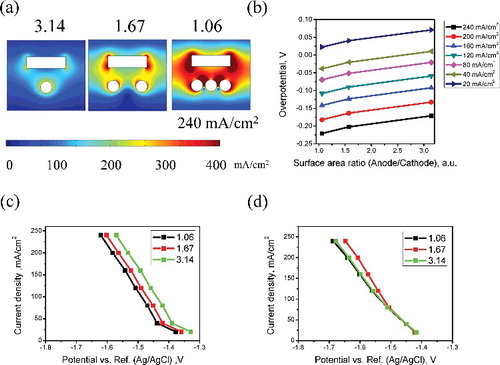
Table 2. Experimental current efficiency for U electrorefining with electrode surface area ratio.
4. Conclusions
Calculation of phenomenological electrodeposition change depending on the shape of the electrorefiner cathode was performed using computation codes verified in previous experiments involving a lab scale electrorefiner. The uniformity of the current density with respect to the applied current for two cathode shapes was analyzed. The uranium dissolution at the anode exhibited an asymmetrical appearance for the flat-plate cathode at 150 mA cm−2 of the applied current. The behavior of the electrodeposit growth was more uniform for the rod cathode, in which the current density was concentrated in one direction. However, according to a comparison of the current–voltage curves, the flat-plate cathode was more efficient. In the case of the convection effect, the decrease in the amount of overvoltage in the rod cathode was 2.7 times more efficient owing to the more effective extension and convection resulting from the existence of an opening in the rod shape. Further, as the array of electrodes was extended, the current density's concentration field shifted, indicating that, for uniformity of current density, it was effective to place anodes at the ends of the array. Comparing the verification experiment with the computational analysis, the two results exhibited considerable similarity; in the case of a 1.06 surface area ratio, the results were 0.833%–3.946%, a potential difference when compared with experiment results. These results could help in determining the optimal type of array for electrodes, as well as in predicting the electrochemical behavior of high-throughput electrorefiners and increasing their efficiency.
Acknowledgments
This work was supported by the National Research Foundation of Korea (NRF) grant funded by the Korean government (MSIP: Ministry of Science, ICT and Future Planning) [grant number 2015M2A8A5021711].
Disclosure statement
No potential conflict of interest was reported by the authors.
Additional information
Funding
References
- Lee H, Park G, Lee J, et al. Current status of pyroprocessing development at KAERI. Sci Technol Nucl Installations. 2013;2013:343492.
- Lee H, Park G, Kang K, et al. Pyroprocessing technology development at KAERI. Nucl Eng Technol. 2011;43(4):317–328.
- You G, Cho I, Choung W, et al. Concept and safe studies of an integrated pyroprocess facility. Nucl Eng Des. 2011;241:415–424.
- Kuznetsov SA, Hayashi H, Minato K, et al. Determination of uranium and rare-earth metals separation coefficients in LiCl–KCl melt by electrochemical transient techniques. J Nucl Mater. 2005;344(1):169–172.
- Uozumi K, Iizuka M, Kato T, et al. Electrochemical behaviors of uranium and plutonium at simultaneous recoveries into liquid cadmium cathodes. J Nucl Mater. 2004;325(1):34–43.
- Nash KL, Lumetta GJ, editors. Advanced separation techniques for nuclear fuel reprocessing and radioactive waste treatment. Cambridge (UK): Woodhead Publishing Limited; 2011.
- Figueroa J, Williamson MA, van Kleeck MA, et al. GTRI progress in developing pyrochemical processes for recovery of fabrication scrap and reprocessing of monolithic U-MO fuel. Paper presented at: InRERTR 2011 33rd International Meeting on Reduced Enrichment for Research and Test Reactors; 2011 October 23, Santiago, Chile.
- Inoue T, Koyama T, Arai Y. State of the art of pyroprocessing technology in Japan. Energy Procedia. 2011;7:405–413.
- Koyama T, Sakamura Y, Iizuka M, et al. Development of pyro-processing fuel cycle technology for closing actinide cycle. Procedia Chem. 2012;7:772–778.
- Song KC, Lee H, Hur JM, et al. Status of pyroprocessing technology development in Korea. Nucl Eng Technol. 2010;42(2):131–144.
- Lee J, Kang Y, Hwang S, et al. Assessment of a high-throughput electrorefining concept for a spent metallic nuclear fuel-I: computational fluid dynamics analysis. Nucl Technol. 2008;162(1):107–116.
- Lee J, Oh K, Kang Y, et al. Assessment of a high-throughput electrorefining concept for a spent metallic nuclear fuel-II: electrohydrodynamic analysis and validation. Nucl Technol. 2009;165(3):370–379.
- Kinoshita K, Inoue T, Fusselman SP, et al. Electrodeposition of uranium and transuranic elements onto solid cathode in LiCl-KCl/Cd system for pyrometallurgical partitioning. J Nucl Sci Technol. 2003;40(7):524–530.
- Kemminger A, Ludwig A. Modelling the electrolyte flow in a full-scale copper electrorefining tankhouse cell. In: Eicke S, Hahn M, editors. European Metallurgical Conference EMC 2013, Vol. 2. Proceedings; 2013 June 23; Weimar; 2013.
- Shibuta Y, Unoura S, Sato T, et al. A phase-field simulation of uranium dendrite growth on the cathode in the electrorefining process. J Nucl Mater. 2011;414(2):114–119.
- Lee J, Kang Y, Hwang S, et al. Application of graphite as a cathode material for electrorefining of uranium. Nucl Technol. 2008;162(2):135–143.
- Koyama T, Iizuka M, Shoji Y, et al. An experimental study of molten salt electrorefining of uranium using solid iron cathode and liquid cadmium cathode for development of pyrometallurgical reprocessing. J Nucl Sci Technol. 1997;34(4):384–393.
- Kim J, Lee S, Park S, et al. High-throughput electrorefining system with graphite cathodes and a bucket-type deposit retriever. Procedia Chem. 2012;7:754–757.
- Hoover RO, Phongikaroon S, Simpson MF, et al. Development of computational models for the mark-IV electrorefiner-Effect of uranium, plutonium, and zirconium dissolution at the fuel basket-salt interface. Nucl Technol. 2010;171(3):276–284.
- COMSOL. COMSOL4.3a. Electrodeposition module user's guide. COMSOL, Inc.; 2013. Available from: http://www.comsol.com
- Bard AJ, Faulkner LR. Electrochemical methods: fundamentals and applications. New York: Wiley; 1980.
- Brett CM, Brett AM. Electrochemistry: principles, methods, and applications. Oxford: Oxford University Press; 1993.
- Britz D. Digital simulation in electrochemistry. New York: Springer; 2005.
- Kim SH, Park SB, Lee SJ, et al. Computer-assisted design and experimental validation of multielectrode electrorefiner for spent nuclear fuel treatment using a tertiary model. Nucl Eng Des. 2013;257:12–20.
- Reddy BP, Vandarkuzhali S, Subramanian T, Venkatesh P. Electrochemical studies on the redox mechanism of uranium chloride in molten LiCl–KCl eutectic. Electrochim Acta. 2004;49(15):2471–2478
- Van Zeghbroeck B. Principles of electronic devices. Upper Saddle River: Prentice Hall Inc; 2011.
- Yoon D, Phongikaroon S. Electrochemical properties and analyses of CeCl3 in LiCl–KCl eutectic salt. J Electrochem Soc. 2015;162(10):E237–E243.
- Kim KR, Choi SY, Kim JG, et al. Electrochemical investigation of exchange current density of uranium and rare-earths couples (M3/M0) in LiCl–KCl eutectic electrolyte. Int J Electrochem Sci. 2015;10:7660–7670.