
 ?Mathematical formulae have been encoded as MathML and are displayed in this HTML version using MathJax in order to improve their display. Uncheck the box to turn MathJax off. This feature requires Javascript. Click on a formula to zoom.
ABSTRACT
Specimens of two kinds of isotropic nuclear graphite, IG-110U and ETP-10, were neutron-irradiated at fluence of 1.92 × 1024 n/m2 (E > 1.0 MeV) at 473 K. The recoveries of the macroscopic lengths of these specimens during isothermal and isochronal annealing at temperatures of up to 1673 K were investigated in a step-wise manner by using a precision dilatometer. The macroscopic lengths after isochronal annealing for 6 h at each temperature decreased gradually as the temperature was increased to 1673 K. The recovery trends of the c-axis and a-axis lattice parameters differed from one another, and from the macroscopic length recovery trends. For the IG-110U specimen, the activation energies (Ea) of macroscopic volume recovery corresponding to annealing at 523–773, 773–923, 923–1073, and 1073–1173 K were found to be 0.15, 0.34, 0.73, and 2.59 eV, respectively. For the ETP-10 specimen, the Ea corresponding to 523–923, 923–1223, and 1223–1373 K were determined to be 0.15, 0.46, and 2.19 eV, respectively. These results indicate that both graphite specimens underwent three or four stages of macroscopic length recovery between 523 K and the annealing temperatures at which their initial lengths were recovered. It is suggested that during the first stage recovery proceeded via the migration of single interstitials along the basal plane and the resulting V-I recombination. In the middle stages, recovery occurred due to the migration of interstitial groups such as C2 along the basal plane, while in the last stage, it proceeded via through-layer migration of interstitials or migration of single vacancies.
1. Introduction
Nuclear energy is one of the most promising clean energy sources and does not cause greenhouse gas emission. However, the Fukushima Dai-ichi Nuclear Power Plants (Tokyo Electric Power Company, boiling-water-type reactors) disaster drew attention to the safety issues related to nuclear energy. Due to their safety and economy, high-temperature gas-cooled reactors (HTGRs) are becoming more popular among nuclear energy systems [Citation1,Citation2]. Nuclear graphite has been used in these nuclear energy systems, especially HTGRs [Citation3] and next-generation very-high-temperature gas-cooled reactors [Citation4], because of its very high sublimation temperature, its excellent nuclear properties such as its large neutron-scattering cross-section, its medium thermal conductivity, and its good mechanical properties in vacuum and inert atmospheres. During the lifetime of graphite in these reactors, damage induced by neutron irradiation degrades its physical properties.
The effects of neutron irradiation on graphite have been studied extensively ever since gas-cooled reactors and HTGRs were first developed and deployed, and large amounts of data have been accumulated [Citation5–12]. At the initial stage of irradiation at higher temperature than ∼673 K, graphite specimen shrinks; then, it increases in volume with increasing fluence. Interstitials and vacancies resulting from neutron irradiation contribute to expansion along the c-axis and shrinkage along the a-axis. However, the internal aligned pores [Citation6,Citation13,Citation14] accommodate the expansion along the c-axis direction, so mainly the contraction along the a-axis is observed. As the neutron dose increases, the differences between the changes of the two lattice parameters lead to the generation of new pores. Then, the rate of graphite swelling begins to increase with increasing neutron dose because of the expansion of the c-axis and new pore generation. At the volume changes, the thermal conductivity of the graphite decreases significantly, down to 20%–80% of its unirradiated values. This thermal conductivity degradation is roughly independent of neutron fluence over 1 × 1025 n/m2 (E > 0.18 MeV) but does depend on the irradiation temperatures [Citation5,Citation15].
The substantial dimensional changes resulting from neutron irradiation are accounted for in reactor design. Furthermore, to reduce the influence of neutron irradiation and to enable graphite recycling, thermal annealing has been considered as a promising post-irradiation method of reversing the property changes experienced by graphite [Citation8].
Kelly et al. [Citation16] studied the effects of annealing on the dimensional changes in Pile Grade ‘A’ graphite after applying various irradiation doses. The recovery of the dimensions perpendicular to the extrusion direction coincided well with that of the c-axis dimensions. The parallel direction showed hardly any recovery and it seemed that the length change caused by the introduction of new void spaces was more evident in this direction. The dimensional changes resulting from the larger interstitial clusters and collapsed lines of vacancies that were caused by high irradiation doses could not recover completely even when annealing was performed at high temperatures up to 3073 K. Burchell [Citation8] studied the behaviors of the dimensions and electrical resistivities of nuclear graphite specimens irradiated by neutrons under a wide range of irradiation conditions when isochronal thermal annealing was performed at temperatures of up to 2000°C. Shrinkage first occurred prior to a turn-around point at about 1500°C, at which swelling began. These studies suggested that the defect structures established during irradiation were different in specimens irradiated at temperatures lower or higher than ∼673K.
Thrower and Mayer [Citation17] reviewed the activation energies of defects in graphite, and reported that the migration energies of vacancies along the a-axis and c-axis were ∼3.1 and >5.5 eV, respectively. However, energies ranging from 0.02 to 0.5 eV were reported for interstitial migration. Telling and Heggie [Citation7] mentioned that the activation energy for single interstitial migration in the basal plane is theoretically predicted to be <0.03 eV, but indicated that it was 1.0 eV in another work, and finally suggested it to be ∼1.2 eV.
There are still fewer experimental observations of the activation energies necessary for graphite to recover from defect introduction, particularly at temperatures higher than room temperature [Citation18]. Therefore, to clarify the kinetics involved in the recovery of nuclear graphite from defects introduction by neutron irradiation in this study, we measured the length change of nuclear graphite (IG-110U and ETP-10) specimens by using a precision dilatometer during annealing at various temperatures after low dose, low-temperature neutron irradiation. The specimens were isothermally and isochronally annealed at temperatures of up to 1673 K to examine their macroscopic length recovery processes. Their lattice parameter changes were also measured after isochronal annealing by using an X-ray diffractometer.
2. Experimental procedures
Two kinds of nuclear graphite, IG-110U and ETP-10, were used in this experiment. IG-110U is isotropic-grade nuclear graphite, produced by Toyo Tanso Ltd., Japan, and manufactured by isostatic molding based on fine petroleum coke. IG-110 graphite has been used in the Japanese High-Temperature Engineering Test Reactor [Citation3]. IG-110U is purified grade of IG-110. ETP-10 is also isotropic-grade nuclear graphite and is produced by Ibiden Ltd., Japan. This type of graphite is used as the first wall materials for JT-60 fusion devices [Citation19]. IG-110 is a typical isotropic-grade nuclear graphite, and has been applied for gas-cooled reactors.
The specimens for the irradiation tests were machined into rectangular bars with dimensions of 2 × 2 × 25 mm3. The samples were wrapped with aluminum foil and encapsulated in the Japan Materials Testing Reactor for neutron irradiation at a fluence of 1.92 × 1024 n/m2 (E > 1 MeV) and the irradiation temperature of <473 K. The corresponding displacement damage per atom (dpa) was ∼0.25 for both specimens [Citation20,Citation21]. Densities of both specimens are almost same (∼1.75 g/cm3), and thermal conductivity at room temperature is 100–120 W/m.K. Other physical properties of the present specimens were listed in the previous papers [Citation20,Citation22].
The specimens were investigated using a precision dilatometer (DIL 402C, NETZSCH, Germany). The length changes of the specimens due to thermal annealing were measured continuously in situ from room temperature (∼296 K) to 1673 K with a step-heating temperature interval of 50 K in a helium atmosphere. The vacuum tube was purged with pure helium three times before helium flowing. The heating rate between each step was 5 K/min. The specimen for isochronal annealing was maintained for 6 h at each measurement step. To obtain the net volumes recovered following neutron-irradiation damage, unirradiated specimens were first measured using the same temperature sequence. The data for these samples were subtracted from the data obtained for the neutron-irradiated specimen, thereby cancelling the effects of thermal expansion. The data were corrected by measuring a reference material (sapphire), since the measured values included both sample-holder expansion and the length change of the specimen. The minimum detection sensitivity of this dilatometer is <10 nm, corresponding to 4 × 10⁻⁵% for a 25-mm-long specimen. The macroscopic volume changes were calculated from the length change assuming homogeneous shape changes, because of isotropic natures of the materials.
The lattice parameters of the graphite specimens were measured at room temperature in the Bragg–Brentano θ–θ geometry using a Philips PW-1700 X-ray diffractometer with a Cu anode (40 kV, 40 mA) after isochronal annealing for 6 h at 473, 673, 873, 1073, 1173, 1273, 1373, 1473, 1573, and 1673 K. The X-ray diffraction (XRD) patterns were measured by the step-scan method between 20°/2θ and 90°/2θ with a step increment of 0.02° and kept 5 s at each step. A curved graphite filter was used to eliminate the Kβ lines. Unit-cell volume was calculated from the a-axis and c-axis lengths with the hexagonal crystal system.
3. Results
The changes in the macroscopic dimensions (average of ∼10 bars) and lattice parameters of the neutron-irradiated IG-110U and ETP-10 specimens are listed in . After the 0.25 dpa neutron irradiation at 473 K, both specimens swelled slightly. The dimensional changes of the ETP-10 specimen are generally slightly greater than those of the IG-110U specimen. The c-axis lattice parameters of both specimens expanded after the neutron irradiation, while the a-axis lattice parameters shrunk. The c-axis parameter changes are more significant than those of the a-axis parameters. The macroscopic volumes and the unit-cell volumes of both of the graphite specimens are larger after irradiation than before, but the percent changes of the macroscopic volumes are smaller than those of the unit-cell volumes in both cases.
Table 1. Macroscopic length change and lattice parameter changes of graphite specimens (IG-110U and ETP-10) irradiated by neutrons with a fluence of up to 1.92 × 1024 n/m2 (E > 1 MeV) at 473 K.
3.1. Recovery during isothermal annealing
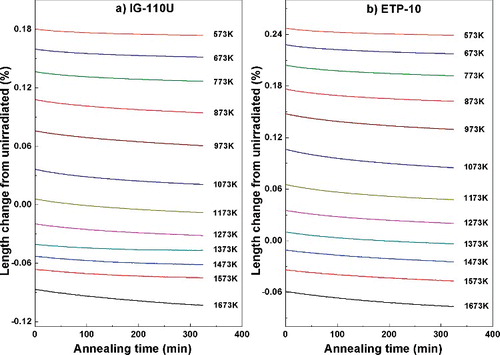
shows the macroscopic length changes of the IG-110U and ETP-10 specimens during isothermal annealing for 6 h at different temperatures. The length was continuously measured in situ with a 50 K temperature increment. However, in this graph only the data of each 100 K increment were presented to avoid complexity. Length change during ramp period between each step was very small. Their macroscopic lengths continuously decrease from one step to the next throughout the 6 h annealing time and do not reach saturation. Furthermore, at higher annealing temperatures, the lengths become shorter than the preirradiation lengths. The length changes of the specimens are not linear with respect to the annealing time. The shrinkage of both specimens at the various isothermal annealing temperatures resembles the behavior of other neutron-irradiated ceramics [Citation23].
Figure 1. Macroscopic length changes of neutron-irradiated (a) IG-110U and (b) ETP-10 specimens versus isothermal annealing time at various temperatures. The length was continuously measured in situ with a 50 K temperature increment. However, in this graph only the data of each 100 K increment were presented to avoid complexity.
3.2. Recovery by isochronal annealing
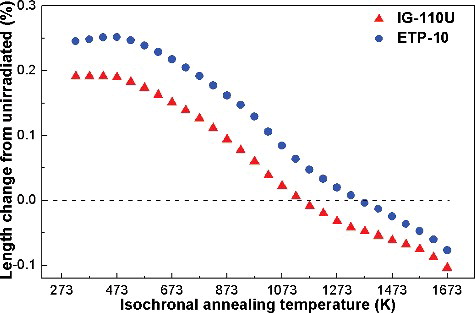
shows the macroscopic length changes of the neutron-irradiated IG-110U and ETP-10 specimens caused by isochronal annealing for 6 h at each temperature step from room temperature to 1673 K. The length changes of the two specimens exhibit similar trends with increasing isochronal annealing temperature; specifically, their macroscopic lengths continuously decreased from 473 to 1673 K. The onset of the recovery process occurs at a temperature slightly higher than the irradiation temperature (473 K). A notable phenomenon is evident from this figure: the neutron-irradiated IG-110U sample continuously shrinks with increasing annealing temperature, and returns to its original length at 1173 K. After isothermal and isochronal annealing at temperatures up to 1673 K, the macroscopic length difference of the IG-110U specimen changes from 0.19% to −0.10%; in other words, it becomes shorter than its original, preirradiation length. The neutron-irradiated ETP-10 sample also exhibits shrinkage, returning to its original length at 1373K, and its length difference reaches −0.08% after annealing at 1673 K. Thus, the neutron-irradiated IG-110U and ETP-10 specimens both exhibit shrinkage to less than their original lengths after certain temperatures and continue to shrink as the annealing temperature increases to 1673 K, but their change appear not to reach saturation. These results mentioned in showed good coincidence with the results of the previous study [Citation22] for the same specimens and received the same irradiation as was applied in this study, but for different isochronal annealing duration of 30 min. Furthermore, the saturation of length change was observed for the IG-110U and ETP-10 specimens when annealed at a temperature of ∼1800 K.
Figure 2. Macroscopic length changes of IG-110U and ETP-10 specimens resulting from isochronal annealing for 6 h at various temperatures, as measured with the dilatometer.
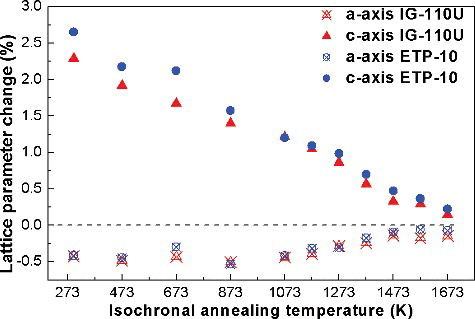
shows the changes in the a-axis and c-axis lattice parameters of the neutron-irradiated IG-110U and ETP-10 specimens that were caused by isochronal annealing for 6 h at temperatures ranging from 473 to 1673 K, and were measured at room temperature using XRD. The c-axis lattice parameters of both specimens decrease gradually from 273 K with increasing annealing temperature and approach zero after annealing at 1673 K. From room temperature to 1073 K, the a-axis lattice parameters of both specimens remain constant. From 1073 to 1473 K, these parameters increase gradually and approach zero. At annealing temperatures above 1473 K, the a-axis parameters again remain constant.
Figure 3. Lattice parameter changes of IG-110U and ETP-10 specimens resulting from isochronal annealing for 6 h at various temperatures and measured at room temperature with X-ray diffractometer.
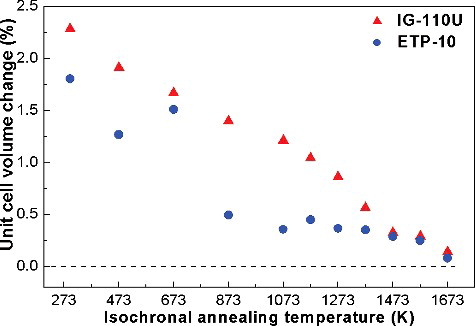
shows the unit-cell volume changes that were caused by isochronal annealing for 6 h at temperatures from 473 to 1673 K and were calculated using the data shown in for the neutron-irradiated IG-110U and ETP-10 specimens. The unit-cell volume of the ETP-10 specimen generally decreases between room temperature and an annealing temperature of 873 K at a rate steeper than that at which it decreases between 873 and 1573 K, except for the measurement corresponding to annealing at 673 K. The unit-cell volume of the ETP-10 specimen almost recovers to its initial value after annealing at 1673 K. On the other hand, the unit-cell volume recovery of the IG-110U specimen continues up to the maximum annealing temperature of 1673 K, at which it nearly recovers to its initial value.
Figure 4. Unit-cell volume changes of IG-110U and ETP-10 specimens by isochronal annealing for 6 h at various temperatures.
4. Discussion
The thermal annealing of graphite can be understood by using kinetic models [Citation24]. The basic relation from which all of the kinetic approaches can be derived is
(1)
(1)
where x is a variable that follows an Arrhenius distribution and increases linearly with time, f(x) is a mathematical function of x that characterizes the sample, and k is a proportionality constant. Various forms of f(x) have been considered; f(x) = x is the simplest, and f(x) = xn is used to consider an nth order reaction.
Defects in low-dose and low-temperature neutron-irradiated silicon carbide could be considered mainly to be point defects or small point-like clusters, and the recovery process of silicon carbide could be considered to consist of the recombination of pairs of interstitial atoms and vacancies, which could be expressed as a first-order reaction [Citation23]. Because of the low temperature (473 K) and relatively low dose (1.92 × 1024 n/m2) of the irradiation applied to the specimens in this study, their recovery processes may also be considered to be first-order reactions. In the annealing kinetics of graphite, researchers have generally assumed a first-order equation [Citation7,Citation24–26].
The Arrhenius equation is the basis of these operations:
(2)
(2)
where k is the rate constant of the reaction; A is the Arrhenius factor, pre-exponential factor or frequency factor; Ea is the activation energy; R is the universal gas constant; kB is the Boltzmann constant; and T is the absolute temperature. By taking the natural logarithms of Equation (Equation2
(2)
(2) ), the following equations can be obtained:
(3)
(3)
Thus, the logarithm of k is a linear function of 1/T with gradient −Ea/kBT, and Ea can be calculated from this gradient.
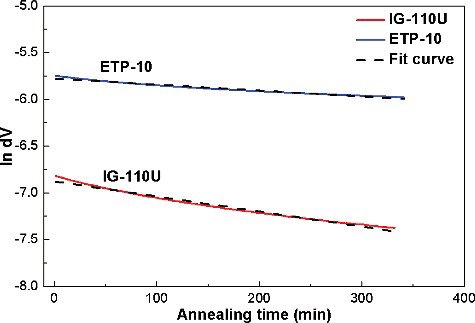
shows logarithmic plots of the volume changes of the IG-110U and ETP-10 specimens as functions of the annealing time at an isothermal annealing temperature of 1073 K. The slopes of the fit lines correspond to the volume recovery rate coefficients, k, at the isothermal annealing temperature of 1073 K.
Figure 5. Logarithms of volume changes of IG-110U and ETP-10 specimens versus annealing time at 1073 K.
The slopes of the straight lines in the isothermal recovery processes at annealing temperatures from 523 to 1673 K of the neutron-irradiated IG-110U and ETP-10 specimens are plotted against an inverse of absolute temperature, as shown in . From the Arrhenius plots, Ea was obtained by the least squares method, and corresponding R2 values are listed in .
Figure 6. Arrhenius plot of volume recovery of neutron-irradiated IG-110U and ETP-10 specimens according to k values and divided and fitted by straight lines.
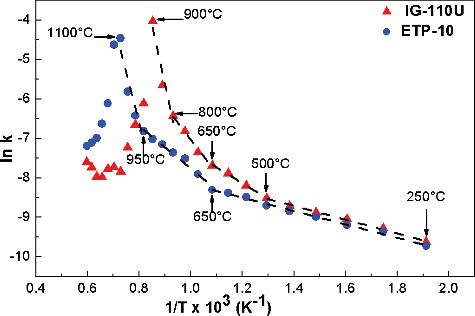
Table 2. Activation energies for volume recovery of neutron-irradiated IG-110U and ETP-10 specimens.
The portion of the Arrhenius plot of the volume recovery rate, k, of the IG-110U specimen corresponding to annealing temperatures up to 1173 K was divided and fitted by four straight lines, i.e. separated into four different stages. The Ea values of the macroscopic volume recovery at 523–773, 773–923, 923–1073, and 1073–1173 K were determined to be ∼0.15, ∼0.34, ∼0.73, and ∼2.59 eV, respectively. At annealing temperatures greater than 1173 K, the shrinkage rate consistently decreases with increasing temperature. For the ETP-10 specimen, the portion of the Arrhenius plot corresponding to temperatures of up to 1323 K was divided and fitted by three straight lines. The Ea values of the macroscopic volume recovery at 523–923, 923–1223, and 1223–1323 K were found to be ∼0.15, ∼0.46, and ∼2.19 eV, respectively. At annealing temperatures >1373 K, the shrinkage rate decreases, as it does for the IG-110U specimen. It is interesting that 1173 and 1373 K correspond to the temperatures at which the macroscopic lengths of the IG-110U and ETP-10 specimens, respectively, reach initial or preirradiation lengths (see ).
Considering the dimensional/volume changes during the isothermal and isochronal annealing process shown in , the recovery processes was divided into two parts. Part І was from room temperature to the annealing temperatures of 1173 or 1373 K, during which the specimens’ lengths shrank and returned to their initial values. In this part, Ea was positive, as mentioned in the previous paragraph. Part II was from the annealing temperature at which each sample returned to its initial length to 1673 K or more, during which the shrinkage rates gradually decreased with the increasing annealing temperature.
Several authors [Citation7 and references in therein, Citation27] have mentioned neutron-irradiation-induced defects in graphite, which can be described as follows. At irradiation temperatures lower than ∼573 K, vacancies are essentially immobile, but the interstitials can collide and form two kinds of interstitial, immobile groups. The first ‘submicroscopic’ interstitial group consists of 4 ± 2 atoms and will not grow further, i.e. they exhibit no appreciable affinity for mobile interstitials. Defects of this type should be the main contributors to the c-axis lattice parameter change. Within the defects of this type, carbon dimmer C2 is known to be a stable species. The defects of second group act as nuclei for further condensation of diffusing interstitials and even eventually form small new planes (interstitial loops). When the irradiation dose is small, the vacancies are single and can accept diffusing interstitials for V-I annihilation. As the dose increases, new vacancies are intermittently created next to existing vacancies, creating slit-like defects that collapse or partially collapse parallel to the basal plane, and are not accessible for interstitial annihilation. Iwata [Citation26] attributed the Wigner energy release peaks of pyrolytic graphite at ∼473 K to the decomposition of interstitial clusters of different sizes, namely, (C2)2, (C2)3, and (C2)4, with activation energies (1.34–1.78 eV for each rate-determining reaction). The mobilities of the vacancies seemed to be low at temperatures <673 [Citation8] or 873 K [Citation6].
During recovery processes in Part І, the c-axis lattice parameter decreases gradually with increasing temperature, while the a-axis lattice parameter reaches a plateau (), and the unit-cell volume continuously shrinks (). Therefore, the macroscopic dimensional changes of the graphite specimens in Part І were attributed to the migration of interstitials that will be annihilated with vacancies, while the vacancies remained immobile. The migration energies of single interstitials have been reported to be very small, specifically, 0.02–0.5 eV [Citation7]. Kelly [Citation27] considered that single interstitials start moving at around 70 K and mentioned that the ∼0.24 eV energy barrier against interstitial-vacancy recombination could reasonably explain crystal growth along the c-axis [Citation28]. The Ea necessary to cause the motion of the interstitial groups parallel to the basal plane was reported to be 1.0–1.25 eV [Citation7]. Meanwhile, Thrower and Mayer stated in their review [Citation17] that numerous researchers had suggested ∼0.2 eV for the interstitial migration energy. A value of 0.47 eV was also reported for this process on the surface of graphite [Citation29].
Considering these reported values, it is supposed that the migration of single interstitials along the basal plane (0.2 eV or less [Citation7,Citation17]) and resulting interstitial-vacancy recombination proceed with an energy barrier (0.24 eV [Citation28]) mainly occur between 523 and 773 K for IG-110U and between 523 and 923 K for ETP-10 (first stage). This stage corresponds to the famous Wigner energy release peak at around ∼473 K. However, the Ea values obtained for the energy release by Iwata [Citation26] did not match those obtained in the present study. In the second and third stages for the IG-110U specimen (773–923 and 923–1073 K) and the second stage for the ETP-10 specimen (923–1223 K), the migration of interstitial groups such as C2, (C2)2, and so on along the basal plane (1.0–1.25 eV [Citation7], 0.47 eV [Citation29]) may have occurred. During these stages, the c-axis length decreases greatly, corresponding to the decreasing number of interstitials, while the a-axis length does not change, as shown in . The latter phenomenon may be explained by the amount of vacancies induced being more than a critical amount that would effectively decrease the a-axis lattice parameter. The excess vacancies are annihilated by V-I recombination, so the a-axis length does not change. Another possibility is that most of the interstitials migrate to sinks such that dislocation loops or surface, and then does not contribute to V-I recombination. From 1073 to 1173 K for the IG-110U specimen (fourth stage) and from 1223 to 1373 K for the ETP-10 specimen (third stage), two mechanisms are possible; through-layer interstitials migration (i.e. migration along the c-axis) (2.3 eV [Citation7]) or single-vacancy migration (1.75 eV [Citation7], 3.1 eV [Citation17]). When the annealing temperature is >1073 K, the a-axis length slightly increases, indicating reduction in the number of vacancies. Ea may be affected by the presence of impurities, such as boron [Citation7].
As shown in , the reaction rate decreases with increasing temperature at temperatures >1173 and >1373 K for IG-110U and ETP-10, respectively, so that complex reactions should progress in Part II. During recovery processes in Part II, the c-axis lattice parameters and the unit-cell volume still decrease gradually, while the a-axis lattice parameters being increasing (recovering). After isochronal annealing at 1673 K, the c-axis and a-axis lattice parameters and the unit-cell volume almost return to their original values; however, the volume of graphite decreases to below its original value (). This volume decrease in Part II indicates that the reduction of porosity and/or closure of microcracks (Mrozowski crack [Citation13,Citation14]) resulted in the macroscopic (bulk) volume shrinkage. In this temperature range, vacancies are sufficiently mobile [Citation6,Citation8], and may be take a large role for the volume shrinkage.
5. Conclusions
The effects of the isothermal and isochronal annealing at temperatures of up to 1673 K on the macroscopic lengths and lattice parameters of the neutron-irradiated isotropic nuclear graphite specimens, IG-110U and ETP-10 (1.92 × 1024 n/m2 (E > 1 MeV) at 473 K), can be summarized as follows:
| (1) | After isothermal and isochronal annealing at temperatures of up to 1673 K, the recovery of macroscopic dimensions of the IG-110U and ETP-10 specimens did not fully recover; instead, their dimensions continued decreasing to less than their preirradiation values. The c-axis lattice parameters continuously decreased and mostly recovered when annealing was performed at 1673 K, while the a-axis lattice parameters did not change at annealing temperatures of up to 1073 K, then increased gradually and were near zero when annealing was performed at 1473 K. | ||||
| (2) | During the annealing processes, the shrinkage rates became faster, exhibiting three or four stages, until the annealing temperatures at which the macroscopic lengths reached their preirradiation values. Beyond those temperatures, the shrinkage proceeded more slowly. For the IG-110U specimen, the values of Ea for 523–773, 773–923, 923–1073, and 1073–1173 K were 0.15, 0.34, 0.73, and 2.59 eV, respectively. For the ETP-10 specimen, the values of Ea for 523–923, 923–1223, and 1223–1323 K were 0.15, 0.46, and 2.19 eV, respectively. | ||||
| (3) | The volume recovery was presumed to occur as follows. From the irradiation temperature to the first boundary temperatures (i.e. during the first stages), recovery proceeded via the migration of single interstitials along the basal plane and the resulting V-I recombination. In the second (for the IG-110U and the ETP-10 specimens) and third (for the IG-110U specimen) stages, recovery occurred due to the migration of interstitial groups such as C2, (C2)2, and so on along the basal plane, while in the fourth (for the IG-110U specimen) or third (for the ETP-10 specimen) stage, it proceeded via through-layer migration (i.e. migration along the c-axis) of interstitials or migration of single vacancies. | ||||
From the present study, the recovery processes of neutron-irradiation-induced defects in typical nuclear graphite along annealing temperatures are partly clarified. However, volume recovery processes at higher temperatures are still unclear. Furthermore, the correspondence of volume recovery processes and Wigner energy release also remain to be addressed.
Acknowledgments
The authors are grateful to the Tokyo Institute of Technology – Tsinghua University Joint Program and the China National Science and Technology Major Project for its support [grant number ZX06901].
Disclosure statement
No potential conflict of interest was reported by the authors.
Additional information
Funding
References
- Hu Z, Li ZC, Chen DY, et al. CO2 corrosion of IG-110 nuclear graphite studied by gas chromatography. J Nucl Sci Technol. 2014;51:487–492.
- Li ZC, Chen DY, Fu XG, et al. The influence of pores on irradiation property of selected nuclear graphites. Adv Mater Sci Eng. 2012;2012:1–6.
- Sumita J, Shimazaki Y, Shibata T. Investigation on structural integrity of graphite component during high temperature 950°C continuous operation of HTTR. J Nucl Sci Technol. 2014;51:1364–1372.
- Shibata T, Kunimoto E, Eto M, et al. Interpolation and extrapolation method to analyze irradiation-induced dimensional change data of graphite for design of core components in very high temperature reactor (VHTR). J Nucl Sci Technol. 2010;47:591–598.
- Shibata T. Nuclear graphite. In: Somiya S, editor-in-chief. Handbook of advanced ceramics. 2nd ed. Amsterdam: Elsevier; 2013. Chapter 2.5; p. 113–123.
- Burchell TD. Radiation effects in graphite and carbon-based materials. MRS Bull. 1997;22:29–35.
- Telling RH, Heggie MI. Radiation defects in graphite. Philos Mag. 2007;87:4797–4846.
- Burchell TD, Pappano PJ, Strizak JP. A study of the annealing behavior of neutron irradiated graphite. Carbon 2011;49:3–10.
- Burchell TD, Snead LL. The effect of neutron irradiation damage on the properties of grade NBG-10 graphite. J Nucl Mater. 2007;371:18–27.
- Snead LL, Burchell TD, Katoh Y. Swelling of nuclear graphite and high quality carbon fiber composite under very high irradiation temperature. J Nucl Mater. 2008;381:55–61.
- Ishiyama S, Burchell TD, Strizak JP, et al. The effect of high fluence neutron irradiation on the properties of a fine-grained isotropic nuclear graphite. J Nucl Mater. 1996;230:1–7.
- Maruyama T, Kaito T, Onose S, et al. Change in physical properties of high density isotropic graphites irradiated in the “JOYO” fast reactor. J Nucl Mater. 1995;225:267–272.
- Mrozowski S. Mechanical strength, thermal expansion and structure of cokes and carbons. Proceedings of the 1st and 2nd Conferences on Carbon; Buffalo (NY): The University of Buffalo; 1956. p. 31.
- Karthik C, Kane J, Butt DP, et al. Neutron irradiation induced microstructural changes in NBG-18 and IG-110 nuclear graphites. Carbon. 2015;86:124–131.
- Sumita J, Shibata T, Nakagawa S, et al. Development of an evaluation model for the thermal annealing effect on thermal conductivity of IG-110 graphite for high-temperature gas-cooled reactors. J Nucl Sci Technol. 2009;46:690–698.
- Kelly BT, Martin WH, Price AM, et al. The annealing of irradiation damage in graphite. J Nucl Mater. 1966;20:195–209.
- Thrower PA, Mayer RM. Point defects and self-diffusion in graphite. Phys Stat Solidi A. 1978; 47(11):11–37.
- Schweitzer DG. Activation energy for annealing single interstitials in neutron-irradiated graphite and the absolute rate of formation of displaced atoms. Phys Rev. 1962;128:556–559.
- Takatsu H, Ando T, Miyamoto M, et al. Present knowledge about the materials behavior in JT-60. J Nucl Mater. 1988;155–157:27–40.
- Maruyama T, Harayama M. Neutron irradiation effect on the thermal conductivity and dimensional change of graphite materials. J Nucl Mater. 1992;195:44–50.
- Tanabe T, Maruyama T, Iseki M, et al. Radiation damage of graphite: degradation of material parameters and defect structures. Fusion Eng Des. 1995;29:428–434.
- Maruyama T. Neutron irradiation effect on the dimensional change of graphite materials. Proceedings of the Third Information Exchange Meeting; Ibaraki-ken (Japan): OECD/NEA; 2004. p. 95–106. (OECD/NEA No. 5309)
- Yamazaki S, Yoshida K, Yano T. Comparative experimental study on recovery behavior of point defects in neutron-irradiated SiC. J Nucl Mater. 2011;417:425–429.
- Lasithiotakis M, Marsden B, Marrow J, et al. Application of an independent parallel reactions model on the annealing kinetics to irradiated graphite waste. J Nucl Mater. 2008;381:83–91.
- Lasithiotakis M, Marsden BJ, Marrow TJ. Application of an independent parallel reactions model on the annealing kinetics of BEPO irradiated graphite. J Nucl Mater. 2012;427:95–109.
- Iwata T. Fine structure of Wigner energy release spectrum in neutron irradiated graphite. J Nucl Mater. 1985;133:361–364.
- Kelly BT. The behavior of graphite under neutron irradiation. J Vac Sci Technol A. 1986;4:1171–1178.
- Kelly BT. The theory of irradiation damage in graphite. Carbon. 1977;15:117–127.
- Lehtinen PO, Foster AS, Ayuela A, et al. Magnetic properties and diffusion of adatoms on a graphene sheet. Phys Rev Lett. 2003;91:017202.