
 ?Mathematical formulae have been encoded as MathML and are displayed in this HTML version using MathJax in order to improve their display. Uncheck the box to turn MathJax off. This feature requires Javascript. Click on a formula to zoom.
ABSTRACT
During the material relocation phase of core-disruptive accidents in sodium-cooled fast reactors, the sedimentation behavior of fragmented debris discharged from the reactor core into the lower plenum region leading to a debris-bed formation is crucial in regard to in-vessel retention and safety concerns. The height of the beds formed may influence both the cooling of the bed from the decay heat in the fuel and the neutronic characteristics. To develop an experimental database of bed formation behavior, a series of experiments using simulant materials, namely, Al2O3, ZrO2, and stainless steel, were performed under gravity-driven discharge of solid particles from a nozzle into a quiescent cylindrical water pool. The bed height was measured for particles of different size, density, and sphericity, and an injection nozzle with varying diameter, injection velocity, and injection height. From these experiments, an empirical correlation was established to predict the bed height for both homogeneous and mixed particles for the different properties. This correlation reproduces reasonably well the experimental trend in bed height with critical factors, which were identified in this and previous experiments.
1. Introduction
During the material relocation phase of core disruptive accidents in sodium-cooled fast-breeder reactors (SFRs), molten core materials may relocate under gravity-driven discharge through potential paths such as the control rod guide tubes into the sodium plenum. They settle to form debris beds on the core-support structure and/or in the lower plenum after rapid quenching and fragmentation of melts in the subcooled sodium [Citation1]. Sufficient cooling of the formed debris beds as well as their neutronically subcritical configurations is necessary for in-vessel retention of degraded core materials. A multi-layered tray installed in the bottom region of the reactor vessel has been proposed as a design measure for debris retention [Citation2]. The decay heat generated in the debris and accumulated throughout the different layers is expected to be removed stably by natural convection developed in the sodium plenum.
Heat transfer relevant to decay-heat removal from debris beds has gained much attention in the past decades. Much of the theoretical and experimental investigations has been focused on the related subjects of debris-bed characteristics [Citation3,Citation4]. However, among most of this research, the shapes of the debris bed were ad hoc, e.g. cylindrical [Citation5], cone or Gaussian-shaped [Citation6], heap-like [Citation7,Citation8], conical [Citation9] or homothetically piled [Citation10]. Moreover, a previous analysis of debris-bed coolability in a reactor accident has assumed that debris beds are homogeneous and uniformly spreading over the bottom of the reactor pool [Citation3]. However, to obtain a realistic shape for the debris bed for a particular scenario of melt release from the core, the process of debris-bed formation has to be modeled, taking into account solid-debris sedimentation.
In the past, experimental studies using simulant materials were performed considering the homogeneous solid particles [Citation11] and, in connection to this study, an investigation was accomplished for mixed particles with different properties [Citation12]. These experimental studies revealed the nature of the particle bed shape and its dependency on some crucial factors, such as diameter and length of the nozzle used in injecting solid particles into the pool, and particle density and particle diameter. In addition, the characteristic of debris bed mound was also investigated in these experimental studies employing three types of solid particles with Al2O3, ZrO2, and stainless steel (SS) of spherical and non-spherical shapes. In addition, experimental studies for mixed particles included an analysis of the distribution of particles with different properties in the bed during bed formation for mixed particles that exhibited contributions of different particles in forming different portions of the particle bed during sedimentation [Citation12].
In the present study, to clarify the fundamental characteristics of the debris sedimentation and bed formation behaviors, a series of experiments using simulant materials was conducted for mixed particles with different densities and sizes, as well as homogeneous particles. The effects of particle properties on the bed shape were investigated in detail. In addition, based on the experimental data obtained, an empirical correlation was developed to predict particle-bed height as a function of experimental parameters such as particle properties and particle injection conditions. The present experimental data on debris sedimentation and bed formation and the empirical model for bed height are expected to be useful for the development and validation of physical models used by a series of computational tools [Citation13–16] based on the codes SIMMER-III [Citation17] and SIMMER-IV [Citation18] for fast reactor safety analysis.
2. Particle sedimentation experiments
2.1. Experimental apparatus
depicts the experimental apparatus used in the particle sedimentation experiment. The main components of the apparatus are the vessel and particle injection device. The vessel is a transparent acrylic cylinder, 375 mm in diameter Dc and 1020 mm in height. In the experiments, solid particles and water represent the fuel debris and coolant, respectively. The vessel is filled with water up to a height of 825 mm. A round particle collector tray with an area of 1104 cm2 is positioned beneath the vessel. Particle injection occurs at the top of the vessel, with the funnel placed on a separate structural base at a height of 1217 mm. Its diameter is 350 mm at the upper end and 53.5 mm at the lower end; its height is 405 mm along its central axis. A 70-mm long nozzle is attached at the lower end and maintained at various heights (720, 630, and 473 mm) from the particle tray.
Figure 1. Schematic diagram of experimental setup.
In some experiments, a longer nozzle (length 1000 mm) was employed to increase the initial injection velocity of solid particles. The lower end of the nozzle was immersed in the water column of the vessel by maintaining water levels at 105 mm above the lower end of the nozzle to reduce air bubble inclusion into the water during particle settling process. In the experimental runs, a stopper rod with a conical end was initially inserted into the particle injection device to plug the release hole preventing the solid particles flowing out into the vessel. The cylindrical vessel was placed inside an outer rectangular pool of transparent acrylic and the gap between the vessel and rectangular pool was filled up with water to reduce the effect of refraction while videoing the experimental events. In recording particle sedimentation, a digital video camera was employed that recorded the events online at tens of frames per second.
2.2. Experimental procedure
In the present experiments, the main characteristics of bed formation were investigated during sedimentation of the homogeneous and mixed particles with different diameter dp and density ρp. We also evaluated the effects of nozzle diameter dn on the bed shape. The solid particles (bulk volume of 5 L) were discharged under gravity through different injection nozzles of diameter dn = 20, 30, and 40 mm into the cylindrical water pool. These particles were spherical and non-spherical with dp∼2–6 mm and were released from the nozzle by lifting the stopper rod. The discharged particles eventually accumulated forming a mound on the particle tray.
The physical properties of the solid particle debris are listed in for both homogeneous particles and mixed particles. Particle density ρp, diameter dp, and sphericity Φ, as well as porosity ϵ and terminal velocity vt, are detailed. For mixed particles and non-spherical particles, dp is represented by the volume-average diameter. For these mixed particles, average density was used in the experimental analysis. The measured porosity of solid particles was in the range of 32%–51%. The particle sphericity was determined experientially based on Ergun's equation [Citation19]. The particle terminal velocity, which represents the drag acting on a free-fall particle in the coolant, was calculated from the force balance on the particle using coefficient of drag CD [Citation20]. In the present study, vt denotes the measured impact velocity of the falling particles on the bed mound. For mixed particles, vt was calculated using their volume-average diameter and average density. In addition, the initial velocity vi of the particle was defined as the cross-sectional average injection velocity at the injection nozzle exit and was determined using the duration for particle injection.
Table 1. Physical properties of solid particles
In collecting experimental data, for homogeneous debris, a total of 119 experimental runs were performed and categorized into two groups, one of 76 runs using spherical particles, including 17 for which the 1000-mm diameter nozzle was employed, and 43 runs using non-spherical particles. The experimental runs within each group were conducted with three different nozzle heights (473, 630, 720 mm). The first group contains spherical particles of Al2O3, ZrO2, and SS; the second group contains non-spherical particles of Al2O3 and SS with diameters ranging from 1.1–6.0 mm. For mixtures of particles of different sizes, 13 experimental runs of binary and tertiary mixtures were also investigated. In these mixtures, equal volume proportions was employed. The experimental data obtained with homogenous particles and mixed particles of different sizes were then used as input in the regression analysis to correlate the dimensionless quantities of the groups in establishing the empirical model to be discussed in Section 4. Conversely, the experimental data for mixed particles with different densities were not considered for the empirical analysis because of some irregular bed mound characteristics to be discussed in Section 5.
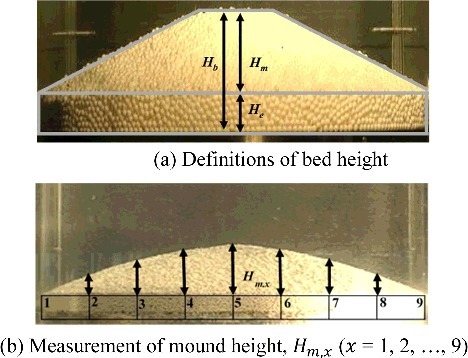
In the experiments, we focused attention on evaluating the effects of crucial factors identified in our previous studies [Citation11,Citation12] on the behaviors of particle sedimentation as well as bed mound shape and height. Based on the understanding of the current experimental observations, it is believed that the appearance of the bed height profile depends on the degree of impact of the different factors. Consequently, for a quantitative evaluation, the bed shape was represented by the mound height Hm, which is defined as the height of the heap above the particle bed at the axis of symmetry, quantified by subtracting the height He at the edge of the bed from the height Hb of the particle bed measured along the axis of symmetry ((a)). The mound heights of different particle beds were compared to estimate the relative variation in the mound elevation for a comparative analysis. The elevation of Hm depends on the elevation of Hb. Image analysis software was used with the recorded video images to measure mound heights, Hm, x (x = 1,…,9) at nine equidistant points along the transverse direction ((b)).
Figure 2. Definition and measurement of bed height.
2.3. Discussion on experimental conditions
With the present experiments, we worked with debris sedimentation in a cylinder of fixed diameter and assumed the debris beds are formed mainly in subdivided sections of each layer of the multi-layered debris tray. Although the bed diameter is a crucial parameter for bed formation, additional experiments using a modified apparatus are necessary to clarify its influence. The injection nozzle corresponds to melt relocation paths such as the control rod guide tubes and the entrance nozzles of coolant channels below the core support structure. Its diameter and exit height in the present experiments were comparable with reactor conditions although it depends on each reactor design.
We employed solid particles of Al2O3, ZrO2, and SS as simulant debris; the fragmented core debris are composed of SS and oxide fuel. The binary mixtures of these simulant debris of widely different densities are useful in clarifying the influence of debris mixtures on sedimentation and bed formation behavior. The typical size of fragmented fuel debris formed by fuel-coolant interactions is on the order of 0.1–1 mm in diameter [Citation21], and hence the range of particle size in the experimental cases mostly cover that in the reactor cases. Quantitative shape factors of the core debris formed by fragmentation as a result of melt-sodium interactions are not fully understood. The influence of particle shape on sedimentation is considered to depend on particle sphericity and the coefficient of drag, which is represented by the terminal velocity, as well as the equivalent spherical diameter.
We used water as simulant coolant for safety and convenience. However, its transparency is very useful in observing the behavior during sedimentation in the pool. The difference in liquid properties such as viscosity between water and sodium will have some effect on the behavior. The prediction for reactor conditions can be addressed computationally to simulate debris dynamics as well as various influences of multi-phase flows on the sedimentation processes.
3. General bed formation behavior
3.1. Homogeneous particles
In past experiments, a Gaussian-type convex or a ring-type concave mound was observed for uniform particles [Citation11]. In general, a transition in mound shape was observed by increasing either nozzle diameter or particle density for all particle types. The particle diameter is found to be another crucial factor that for relatively larger-sized particles played a determining role in forming convex-shaped mounds. In all cases, when a transition in mound shape occurred from convex to concave, Hm was observed to decrease.
3.2. Mixed particles
3.2.1. Different particle sizes with the same material (density)
Some representative findings of typical experimental observations are discussed next where in particular the focus was on quantifying the mound shape in terms of its concavity at the mound top. Under the conditions that were established, several experiments were accomplished to measure bed characteristics. shows the top and side views of typical beds of mixed Al2O3 particles with dp∼2 and 4 mm for (a) dn = 20 and (b) dn = 40 mm, dp∼2 and 6 mm for (c) dn = 30 mm and (d) 40 mm, and dp∼4 and 6 mm for (e) dn = 40 mm. In these binary mixtures, two different sizes of particles were mixed in equal volumes. Color is used to code particles sizes. The pictures demonstrate that the mound shape transforms notably depending on the diameter and individual role of the nozzle. The bed shape for mixed Al2O3 particles with dp∼2 and 4 mm is convex for dn = 20 mm, and eventually becomes concave for the larger nozzle (diameter 40 mm) under the same experimental conditions. Consequently, nozzle diameter is recognized as a critical factor in mound shape transitions from convex to concave. The concavity was observed to increase with larger nozzle diameters.
Figure 3. Typical bed shapes for a mixture of Al2O3 particles with different particle size (Nh = 720 mm).
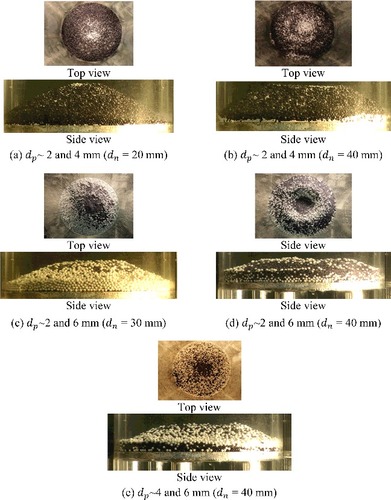
Moreover, particle size was identified as another factor with a pronounced role in this process. From (b,e), the bed shape obtained with Al2O3 particles of size dp∼4 and 6 mm is still convex for the larger nozzle (diameter dn = 40 mm), whereas with Al2O3 particles with dp∼2 and 4 mm the shape is concave for the same nozzle diameter. This observation suggests that smaller particles are inclined to form concave profiles. In addition, the concavity is quite large in comparison with other mixtures ((d)). This may arise because the differences in volume and in mass are large between small and large particles. Smaller particles get pushed aside in collisions with larger particles around the mound top. As a result, a particle bed with a large concavity is formed, thereby lowering bed height.
3.2.2. Different material (density) with the same particle size
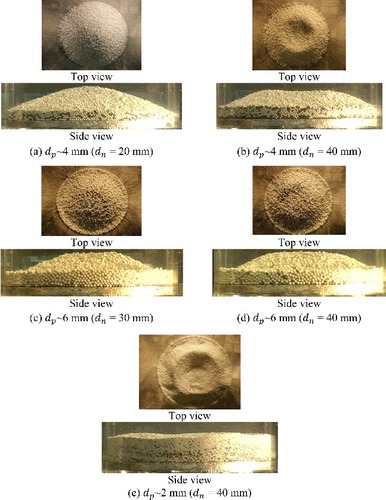
Some representative findings of typical experimental observations for binary mixtures with different material (density) and same particle size are discussed next. shows top and side views of a typical bed of mixed Al2O3 and SS particles with dp∼4 mm for (a) dn = 20 mm and (b) dn = 40 mm, and dp∼6 mm for (c) dn = 30 mm and (d) dn = 40 mm. In these binary mixtures, Al2O3 and SS particles are mixed in equal volume proportion. The bed shape exhibit identical characteristics to previous cases with different sizes of particles of the same material (density). The concavity of bed mound increases as nozzle diameter increases and particle size decrease. A bed shape that is almost flat was found for Al2O3 and SS particles with dp∼2 mm and dn = 40 mm ((e)). This may arise with larger nozzle diameters, which increase the mass flux of the main particle stream (particle jet) along the nozzle axis. Hence with larger impacts, the particle bed is effectively compressed with lighter Al2O3 particles being pushed away from the bed center through strong collisions with heavier SS particles, thereby flattening the bed.
Figure 4. Typical bed shapes for a mixture of Al2O3 and SS particles (Nh = 720 mm).
4. Development of empirical model
4.1. Dimensional analysis
In our previous experimental study [Citation11,Citation12], by considering the characteristics of the particle sedimentation and bed formation behaviors observed [Citation22], the following empirical model was proposed for the bed height Hb with homogeneous particles using nine dimensionless parameters, (1)
(1) In this model, Hb of the particle bed is expected to depend on several dimensional variables. Bearing this in mind, the variables influencing particle bed formation during particle sedimentation were: particle diameter dp, particle density ρp, nozzle diameter dn, nozzle height Nh, density difference Δρ between particles and fluid, porosity volume in the particle bed ϵVp, fluid viscosity μf, initial particle velocity vi, terminal velocity vt, cylinder diameter Dc, and sphericity Φ. In developing an empirical correlation, we took dp, ρp, and Φ as parameters to account for the influence of particle properties during sedimentation. The consideration of dn reflects mainly the effect of the particle relocation path. Parameter Δρ expresses the buoyancy of settling particles. To estimate the net particle volume, ϵ was incorporated with Vp. We considered μf to include the fluid property during particle sedimentation. The particle velocity averaged at the cross section of the injection nozzle is denoted by vi in the initial conditions for a falling particle. The drag acting on particles settling in the coolant is denoted by vt, which is evaluated from the coefficient of drag CD. The surface area of non-spherical particles is represented by Φ, which determines mainly the friction between particles. We set Dc as the geometrical dimension of the cylindrical pool as the pool wall influences the edge height of settling particles.
The above empirical model for bed height has been applied to a series of sedimentation experiments performed under various conditions of nozzle diameter and height, and particle properties (size, density, and sphericity) [Citation22]. From this comprehensive study, this empirical model was demonstrated to have wide applicability over a range of conditions to predict particle bed height observed in experiments using homogeneous particles.
In the present study, a modified empirical correlation model was developed by extending the previous empirical model to various experimental conditions including mixed particles with different properties. One of the parameters, nozzle height Nh, was excluded from the model equation. This is because under the present experimental conditions, the particles falling from the nozzle with velocity vi travel shorter distances than Nh before they reach their terminal velocity. As a result, it is expected that most of the falling particles impact the bed mound with velocities near their terminal velocity, and hence the variation in Nh has less effect on the particle bed formation. In addition, the particle surface area Ap, which is associated with Φ and dp, was used instead of Φ.
Hence, the modified dimensionless equation for the correlation of Hb is (2)
(2) where K and A ∼ G are empirical constants to be determined from experimental data. Note that the parameter ϵVp in EquationEquation (1)
(1)
(1) is also replaced with the net particle volume (1 − ϵ)Vp, which directly contributes to the actual bed height, although this replacement does not change resulting correlation. In addition, Hb is made dimensionless and normalized by not Dc but dn, which is the representative dimension in the modified empirical model.
4.2. Correlations for bed height
Using the experiment settings listed in , we established the empirical correlations for homogeneous and mixed particles given that the cylindrical water pool has diameter Dc = 375 mm. Of all 132 experimental settings, 119 corresponded to homogeneous particles and 13 to mixed particles of different sizes; they were used to determine the empirical constants in EquationEquation (2)(2)
(2) , giving the result,
(3)
(3) EquationEquation (3)
(3)
(3) was obtained using experimental data for which 0.001 ⩽ dp/dn ⩽ 0.210,0.710 ⩽ Δρ/ρp ⩽ 0.910,
31.0 ⩽ (1 − ϵ)Vp/dn3 ⩽ 519, 4.68 × 10³ ⩽ ρpvidn/μf ⩽ 1.92 × 10⁵, 8.50 ⩽ Dc/dn ⩽ 19.3, 0.550 ⩽ vt/vi ⩽ 0.690, and 0.001 ⩽ Ap/dn2 ⩽ 0.196.
shows the results of the regression analysis for ln(Hb/dn). The value obtained for the coefficient of determination R2 for EquationEquation (3)(3)
(3) which is defined in [Citation23], indicates that 97% of the variability in the data points for Hb/dn can be described by the present regression equation. The maximum deviation from the experimental results was found to be 19.8%. The present empirical model successfully predicts the experimental results and yields a standard deviation of 6.80%.
Figure 5. Comparison of Hb/dn between experiments and predictions.
4.3. Results of analysis
In addition to establishing the overall validity of this model, the correlation of each dimensionless term in the empirical model was examined using experimental data. For example, if the term dp/dn in EquationEquation (3)(3)
(3) correlates reasonably well with the experimental data, then a linear trend should be seen in a plot of
(4)
(4) where A = 1.36 from the regression analysis and R is the product of the dimensionless terms except for (dp/dn)A on the right-hand side (RHS) of EquationEquation (3)
(3)
(3) . The RHS of EquationEquation (4)
(4)
(4) is calculated using the parameter values obtained for each experimental setting () and its result, and then compared with the corresponding experimental value (dp/dn)Exp. Performing the same operation for the other dimensionless terms, we can verify the linearity of each term on the RHS of EquationEquation (3)
(3)
(3) . shows the linearity of all seven dimensionless terms in a comparison of predicted and experimental data. The terms dp/dn, Δρ/ρp, (1 − ϵ)Vp/dn3, ρpvidn/μf, Dc/dn, vt/vi , and Ap/dn2 predict 100%, 100%, 91%, 92%, 100%, 90%, and 87% of the data points within 20% of the experimental results, respectively. These results demonstrate that each term on the RHS of EquationEquation (3)
(3)
(3) provides a reasonably good correlation of the experimental data.
Figure 6. Linearity of dimensionless terms of the present empirical model for bed height.
5. Discussion on bed formation behavior
5.1. Homogeneous particles
The bed formation behaviors observed in the experiments are discussed for homogeneous particles of Al2O3 and ZrO2 with dp∼2, 4, and 6 mm for dn = 30 mm and Nh = 720 mm. and show for homogeneous particles of Al2O3 and ZrO2, respectively, (a) the radial variation of mound height and (b) the peak mound height. In (b) and (b), the peak mound heights predicted by the empirical correlation, EquationEquation (3)(3)
(3) , are indicated for comparison. From (a), a broad bed mound of Al2O3 particles with dp∼6 mm is seen to be clearly lower and flatter than the others. The peak mound height corresponding to dp∼6 mm is also lower than others ((b)). In general, smaller particles are dispersed laterally and widely during sedimentation in the pool [Citation24], and hence the observed trend in peak mound height may arise through a relatively larger velocity for dp∼6 mm particles impacting on the mound surface. This rapid lateral dispersion of these Al2O3 particles of dp∼6 mm compared to smaller particles occurs because of the higher impact velocity of the larger particles on the bed mound, resulting then in a lower mound peak. In contrast, for ZrO2 particles (), an opposite trend in mound height variation is observed that depends on particle size. Also the peak mound height increases slightly as particle size increases. One reason is the impact force of the particle jet is not large enough to disperse the heavier ZrO2 particles of diameter dp∼6 mm. Consequently, weak dispersion takes place for these particles relative to smaller ones that conspires in forming a larger bed mound. Conversely, from (b) and (b), the lighter Al2O3 particles exhibit slightly larger mound height peaks compared to the heavier ZrO2 particles, and this indicates the effect of density on particle bed formation. Note that predicted mound heights are comparable with measured values for both Al2O3 and ZrO2 particles.
Figure 7. Bed mound height of Al2O3 homogeneous and mixed particles (dn = 30 mm; Nh = 720 mm).
Figure 8. Bed mound height of ZrO2 homogeneous and mixed particles (dn = 30 mm; Nh = 720 mm).
5.2. Mixed particles
5.2.1. Mixture of particles with different size
The experimental data for mixtures of Al2O3 particles with dp∼2 and 6 mm and with dp∼2, 4 and 6 mm, and of ZrO2 particles with dp∼2, 4 and 6 mm, were analyzed in regard to bed formation characteristics for mixed particles of different sizes. The average diameters of these mixed particles are listed in . and also provide a comparison of results of the radial mound height variation and mound peak for the three situations.
The particle size is the crucial parameter for mixed particle bed formation. This is because bed porosity, which depends on the mixing ratio of the different size of the particles, governs the various aspects of bed mound characteristics for Al2O3 and ZrO2 particles. (b) shows that compared with homogeneous Al2O3 particles, the two mixed Al2O3 particle settings yield larger mound peaks. In (b), a similar trend is seen for settings with mixed ZrO2 particles. In general, beds of mixed particles of different sizes have relatively lower porosities compared with those of homogeneous particles. displays the dependence of bed porosity on mound height peak for Al2O3 and ZrO2. The mixed particle beds with lower porosities have higher bed mounds in comparison with homogeneous particle beds. This is because friction is larger between particles in beds of lower porosity. Consequently, collapsing of the bed is more difficult during sedimentation, thus conspiring in forming larger mound tops. In contrast, for heavier homogeneous ZrO2 particles with dp∼2 mm, the particle bed is lower despite the porosity being relatively lower ((b)). This is mainly because the effect of higher density dominates over that of porosity. This effect of porosity on the mound height is also reproduced reasonably well by our empirical correlation.
Figure 9. Effect of porosity on mound height for homogeneous and mixed particles (dn = 30 mm; Nh = 720 mm).
5.2.2. Mixture of particles with different density
With nozzle height set at under Nh = 720 mm, indicates the effect of average particle density on mound height for Al2O3 and SS mixed particles with dp∼2 and∼4 mm for dn = 20 and 40 mm. In general, the bed height decreases as particle density increases. This is because with their larger impact at the top of the mound, the heavier particles collapse the bed mound. However, some irregular characteristics can be seen in this figure. For dn = 20 mm, mixtures of equal volume proportion show the largest mound height for both dp∼2 and∼4 mm. For dn = 40 mm, a similar trend is also seen for dp∼4 mm, although the mound height variation depends only slightly on particle density. After settling down on the bed, heavier SS particles move outward with greater difficulty, resulting in the formation of higher beds as observed. However, once heavier SS particles predominate within the mixture, they push away the lighter Al2O3 particles from the bed center region; the outward dispersion then creates flatter and lower beds. In contrast, an opposite trend is observed for dp∼2 mm with dn = 40 mm. The larger diameter of the injection nozzle increases the mass flux of the main particle stream or falling particle jet into the pool, and hence the particle bed collapses more effectively through collisions between the Al2O3 and SS particles on the bed mound. These impacts may become strongest when the Al2O3 and SS particles are mixed in equal volume proportions. As the heavier SS particles predominate in the mixture, the bed height approaches that for homogeneous SS particles.
Figure 10. Effect of average particle density on mound height for a mixture of Al2O3 and SS particles (Nh = 720 mm).
6. Concluding remarks
With a view towards safety issues for the plenum of SFRs, a series of experiments was performed for mixed solid particles, as well as homogeneous particles, with different physical attributes to investigate the characteristics of debris bed formation behavior. As previously observed in the beds of homogeneous particles, mixed particles also form concave-shaped beds depending on nozzle diameter and the particle sizes. We also investigated the effect of the particle density and size on particle sedimentation and bed formation. The general trends shown were for uniform homogenous particles in forming relatively higher mounds with smaller particle densities and larger particle diameters, whereas for mixed particles, bed porosity, which depends on the mixing ratio of particles of different sizes, and the average particle density are also crucial factors during bed formation.
Based on the experimental data, an empirical correlation of the bed height was developed for homogeneous and mixed solid particles. The form of the proposed empirical correlations was confirmed by performing a detailed analysis of the effect of the current experimental parameters. However, the proposed empirical model needs to be improved so as to include the effect of mixed particles of different densities. Nevertheless, it is expected that the present experimental study provides fundamental data on characteristics of debris sedimentation and bed formation in validating the various computer codes as well as safety issues in regard to the plenum of SFRs.
| Nomenclature | ||
| CD | = | Drag coefficient |
| dp | = | Particle diameter [m] |
| dn | = | Nozzle diameter [m] |
| Dc | = | Cylinder diameter [m] |
| g | = | Gravitational acceleration [m/s2] |
| Hb | = | Bed height [m] |
| Hm | = | Mound height [m] |
| Nh | = | Nozzle height [m] |
| ρp | = | Particle density [kg/m3] |
| Vp | = | Bulk particle volume [m3] |
| vt | = | Terminal velocity [m/s] |
| vi | = | Initial particle velocity [m/s] |
| ρf | = | Fluid density [kg/m3] |
| μf | = | Fluid viscosity [Pa⋅s] |
| ϵ | = | Porosity [-] |
| φ | = | Sphericity [-] |
| Abbreviations | ||
| Exp. | = | Experiment |
| Pred. | = | Predicted |
Acknowledgments
We thank Richard Haase, Ph.D, from Liwen Bianji, Edanz Group China (www.liwenbianji.cn/ac), for editing the English text of a draft of this manuscript.
Disclosure statement
No potential conflict of interest was reported by the authors.
Additional information
Funding
Related Research Data
References
- Tentner AM, Parma E, Wei T, et al. Severe accident approach-final report evaluation of design measures for severe accident prevention and consequence mitigation. Lemont (IL): Argonne National Laboratory; 2010. ( ANL-GENIV-128).
- Nakai R, Suzuki T, Kamiyama K, et al. Development of level 2 PSA methodology for sodium-cooled fast reactors (1) Overview of evaluation technology development. Proceedings of 8th International Topical Meeting on Nuclear Thermal Hydraulics, Operation and Safety; 2010 Oct 10–14; Shanghai, China. N8P0095.
- Yakush S, Kudinov P, Dinh TN. Modeling of two phase natural convection flows in a water pool with a decay-heated debris bed. Proceedings of International Congress on Advances in Nuclear Power Plants (ICAPP 2008); 2008 June 8–12; Anaheim, CA, USA: American Nuclear Society. p. 1141–1150.
- Ma W, Dinh TN, Buck M, et al. Analysis of the effect of bed inhomogeneity on debris coolability. Proceedings of 15th International Conference on Nuclear Engineering (ICONE15-10752); 2007 Apr 22–26; Nagoya, Japan. [CD-ROM].
- Bürger M, Buck M, Schmidt W, et al. Validation and application of the WABE code: investigation of constitutive laws and 2D effects on debris coolability. Nucl Eng Des. 2006;236:2164–2188.
- Yakush S, Kudninov P. Simulation of ex-vessel debris bed formation and coolability in a LWR severe accident. Proceedings of Implementation of Severe Accident Management Measures (ISAMM 2009); 2009 Oct 26–28; Schloss Böttstein, Switzerland.
- Karbojian A, Ma W M, Kudinov P, et al. A scoping study of debris bed formation in the DEFOR test facility. Nucl Eng and Des. 2009;239:1653–1659.
- Weimin MA, Truc-Nam D. The effects of debris bed's prototypical characteristics on corium coolability in a LWR severe accident. Nucl Eng and Des. 2010;240:598–608.
- Zhang B, Harada T, Hirahara D, et al. Self-leveling onset criteria in debris bed. J Nucl Sci Technol. 2010;47:384–395.
- Alvarez D, Amblard M. Fuel levelling. In: Mueller U, Guenther C. Proceedings of 5th Information Exchange Meeting on Post-Accident Debris Cooling; 1982 July 28–30; Karlsuhe, Germany: G. Braun; p. 28–3 3.
- Shamsuzzaman M, Horie T, Fuke F, et al. Experimental evaluation of debris bed characteristics in particulate debris sedimentation behaviour. Proceedings of 21st International Conference on Nuclear Engineering (ICONE21); 2013 July 29–Aug 2; Chengdu, China. [CD-ROM].
- Sheikh MAR, Son E, Kamiyama M, et al. Experimental investigation on characteristics of mixed particle debris in sedimentation and bed formation behavior. Proceedings of 11th International Topical Meeting on Nuclear Reactor Thermal Hydraulics, Operation and Safety (NUTHOS-11); 2016 Oct 9–13; Gyeongju, Korea. [CD-ROM].
- Guo L, Morita K, Tagami H, et al. Numerical simulation of a self-leveling experiment using a hybrid method. Mech Eng J. 2014;1(4):TEP0024–TEP0024.
- Guo L, Morita K, Tobita Y. Numerical simulation of gas-solid fluidized beds by coupling a fluid-dynamics model with the discrete element method. Ann Nucl Energy. 2014;72:31–38.
- Tagami H, Tobita Y. Numerical simulation for debris bed behavior in sodium cooled fast reactor. Proceedings of 10th International Topical Meeting on Nuclear Thermal-Hydraulics, Operation and Safety; 2014 Dec 14–18; Okinawa, Japan. NUTHOS10-1141.
- Guo L, Morita K, Tobita Y. Numerical simulations of gas-liquid-particle three-phase flows using a hybrid method. J Nucl Sci Technol. 2016;53(2):271–280.
- Tobita Y, Kondo SA, Yamano H, et al. The development of SIMMER-III, an advanced computer program for LMFR safety analysis and its application to sodium experiments. Nucl Technol. 2006;153(3):245–255.
- Yamano H, Tobita Y, Fujita S, et al. First 3-D calculation of core disruptive accident in a large-scale sodium-cooled fast reactor. Ann Nucl Energy. 2009;36(1):337–343.
- Wen, CY, Yu, YH. Mechanics of fluidization. Chem Eng Prog Symp Ser. 1966;62(62):100–111.
- Morita K, Matsumoto T, Nishi S, et al. A new empirical model for self-leveling behavior of cylindrical particle beds. J Nucl Sci Technol. 2016;53(5):713–725.
- Fauske HK, Koyama K. Assessment of fuel coolant interactions (FCIs) in the FBR core disruptive accident (CDA). J Nucl Sci Technol. 2002;39(6):608–614.
- Shamsuzzaman M, Horie T, Fuke F, et al. Experimental study on debris bed characteristics for the sedimentation behavior of solid particles used as simulant debris. Ann Nucl Energy. 2018;111:474–486.
- Kvalseth TO. Cautionary note about R2. Am Stat. 1985;39(4):279–285.
- Shamsuzzaman M, Horie T, Fuke F, et al. Experimental investigation on debris sedimentation behaviour on bed formation characteristics. Proceeding of the Eighth Japan–Korea Symposium on Nuclear Thermal Hydraulics and Safety (NTHAS8); 2012 Dec 9–12; Beppu, Japan. [CD-ROM].