 ?Mathematical formulae have been encoded as MathML and are displayed in this HTML version using MathJax in order to improve their display. Uncheck the box to turn MathJax off. This feature requires Javascript. Click on a formula to zoom.
ABSTRACT
The filter-type ‘transXend’ detector is an energy-resolving X-ray detector consisting of an energy-integrating flat-panel detector and multiple filters. In our previous studies, we have shown the effectiveness of the transXend detector, but the filters used were not optimized. To obtain better performance, the filters, especially their thickness and material, should be considered. In this paper, we present a method that can preliminarily estimate filter performance by comparing their noise sensitivity before carrying out numerous experiments. Two kinds of filter sets, Cu–Sn and W–Ag, with various thicknesses were evaluated. The results suggest that to image a 20-cm-thick object with 120-kV X-rays, an unfiltered channel and a channel filtered with 0.5-mm-thick Sn or 0.4-mm-thick Ag may be the best combination. The optimal filter thickness will be smaller if the object is thinner and the tube voltage is lower. For applications that require a wide dynamic range of detector response, a channel with a W filter may be better than an unfiltered channel. To verify the calculation results, computed tomography imaging experiments with a 3-cm-diameter phantom were also performed, and the experimental results showed good agreement with the calculation results.
1. Introduction
X-ray computed tomography (CT) is a widely-used technique in medical diagnostic applications [Citation1,Citation2]. By detecting the attenuation of X-ray intensity and performing tomographic reconstruction, the anatomical structure inside a patient can be estimated noninvasively. In conventional CT imaging, the X-ray image detectors are energy-integrating detectors. This kind of detector accumulates the signals induced by incident X-ray photons of any energy during a frame time and outputs an accumulated charge value for each pixel. This leads to loss of X-ray energy distribution information and has some shortcomings; for example, limited material differentiation ability and artifacts resulting from the beam-hardening effect [Citation3]. To overcome these problems, imaging techniques using energy information have been proposed. Photon-counting CT, as its name suggests, employs photon-counting detectors to measure the energy of each photon so that spectral information can be obtained [Citation4,Citation5]. However, such imaging systems are not commercially available yet because of their limited count rate. Another approach called dual-energy computed tomography (DECT) [Citation6,Citation7] has been introduced into clinical applications recently. Methods to implement DECT include a dual-source approach, dual-layer detector approach, and rapid voltage switching approach, which require two pairs of X-ray sources and detectors, a specially designed detector array, and a dedicated power supply unit capable of rapidly switching tube voltage, respectively. Therefore, DECT imaging is currently only available in high-end CT systems and is still expensive.
In our previous studies, we proposed a filter-type ‘transXend’ detector for energy-resolved X-ray CT imaging [Citation8]. The filter-type transXend detector consists of a commercially available flat-panel detector (FPD) and multiple filters attached to the FPD. When an incident X-ray beam passes through different filters, its spectrum changes according to the transmittance of the filters and thus results in different output values from the FPD (the outputs with different filters are called ‘channels’ in this paper). If appropriate filters are used, energy information can be analyzed from the output values. The advantages of the filter-type transXend detector include its usability as well as its low cost: the filters can be easily replaced or removed if necessary, and no special X-ray sources or detectors are required. Therefore, it is suitable for FPD-based X-ray imaging systems such as dental cone-beam CT systems and C-arm systems.
Although energy-resolved imaging techniques can provide useful information for material discrimination, these techniques are sensitive to detection noise [Citation9,Citation10]. While measuring an X-ray beam using an image detector, the output value of each pixel will deviate from the ideal value due to uncertain factors such as the quantum noise, dark current, and electronic noise of readout circuits, i.e. the measured projection data will contain detection noise. The detection noise then propagates and leads to a deviation in the material discrimination results during the energy-resolving process. For a filter-type transXend detector, the noise propagation depends on the response functions, which are dominated by the filters. Therefore, appropriate filters should be employed to suppress the deviation in the final results. In our previous study, the filter-type transXend detector was set up with 0.1-mm-thick Cu and 0.1-mm-thick Sn filters and consisted of four channels: (Equation1(1)
(1) ) no filter, (Equation2
(2)
(2) ) Cu filter, (Equation3
(3)
(3) ) Sn filter, and (Equation4
(4)
(4) ) both Cu and Sn filters. We showed that this set-up could provide energy-resolved images, but the filter materials and filter thickness have not yet been optimized. Appropriate optimization should allow the performance of the detector to be further improved. In other words, the detector should provide images with less noise under the same imaging dose if appropriate filters are selected. Optimization of the filter set can be achieved by performing experiments, but experiments with numerous filter sets can be costly and time-consuming, and the results may be affected by experimental error. It is desirable to have a method that can preliminarily compare the performance of different filter sets before conducting experiments. For estimating the noise in energy-resolved CT imaging, Kelcz et al. [Citation11] proposed a method and compared two kinds of DECT techniques. However, the filter-based technique and systems with more than two channels were not discussed. In this study, we design a method for the multi-channel filter-type transXend detector based on the concept of noise sensitivity comparison, evaluate multiple filter sets using this method, and verify the results with experiments.
In this paper, the term ‘noise’ refers to the standard deviation of a signal. The term ‘signal-to-noise ratio (SNR)’ refers to the ratio of the mean value of a signal to its standard deviation. The signal above can be the detector pixel values (channel outputs) before the energy-resolving process, or the material decomposition results after the energy-resolving process.
2. Materials and methods
2.1. Response functions and filters
The energy response function (simply called the ‘response function’) is the relationship between the energy of incident X-ray photons and the response (output value) of the detector. To obtain information about the energy of the incident X-rays, the transXend detector requires some channels that are sensitive to low-energy photons and other channels that are relatively sensitive to high-energy photons. Precisely speaking, if considering the response function of a channel as a vector (the elements within are the responses to different energies), the system should have multiple channels that have good orthogonality with each other, and the energy-resolving performance of the system will depend on the orthogonality of the channel response functions.
For a filter-type transXend detector like that shown in of Ref. [Citation8], the response function of each channel is the response function of the base detector multiplied by the photon transmittance of the applied filter. Considering a scintillator-coupled FPD as the base detector, its response function can be approximately given as the energy absorption of the scintillator. Because the base detector of each channel is the same FPD, the response function difference between each channel mainly depends on the photon transmittances of the filters used, which are determined by their material and thickness and can be calculated using the mass attenuation coefficients of the filter materials [Citation12]. For example, the four-channel system with Cu and Sn filters described above has the response functions shown in . (a) is the energy absorption of a 0.15-mm-thick gadolinium oxysulfide (GOS) scintillator determined by a Geant4 simulation [Citation13,Citation14]. (b) displays the photon transmittances of the filter(s) of each channel: (Equation1(1)
(1) ) none, (Equation2
(2)
(2) ) 0.1-mm-thick Cu only, (Equation3
(3)
(3) ) 0.1-mm-thick Sn only, and (Equation4
(4)
(4) ) both 0.1-mm-thick Cu and 0.1-mm-thick Sn. The final response functions are depicted in (c). In this case, channel (Equation1
(1)
(1) ) without a filter is the lowest-energy channel, and channel (Equation4
(4)
(4) ) is the highest-energy channel.
Figure 1. (a) Energy absorption of a 0.15-mm-thick GOS scintillator. The sharp edge at 50 keV is the K-edge of Gd. (b) Photon transmittance of (Equation1(1)
(1) ) no filter, (Equation2
(2)
(2) ) a 0.1-mm-thick Cu filter, (Equation3
(3)
(3) ) a 0.1-mm-thick Sn filter, and (Equation4
(4)
(4) ) both a 0.1-mm-thick Cu filter and 0.1-mm-thick Sn filter. (c) Response functions of the four channels (products of (a) and (b)).

An important factor that affects the performance of the detector is filter thickness, which is a tradeoff between the orthogonality of response functions and the SNR in the measured data. For a filter-type transXend detector, to obtain response functions with good orthogonality, the high-energy channel must have a thick filter. However, a filter that is too thick can drastically attenuate the X-ray intensity and induce a low output value, which means that the channel output will have a low SNR. Therefore, an optimal filter thickness is expected to exist. To obtain better filter performance, it is necessary to find the optimal filter thickness.
As well as the Cu–Sn filter set, another possibility is using a filter with a K-edge that attenuates the high-energy photons and makes the channel relatively sensitive to low-energy photons. shows the response functions of a 0.15-mm-thick GOS scintillator combined with a 0.1-mm-thick W filter or 0.5-mm-thick Ag filter. Because W has a K-edge at 69.5 keV, the response function has relatively high values under 69.5 keV. Compared with an unfiltered channel, an advantage of using a K-edge filter for the low-energy channel is that the output value will be suppressed so that the difference in output value between high- and low-energy channels will be decreased (which will be discussed later).
Figure 2. Response functions of a W–Ag two-channel system combined with a 0.15-mm-thick GOS scintillator. Dashed line: 0.1-mm-thick W; solid line: 0.5-mm-thick Ag.
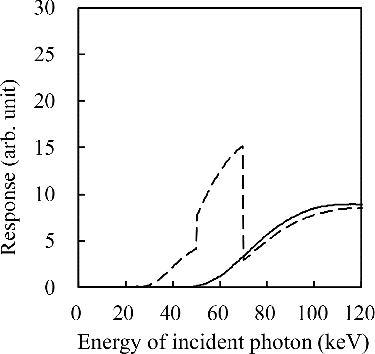
In this study, we evaluated the performance of four kinds of filter sets, as summarized in . Each filter set has two or four channels, which are composed of two filters. For each filter, eight thicknesses were chosen: 0, 0.1, 0.2, 0.3, 0.4, 0.5, 0.6, and 1.0 mm for Cu, Sn, and Ag; 0, 0.01, 0.02, 0.04, 0.07, 0.12, 0.2, and 0.4 mm for W. That is, for each filter set, the performance of 63 thickness combinations was evaluated except for the combination where both filters had a thickness of 0 mm. The method used to evaluate filter performance is described in Section 2.2.
Table 1. Configurations of the filter sets evaluated in this study
2.2. Method to estimate filter performance
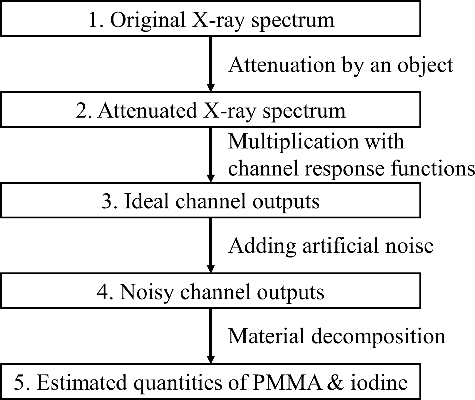
The concept of the method used to estimate the filter performance is comparing their noise sensitivity. As mentioned in the introduction, the noise in the measured data will propagate and influence the results of the energy-resolving process. Here, we use the term ‘noise sensitivity’ to describe the noise level in the results after the energy-resolving process while a noise is given into the measured data. For a good filter set, the output value of each channel should change markedly as the energy distribution of the incident X-rays changes. Therefore, the influence of noise in the channel output values is relatively small and does not induce a large error in the results. That is, a better filter set should have lower noise sensitivity than that of a poorer one. Conversely, a poor filter set that has high noise sensitivity can amplify the noise and lead to very noisy results after the energy-resolving process. Based on this concept, we designed the following method to compare the noise sensitivity of filter sets, as shown in .
The first two steps are preparing an X-ray spectrum and calculating the spectrum after the X-ray beam passes through an object containing polymethylmethacrylate (PMMA) and iodine tincture (concentration of iodine: 45.3 mg/cm3). This object configuration models a human body containing iodinated contrast agent. In these steps, we calculated the original spectrum using the formula of Birch and Marshall [Citation15] and calculated the attenuated spectrum according to the Beer–Lambert law [Citation2]:
(1)
(1) where Y(E) and Y0(E) are the attenuated and original intensities, respectively, of X-rays of photon energy E;
and
are the mass attenuation coefficients of PMMA and iodine tincture, respectively, for E; and (ρl)P and (ρl)T are the density–length products (i.e. the line integrals of density values) of PMMA and iodine tincture, respectively, along the X-ray path.
The next step is obtaining the ideal output value of each channel by calculating the product of the attenuated spectrum and response function. This step is a simple matrix multiplication as follows:
(2)
(2) where the vector C contains the output value of each channel, vector Y is the attenuated spectrum, and each row of matrix R is the response function of each channel.
After the ideal channel output values are obtained, some artificial noise should be added to the ideal values to simulate the measurement noise. The added noise is a randomly generated noise with a Gaussian distribution of which the mean value is zero and the standard deviation is determined by the noise model described in Section 2.3. The noise-containing output values are then analyzed using the material decomposition process based on a lookup table described in Section 2.4, and the material decomposition process returns the equivalent (ρl)P and (ρl)I of the object (note that the latter result (ρl)I is the density–length product for iodine, not iodine tincture). Because of the added noise, the returned values will deviate from the true values, as illustrated by the scatter plot in . Small noise in the channel outputs does not greatly affect the total attenuation ratio but is sufficient to make the energy-resolving process misjudge the proportion of the two materials, which results in the oblique spread in . For example, if the high-energy channel has a higher value than the ideal one, (ρl)P will be underestimated and (ρl)I will be overestimated because the attenuation contribution of PMMA is relatively high at the high-energy range.
Figure 4. Representative scatter plot of the estimated PMMA quantity and estimated iodine quantity. The results show a spread because the channel data contain noise. This case is a four-channel system (none/Cu 0.1 mm/Sn 0.1 mm/Cu 0.1 mm + Sn 0.1 mm). The resulting SNRs of (ρl)P and (ρl)I are 100.92 and 5.94, respectively.
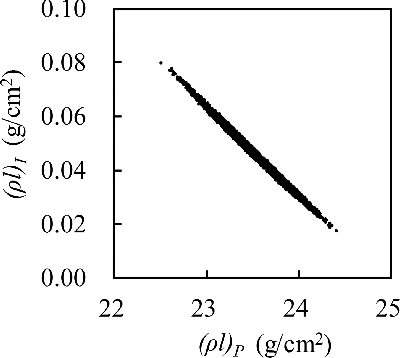
For each case, we generated 30,000 noise-containing channel outputs for material decomposition, and calculated their SNR of (ρl)I as the index of noise sensitivity. The sample size, 30,000, was chosen to let the standard deviation of the generated data be close to the designated standard deviation (relative error < 1% at the 98% confidence level). If a filter set has low noise sensitivity (i.e. good performance), the scatter plot will have a narrow spread and result in a high SNR.
In the calculations, we considered a medical X-ray tube and prepared the original spectrum with the following parameters: W target, 12° target angle, 2.6-mm-thick Al inherent filtration, and tube voltage of 80 or 120 kV. In general CT imaging, the shape of the object is close to a circle or ellipse, which means that the thickness of the object is not uniform. To simplify the calculation, we calculated only the thickest part of the object, where the material decomposition would be the most challenging. Two objects were calculated in this study: (Equation1(1)
(1) ) a 20-cm-thick object with its thickest part containing 19-cm-thick PMMA with 1-cm-thick iodine tincture for 120-kV imaging; (Equation2
(2)
(2) ) a 5-cm-thick object with its thickest part containing 4.5-cm-thick PMMA with 0.5-cm-thick iodine tincture for 80- and 120-kV imaging. The intensity of the original spectrum was set to make the output value of an unfiltered channel be at 50% of the dynamic range of the base FPD.
2.3. Noise model
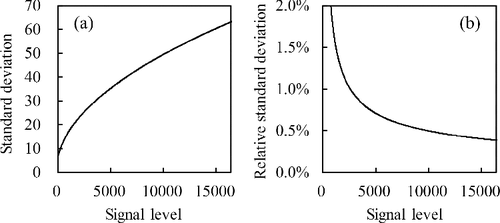
In this study, a simple noise model is used to describe the noise magnitude of the FPD. Assuming that the noise has a Gaussian distribution and considering the noise that comes from dark current and incident X-rays, the variance of the output value (σt2) can be expressed as
(3)
(3) where σd2 and σs2 are the variances of the signal-independent dark noise and signal-dependent noise resulting from the incident X-rays, respectively [Citation16]. σs2 is proportional to the offset-corrected average signal level
. Therefore, σt can be expressed as a function of the signal level
:
(4)
(4) where g is a constant of gain, and σd2 should also be a constant if the frame time is fixed and the environment is stable.
The range of is assumed to be 0–16,383 for a 14-bit FPD, and the constant σd2 and g are set to 50 and 0.24, respectively, based on the FPD used in the experiment described in Section 4. The relationship between the average output signal level and the corresponding relative standard deviation is shown in . also demonstrates that the influence of noise increases when the signal level is low, as described in Section 2.1.
2.4. Material decomposition
For transXend detectors, there are two types of methods used to analyze the measured data: the spectrum unfolding method and the material decomposition method. The former is based on the SAND-II code [Citation17], which obtains the energy distribution of the incident X-ray beam through an iterative process. Although we have shown that this method is feasible [Citation18], its result is not a single value but a vector (the size is equal to the number of energy bins), which can make the result comparison complicated. Also, its result may be sensitive to the initial guess [Citation19]. Therefore, we chose the material decomposition method in this study. The material decomposition method can be implemented with various methods; here, we implemented it with a lookup-table-based method.
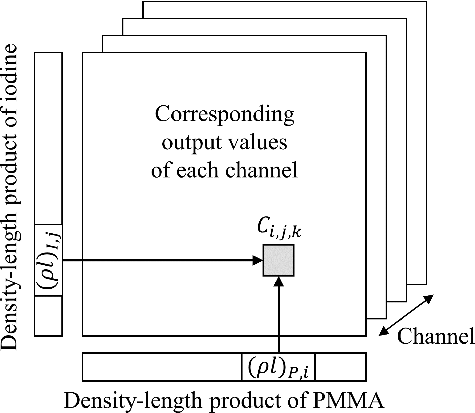
Similar to the method described in Section 2.2, considering an X-ray beam passing through an object containing only PMMA and iodine, the attenuated spectrum can be theoretically calculated using the Beer–Lambert law if the original spectrum is known. By changing (ρl)P and (ρl)I, the results of all possible combinations will form a two-dimensional (2D) table. Then, the spectrum can be converted into channel output values by matrix multiplication with the response functions. As illustrated in , the final lookup table for PMMA–iodine decomposition is a three-dimensional array: the first and second dimensions represent (ρl)P and (ρl)I, respectively; the third dimension is the channel number. The content at (i, j, k) is the theoretical output value of channel k if the equivalent density–length products of PMMA and iodine in the object are (ρl)P, i and (ρl)I, j, respectively.
When given a set of channel output values, the best i and j can be determined by comparing the given values and the values in the lookup table. If the given values include noise, the values of all channels may not completely agree with those in the lookup table. Therefore, assuming the detector has L channels and the size of the lookup table is M × N × L, we determine the result using the method of weighted least squares as follows:
(5)
(5) where Cmk is the given measured value of channel k, Ci, j, k is the value of channel k at (i, j) in the lookup table, and σt(Ci, j, k) is the corresponding noise magnitude of Ci, j, k as defined in EquationEquation (4)
(4)
(4) .
and
are the estimated best indices of the equivalent density–length products of PMMA and iodine, respectively.
The algorithm for searching for the best result in the lookup table can be a simple linear search. In addition, because the contents in the table decrease monotonically in the first and second dimensions, the search algorithm can be improved; for example, by using a 2D binary search algorithm. We omit this part because it is not the main focus of this study. It should also be noted that the method described above consists of only theoretical calculation. To apply it to experiments, the contents of the lookup table must be calibrated with the measured data.
3. Calculation results
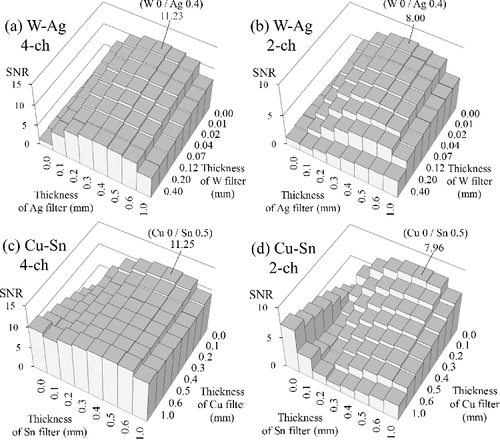
shows the results of the four filter sets under the test conditions of a 120-kV tube voltage, 19-cm-thick PMMA, and 1-cm-thick iodine tincture. For the two-channel cases ((b) and (d)), the best SNR occurs at W 0 mm/Ag 0.4 mm and Cu 0 mm/Sn 0.5 mm, respectively. That is, while using an unfiltered channel as the low-energy channel, the optimal thickness of the high-energy channel is about 0.4 mm for an Ag filter or 0.5 mm for an Sn filter (Ag and Sn have close atomic numbers, so their transmittances are similar). For the four-channel cases ((a) and (c)), although the trend is different, the best SNR occurs at the same combinations as those of the two-channel cases. For the best combination of the four-channel cases, the thickness of the W (and Cu) filter is 0 mm, which means that channel 2 is equivalent to channel 1, and channel 4 is equivalent to channel 3 (cf. ). In other words, the best four-channel combination is equivalent to acquiring data twice using the best two-channel combination. This suggests that including another filter to construct channel 2 and channel 4 does not benefit the detector performance. The best SNR values in (a) and (c) are higher than those in (b) and (d) simply because (a) and (c) have more data (twice the data of (b) and (d)), so the noise is suppressed in the material decomposition process.
Figure 7. SNR results under the test conditions of a 20-cm-thick phantom and 120-kV tube voltage: (a) W–Ag four-channel filter sets, (b) W–Ag two-channel filter sets, (c) Cu–Sn four-channel filter sets, and (d) Cu–Sn two-channel filter sets. The labeled values are the maximum SNR values and their corresponding filter thickness. In (c) and (d), another local maximum is expected to exist while the thickness of Cu filter is more than 1 mm, but it is ignored because a filter thicker than 1 mm would not be appropriate for the transXend detector.
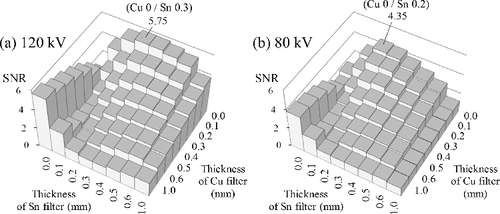
shows the results of the Cu–Sn two-channel systems for a smaller object (4.5-cm-thick PMMA and 0.5-cm-thick iodine tincture) under tube voltages of 120 and 80 kV. The results indicate that given different test conditions, the results may slightly change. The trends of the results are similar to that in (d), but the maximum SNR occurs at a smaller Sn filter thickness: 0.3 and 0.2 mm in (a,b), respectively. The Cu–Sn four-channel, W–Ag two-channel, and W–Ag four-channel systems also showed similar changes (i.e. the maximum SNR shifts to a smaller filter thickness), so we omit their results.
4. CT imaging experiments
To verify the calculation results, we performed experiments with a PMMA cylindrical phantom with a diameter of 3 cm and height of 6 cm containing a central cylindrical region with a diameter of 1 cm filled with iodine tincture (concentration of iodine: 22.65 mg/cm3). Because of the equipment limitation in our laboratory, we were not able to use a medical X-ray tube for imaging. The X-ray tube used was an industrial X-ray generator (ERESCO 42 MF4®, General Electric Co., Ahrensburg, Germany) operated at a tube voltage of 115 kV and tube current of 2.2 mA. The X-ray tube had a W target (target angle: 20°), an inherent filtration of 0.8-mm-thick Be, and an added filter of 2-mm-thick Al. The image detector was a GOS-scintillator-based FPD (Remote RadEye2®, Teledyne Rad-icon Imaging, Sunnyvale, CA, USA) with 1024 × 1024 pixels. Projection data were 2 × 2 binned into 512 × 512 pixels, and the pixel pitch after binning was 0.096 mm. The source-to-object distance was 80 cm and the source-to-detector distance was 100 cm.
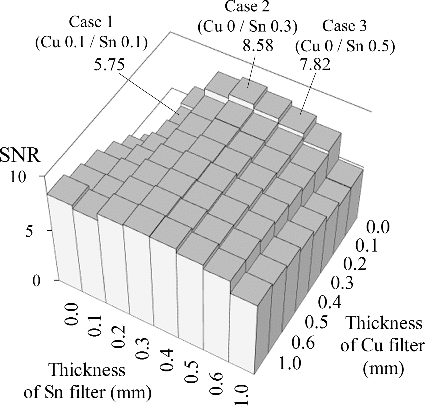
Because the object size, X-ray tube specifications, and tube voltage were different from those of the calculations in Section 3, we performed another calculation based on the experiment conditions; the results are presented in . In the experiments, we used three four-channel filter sets (as labeled in ): (Equation1(1)
(1) ) 0.1-mm-thick Cu/0.1-mm-thick Sn, which is the filter set used in our previous study [Citation8]; (Equation2
(2)
(2) ) no Cu filter/0.3-mm-thick Sn, which is expected to have the best SNR; (Equation3
(3)
(3) ) no Cu filter/0.5-mm-thick Sn as an extra case to check if the trend of experimental results agrees with that of the calculations.
Figure 9. SNR results for the Cu–Sn four-channel filter sets calculated based on the experimental conditions of a 3-cm-thick phantom and 115-kV tube voltage. The three labeled values are the filter sets used in the experiments.
To avoid crosstalk between channels, the filter was placed in front of the output window of the X-ray tube, and the exposure of each channel was performed separately (different from the method in our previous study [Citation8]). Because of the symmetrical structure of the phantom, we did not rotate the phantom during the experiments. For each channel of each filter set, 200 projections were acquired. Each acquired projection was a 2D image, and we extracted one row of pixel values that were 3 cm above the bottom of the phantom (i.e. the extracted row was at the center of the cylindrical phantom) for material decomposition analysis.
The material decomposition analysis was performed using the method described in Section 2.4. For each channel in the lookup table, a linear calibration function (i.e. a magnification factor and offset factor) was applied to let the lookup table agree with the experiments. The measured projection data were then decomposed into density–length products of PMMA and iodine and reconstructed into CT images using a maximum likelihood expectation maximization algorithm [Citation20].
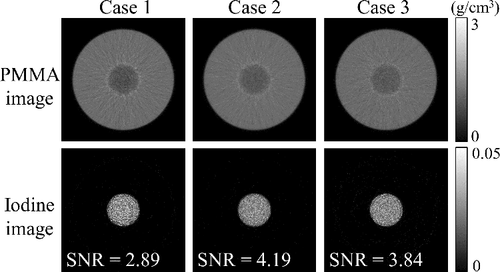
The reconstructed images are shown in . For each iodine image, we assigned a circular region of interest (ROI, 0.76-mm diameter) in the iodine region, and calculated the SNR of pixel values in the ROI. The results show good agreement with the calculation results in ; both Case 2 and Case 3 have better SNRs compared with that of Case 1, and the SNR of Case 2 is better than that of Case 3 (see ).
Figure 10. Images reconstructed from the material decomposition results. Upper row: PMMA density images. Bottom row: iodine density images. The SNR values were calculated from a 0.76-mm-diameter ROI inside each iodine region. The unit of image values is g/cm3 because the images are reconstructed tomographic images instead of projection data (cf. the unit in ).
5. Discussion
As described in Section 2.1, the W filter is expected to be suitable for low-energy channels because its K-edge can strongly attenuate high-energy photons. However, according to the results in , using a W-filtered low-energy channel does not provide a better SNR than using an unfiltered channel. An unfiltered channel seems to be the best choice for the low-energy channel, but it has a disadvantage: the response of an unfiltered low-energy channel may be much higher than that of the filtered high-energy channel, which makes the unfiltered channel unsuitable for imaging situations that require a wide dynamic range. For the W–Ag two-channel system in (b), the best SNR occurs using the combination of W 0 mm and Ag 0.4 mm. For this combination, the response of the unfiltered channel is four times as high as that of the Ag-filtered channel (not shown in the figure). That is, the response ratio of the high-response (low-energy) channel to the low-response (high-energy) channel is 4.0, and the available dynamic range will be decreased to one-fourth because the high-response channel will be saturated while the output of the low-response channel is still at 25% of the dynamic range of the base FPD. If a wider dynamic range is required, the response ratio between the channels must be constrained by decreasing the filter thickness of the high-energy channel or adding a filter to the low-energy channel. As an example, the following four combinations can constrain the response ratio to 1.5: (Equation1(1)
(1) ) W 0 mm/Ag 0.093 mm, (Equation2
(2)
(2) ) W 0.037 mm/Ag 0.2 mm, (Equation3
(3)
(3) ) W 0.068 mm/Ag 0.3 mm, and (Equation4
(4)
(4) ) W 0.099 mm/Ag 0.4 mm. The SNRs of (ρl)I of these combinations were calculated and are given in . The SNR of combination (Equation3
(3)
(3) ) is higher than that of combination (Equation1
(1)
(1) ). This suggests that using an appropriate W filter may provide a better result than an unfiltered channel if the requirement of dynamic range is constrained.
Table 2. Filter thickness and calculated SNR values of four W–Ag filter combinations with a response ratio of 1.5
In our previous study [Citation8], the filters were attached at the front surface of the FPD. Based on this design, we performed calculations at a fixed tube current in this study so that the absorbed dose of the object (patient) would be the same for all cases. If the filters are attached at the output window of the X-ray tube, the patient dose will be lowered because the X-ray beam is attenuated before reaching the patient. In such a case, thicker filters may be favorable to lower patient dose, and a low-energy channel with a K-edge filter may be more attractive than an unfiltered one. Considering practical use, the means to attach filters to an X-ray tube may be a rotating wheel, which replaces the filters automatically.
6. Conclusions
To improve the performance of the filter-type transXend detector, we developed a method to estimate the performance of filter sets by comparing their noise sensitivity. Using this method, one can preliminarily predict the optimal filter set before performing numerous experiments. The results show that the best performance occurs while using a low-energy channel without a filter and a high-energy channel with an Sn (or Ag) filter of appropriate thickness. The appropriate filter thickness was estimated in this study through calculations and is expected to depend on beam quality and object size. We also verified one of the calculation results with an experiment, and the trend of the experimental results agreed well with that of the calculation. Although the calculation results implied that the optimal low-energy channel is an unfiltered channel, if a larger dynamic range is required, a K-edge filter (e.g. W) may be a good candidate for the low-energy channel. It should also be noted that the performance of a filter set is influenced by the response function of the base FPD. If the base FPD is replaced with another one with different noise properties or different energy response (e.g. a cesium iodide scintillator detector or direct-conversion semiconductor detector), the optimal filter set should be re-evaluated.
A remaining issue is the method used to analyze the energy information. As mentioned in Section 2.4, instead of the material decomposition algorithm employed in this study, a spectrum unfolding algorithm can be an alternative choice. The unfolding algorithm estimates the energy distribution of X-rays instead of the material contents in the object. Therefore, the resulting noise sensitivity is possibly different from the results in this paper. This issue should be investigated in further studies.
Acknowledgments
The authors are grateful to the Academic Center for Computing and Media Studies at Kyoto University for the use of their supercomputer.
Disclosure statement
No potential conflict of interest was reported by the authors.
References
- Bushberg JT, Boone JM. The essential physics of medical imaging. 3rd ed. Philadelphia (PA): Lippincott Williams &Wilkins; 2011.
- Hsieh J. Computed tomography. 2nd ed. Bellingham (WA): SPIE Press; 2009.
- Barrett JF, Keat N. Artifacts in CT: recognition and avoidance. Radiographics. 2004;24:1679–1691.
- Schlomka JP, Roessl E, Dorscheid R, et al. Experimental feasibility of multi-energy photon-counting K-edge imaging in pre-clinical computed tomography. Phys Med Biol. 2008;53:4031–4047.
- Iwanczyk JS, Nygård E, Meirav O, et al. Photon counting energy dispersive detector arrays for X-ray imaging. IEEE Trans Nucl Sci. 2009;56:535–542.
- Alvarez RE, Macovski A. Energy-selective reconstructions in X-ray computerized tomography. Phys Med Biol. 1976;21:733–744.
- Coursey CA, Nelson RC, Boll DT, et al. Dual-energy multidetector CT: how does it work,what can it tell us, and when can we use it in abdominopelvic imaging ? Radiographics. 2010;30:1037–1055.
- Kanno I, Yamauchi K, Hamaguchi T. Two-dimensional “transXend” detector with band structure absorbers for third-generation energy-resolved computed tomography with improved spatial resolution. J Nucl Sci Technol. 2017;54:22–29.
- Kalender WA, Klotz E, Kostaridou L. An algorithm for noise suppression in dual energy CT material density images. IEEE Trans Med Imaging. 1988;7:218–224.
- Warp RJ, Dobbins JT. Quantitative evaluation of noise reduction strategies in dual‐energy imaging. Med Phys. 2003;30:190–198.
- Kelcz F, Joseph PM, Hilal SK. Noise considerations in dual energy CT scanning. Med Phys. 1979;6:418–425.
- Hubbell JH, Seltzer SM. Tables of X-ray mass attenuation coefficients and mass energy-absorption coefficients from 1 keV to 20 MeV for elements Z = 1–92 and 48 additional substances of dosimetric interest. Gaithersburg (MD): The National Institute of Standard and Technology; 1995. Available from: http://www.nist.gov/pml/data/xraycoef/index.cfm
- Agostinelli S, Allison J, Amako K, et al. GEANT4 – a simulation toolkit. Nucl Instr Meth Phys Res A. 2003;506:250–303.
- Allison J, Amako K, Apostolakis J, et al. Recent developments in Geant4. Nucl Instr Meth Phys Res A. 2016;835:186–225.
- Birch R, Marshall M. Computation of Bremsstrahlung X-ray spectra and comparison with spectra measured with a Ge(Li) detector. Phys Med Biol. 1979;24:505–517.
- Konstantinidis AC, Szafraniec MB, Speller RD, et al. The Dexela 2923 CMOS X-ray detector: a flat panel detector based on CMOS active pixel sensors for medical imaging applications. Nucl Instr Meth Phys Res A. 2012;689:12–21.
- McElroy W, Berg S, Crockett T, et al. A computer-automated iterative method for neutron flux spectra determination by foil activation. Albuquerque (NM): Air Force Weapons Laboratory; 1967.
- Kanno I, Imamura R, Mikami K, et al. A current mode detector for unfolding X-ray energy distribution. J Nucl Sci Technol. 2008;45:1165–1170.
- Maruyama Y, Hamaguchi T, Tsai T-H, et al. Response function estimation with fine energy bins for the energy-resolved computed tomography using a transXend detector. J Nucl Sci Technol. 2018;55:199–208.
- Shepp LA, Vardi Y. Maximum likelihood reconstruction for emission tomography. IEEE Trans Med Imaging. 1982;1:113–122.

