
 ?Mathematical formulae have been encoded as MathML and are displayed in this HTML version using MathJax in order to improve their display. Uncheck the box to turn MathJax off. This feature requires Javascript. Click on a formula to zoom.
ABSTRACT
Following the Fukushima Daiichi nuclear disaster, a specific activity inspection system is required to ensure that raw wood used for cultivating shiitake (Lentinus edodes) is safe. Although most radioactive materials adhere to tree bark, as of 2016, the current inspection method measures the specific activity of the whole log. To resolve issues with the current inspection method and contribute to the reconstruction of agriculture and forestry in the disaster area, we developed an inspection system to measure the specific activity of the bark without cutting the tree in the forest. The gamma-ray detector used in this system consisted of four radiation detection modules that could enclose the tree. The external surfaces of the four detectors were covered with lead to block background radiation from the environment. Log samples were analyzed by this system and by an HP-Ge semiconductor detector, and the results were compared. A quantification factor was determined to convert the counts measured by this system into the specific activity of the bark. The field test was conducted in the northern parts of Miyagi and Fukushima prefectures. The results confirmed that the system had reasonable measurement accuracy and could determine the direction from which radiocesium had been transported.
1. Introduction
Many industries, including agriculture and forestry, were seriously damaged in areas where radiocesium was deposited following the Fukushima Daiichi nuclear disaster [Citation1]. Radiocesium contamination is a serious problem in Fukushima Prefecture that has impacted food security and safety, with long-term reputational damage. On April 1 2012, the Food Sanitation Law of Japan set a reference value for radiocesium in general foods of 100 Bq/kg [Citation2]. The main food items for which this reference value is typically exceeded are wild vegetables and mushrooms [Citation3–5]. The reason for the high radioactivity levels in these food items is the high radioactive transfer coefficient [Citation6]. In 2010, 3664.8 tons of fresh shiitake mushrooms (Lentinus edodes) were produced in Fukushima Prefecture; 775.1 tons were cultivated using raw wood and 2889.7 tons were cultivated using mushroom beds in hot houses [Citation7,Citation8]. However, the amount of fresh shiitake produced in Fukushima Prefecture in 2014 decreased by 1753.7 tons, with production using raw wood decreasing by 88.2 tons and production using mushroom beds decreasing by 1665.5 tons [Citation7,Citation9]. Because most shiitake cultivation using raw wood ceased following the reactor accident, overall production declined significantly.
Raw wood cultivation is a method for cultivating mushrooms on rotting wood using native raw wood, with mushrooms planted directly onto dead logs after cutting. This method is part of the natural cycle of mountain forests and can be categorized into four types according to how the log is used as a raw material: ʻstump cultivationʼ, which uses a cut stump; ʻlong trunk cultivationʼ, which uses the trunk after the removal of branches; ʻnormal raw wood cultivationʼ, which uses a raw wood size of around 100 cm; and ʻshort raw wood cultivationʼ, which uses a raw wood size of 15–20 cm.
There are different procurement routes for raw wood, with some growers being self-sufficient because they own areas of mountain forest, while others purchase wood from other growers and commercial companies. An analysis of the procurement route of raw wood for the cultivation of shiitake [Citation7,Citation10,Citation11] revealed that Fukushima Prefecture exported 27,212 m3 (about 53.3% of the 51,040 m3 total) of the shiitake raw wood produced in the prefecture. Prior to the Fukushima Daiichi nuclear disaster, Fukushima Prefecture exported more shiitake raw wood than any other prefecture in the country. However, the amount of raw wood exported from the prefecture has subsequently declined from a pre-disaster figure of 37,400 m3 to just 26 m3 in 2014, i.e. only 0.07% of the previous amount.
Since 2011, trees used for mushroom cultivation in areas where radioactive materials were deposited must be inspected to confirm that the specific activity is less than the reference value. The Ministry of Agriculture, Forestry and Fisheries of Japan estimates the transfer factor for fungi to be 2, and has set the reference value to 50 Bq/kg for shiitake raw wood [Citation12]. If the specific activity of trees exceeds this reference value, they cannot be grown or shipped.
Current methods of determining the specific activity of shiitake raw wood involve the use of HP-Ge semiconductor detectors or NaI(Tl) scintillation detectors to analyze sawdust placed in a container designed for inspection [Citation13,Citation14], or the use of a non-destructive inspection system after cutting [Citation15–17]. With these methods, it is necessary to transport cut trees to an inspection station. After processing and treatment of the trees, they cannot be used for mushroom cultivation if their radioactivity levels exceed the reference value. The pre-processing requirement of the inspection system is inefficient, and the systems are also expensive, large and heavy (for example, the system used in Ref. [16] has a width of 2240 mm, depth of 1654 mm, height of 1500 mm, and weighs about 1000 kg). The current inspection method measures the specific activity of the whole tree rather than the bark. This means there is a possibility that the specific activity is underestimated. According to several investigations [Citation18–22] of cut trees divided into core material, sapwood, and bark, radiocesium has been found to be distributed mainly in the bark. Although forests in areas affected by the disaster are still contaminated, there would be great progress in the reconstruction of forestry in these areas if newly grown trees could be used in the forestry industry, including mushroom cultivation. It is therefore necessary to measure the distribution of radioactivity in newly grown trees until they become mature, without cutting them for raw wood production. Furthermore, the ability to judge whether wood can be used for mushroom cultivation by performing measurements onsite, without cutting the wood and bringing it to the inspection station, would be of great value to the forestry industry and others, such as those associated with waste elimination and nature conservation.
Therefore, we developed a compact and inexpensive inspection system that can easily be transported to mountain forests to measure the specific activity of bark without cutting the tree.
2. System
2.1. System concept
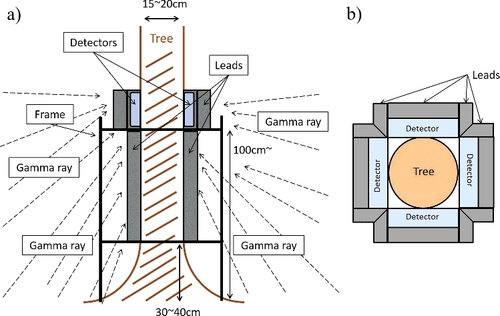
First, we considered the overall concept of a new inspection system. The system had to have a structure that could be adapted to the environment of the mountain forests where the trees grow, and to variation in the size and curvature of trees. A measurement geometry was designed; (a,b) shows the conceptual design of the measurement system. Because trees used for producing mushroom cultivation logs are preferably 15–20 cm in diameter and 1 m in length, the measurement range of the system was set as 15–20 cm. To ensure high-sensitivity measurements, the detectors were designed to be attached directly to standing trees above a certain size, as shown in (b). Because it was also necessary to shield the detector from radiation from the ground during measurements, the tree and detectors were covered by lead plates, as shown in (a). Considering the shielding effect and weight of the system, the best position for the detectors was determined to be about 1 m above ground.
Figure 1. Geometry of the measurement system: (a) side view and (b) top view.
The measurement system was required to be capable of determining contamination in shiitake raw wood at the reference value of 50 Bq/kg. The method of screening for radiocesium in food [Citation23] stipulates that the detection limit should be less than one-quarter of the reference value. Thus, in the case of shiitake raw wood, the measurement system had to be capable of determining levels with a detection limit of 12.5 Bq/kg. This meant that the detector had to be designed with a lead shield to block background radiation from the environment effectively.
Because mountain forests grow on steep slopes, the measurement system had to be easy to break down into its constituent parts so that it could be carried. The processing circuit and wiring equipment had to be compact so that the wiring could be accessed and the disassembled parts easily reassembled.
2.2. Selection of detector
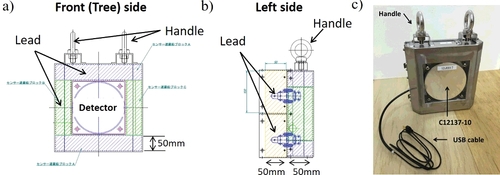
We used four C12137-10 radiation-detection modules (Hamamatsu Photonics K.K., Shizuoka, Japan) containing a CsI (Tl) scintillator, with a size of 110Φ × 25 mm, and a multi-pixel photon counter. The external dimensions of the module were 122 × 122 × 53.3 mm3 ((a)). The energy resolution was about 10% for gamma rays of 662 keV. The processing circuit was immediately behind the detector. The signal from the detector was amplified and shaped, and converted to a digital value by an analog-to-digital converter. Because the digital data were sent to a personal computer via a USB connection, the module was extremely simple and easy to carry. (b) shows the USB connection of the four modules and a laptop. Energy spectra were simultaneously acquired from the four modules and analyzed on the laptop.
Figure 2. (a) Photograph of the C12137-10 radiation detection module [Citation24] and (b) USB connection.
![Figure 2. (a) Photograph of the C12137-10 radiation detection module [Citation24] and (b) USB connection.](/cms/asset/2e6e761b-81f1-40c3-8377-fdb8ea967555/tnst_a_1467286_f0002_oc.jpg)
2.3. Design of the housing and shielding
To shield the system from background radiation, casing and a lead shield were installed. A schematic diagram of the box into which the four modules and lead shield were inserted is shown in (a,b). (a) shows the front side (i.e. the side facing the tree bark). A C12137-10 detector module was inserted into the module box, which was fitted with two handles. Each side (upper, lower (i.e. ground side), right, and left side) of the C12137-10 was surrounded by a 50-mm-thick layer of lead. The left side of the device in (a) is shown in (b). The part with the handle is the module box. Two containers with stoppers, which contained lead plates with dimensions of 200 × 100 × 50 mm3, were mounted on the top and bottom of the module box. A photograph of a manufactured module box is shown in (c). The four module boxes were arranged around a tree, with the geometry shown in . There was an aperture in the side of the module box through which the USB cable was passed to enable data communication.
Figure 3. Layout of the module box: (a) front (tree) side and (b) left side; (c) photograph of the module box.
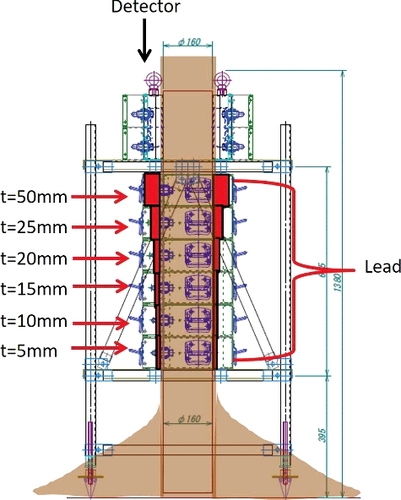
shows the housing of the measurement system. The brown object in the figure is a tree. Four detectors were placed on the top part of the tree. The ‘t’ in is the thickness of each lead shield. Consideration had to be given to balancing the weight saved by the system with the required attenuation length for the radiation to pass through both the lead storage container and the tree; therefore, the lead plates in the storage container had a structure that became thinner with depth, as shown in . The thickness of the lead was determined from the following calculation. Because the total attenuation coefficient of lead for a 0.6 MeV gamma ray [Citation25] is 0.1178 cm2/g and the density of lead is 11.35 g/cm3, the linear attenuation coefficient (µPb) is 0.1178 × 11.35 = 1.33703 cm−1. For 5-cm-thick lead, 0.6 MeV gamma rays are attenuated by about 0.125% because the transmission factor (I(5)/I0) is e−1.33 703×5 = 0.001249 from I(x) = I0 e−µx. Therefore, 5-cm-thick lead plates were used to shield the measurement system and were placed just below the detector. Because gamma rays entered the detector obliquely below the 5-cm lead plate at t = 50 mm (shown in ), the thickness of this lead plate could be reduced. The thickness of the lead plate in was determined with consideration of the following issues.
Figure 4. Side view of the measurement system housing.
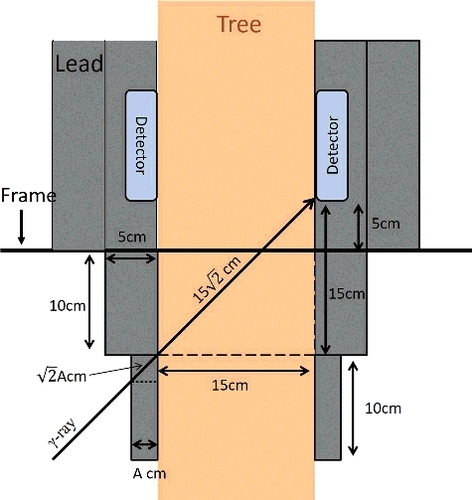
In , one of the shortest flight distances over which gamma rays travel (i.e. the least attenuation) is indicated by the arrow marked ʻγ-rayʼ for simplicity. The diameter of the tree was assumed to be 15 cm. As shown in , if the lead thickness is A [cm], the distance (intersect length) that the arrow marked ʻγ-rayʼ passes through the lead is A [cm]. The intersect length when the gamma ray passes through the tree is
cm, as shown in . The specific density of a tree can be regarded as 1 g/cm3, which is approximately the same as water. Because the total attenuation coefficient [Citation25] of water for a 0.6 MeV gamma ray is 0.08943 cm2/g, its linear attenuation coefficient (µwater) is 0.08943 cm−1. The length connecting the lead and wooden parts of the measurement system, which could attenuate gamma rays by as much as a 5-cm-thick lead plate, was determined from the following equation:
(1)
(1) Using EquationEquation (1)
(1)
(1) ,
(2)
(2) the thickness of the lead plate was calculated as 2.53≅2.5 cm, shown in EquationEquation (2)
(2)
(2) . The same calculation was also used for other lead plates with different thicknesses (e.g. t = 20, 15, 10, and 5 mm).
Figure 5. Calculation used to determine the lead thickness (2.5 cm).
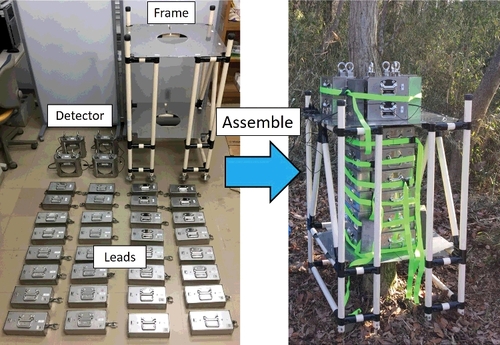
shows a photo of each part of the finished system and an exterior photo of the system after assembly. Although the weight of the whole system was about 300 kg, it could be separated into its constituent parts (several kg to around 10 kg), including a frame, a detector, and a lead storage container that could be carried by hand. The height of each foot of the frame could be adjusted so that measurements could be made on a slope. Using cars and vehicles fitted with caterpillar treads, these parts were transported to the tree to be measured. The frame was assembled to surround the tree. The lead storage containers were assembled in order from the bottom of the tree. Finally, the detectors were mounted to the top of the frame. After checking the position of the lead plates, the detectors were connected to the notebook computer and measurement commenced. A team of four people were needed to complete the measurement in a reasonable time frame (about 10 min). The time from preparation to measurement was about 30 min.
Figure 6. Photograph of the exterior of the measurement system.
3. Quantitative determination
We obtained a quantitative equation for deriving the contamination (Bq/kg) of the bark of the tree from the number of measured counts of the gamma rays. shows the flowchart used for the quantitative determination of contamination. All measurements indicated in the flowchart were made in the laboratory, with no influence from background radioactivity due to radiocesium, at Aobayama campus, Tohoku University, Sendai. For two logs obtained from Miyagi Prefecture, net counts in the region of interest, including the photo peak areas of Cs-137 (662 keV) and Cs-134 (796 keV), were obtained from measurements of 10 min. The measurement time of 10 min was considered practical in view of the measurement accuracy and actual time taken at the site.
Figure 7. Flowchart of the measurement system calibration.
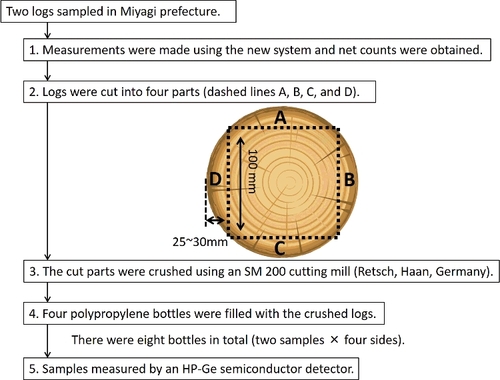
Next, we cut each of the measured logs to a size of 100 mm in length (vertical) × 25–30 mm in thickness (horizontal) × 250 mm in height (depth), i.e. the part facing the four detectors (shown by the dashed lines A, B, C, and D in ). The cut parts of the tree were crushed using an SM 200 cutting mill (Retsch, Haan, Germany) and placed in polypropylene bottles until they were full (5 cm in height). Eight bottles (two samples × four sides) were measured by an HP-Ge semiconductor detector for 36,000 s each (10 h). The specific activity (Bq/kg) of each part, which was a combination of Cs-137 (662 keV) and Cs-134 (796 keV), was calculated from the value measured by the HP-Ge semiconductor detector.
is a graph showing the correlation between the net count obtained by our system and the specific activity of the eight bottles obtained by the HP-Ge semiconductor detector. The horizontal axis indicates the net count, and the vertical axis indicates the specific activity of the eight bottles. The relationships among the cut parts are shown by 1A, 1B, 1C, 1D, 2A, 2B, 2C, and 2D (where 1 denotes the first log to be cut, and 2 the second) in . The error bars are based on the square root of the net count for each detector. According to several investigations [Citation26,Citation27] of the distribution of radiocesium in bark, the distribution has been suggested to be affected by the direction from which the radiocesium was transported. Therefore, eight data points were used for calibration. Although there were slight variations, the value of the correlation coefficient (R) in these data was 0.831. Since R was 0.707 when the sample number was 8 and the significance level was α = 0.05 (two-tailed probability), the eight measurement points had a strong positive correlation. Therefore, the distribution could be approximated to be a straight line passing through the origin. The R2 value and equation of the approximated straight line are given in (R2 = 0.691, y = 0.309x). A quantitative equation for obtaining the specific activity (Bq/kg) of the bark from the net count was obtained as follows:(3)
(3)
Figure 8. Correlations between the results of each sample measured by the C12137-10 radiation detection module and an HP-Ge semiconductor detector.
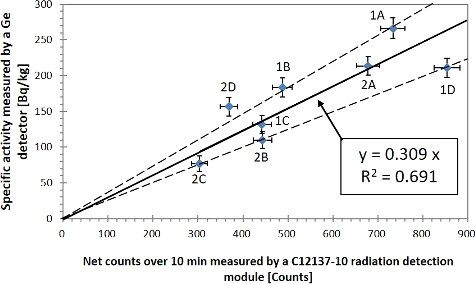
As a result of this regression analysis, the standard deviation (SD) of the slope (0.309) of the quantitative equation was 0.057. Therefore, we considered the error in this conversion as y = (0.309 ± SD) x. The error of the quantitative equation was considered to be about 20%. The equations y = (0.309 + SD) x and y = (0.309 − SD) x are shown in as dashed lines.
4. On-site measurements
On-site measurements were conducted at two locations. The first was an area of mountain forest in the northern part of Miyagi Prefecture. The air dose at the site was around 0.05–0.06 µSv/h (December 2015). The second was an area of mountain forest in the northern part of Fukushima Prefecture. The air dose at the site was around 0.4–0.5 µSv h (December 2015). A photograph of the on-site measurement at the site in Miyagi Prefecture is shown in .
4.1. Northern part of Miyagi Prefecture (0.05–0.06 µSv/h)
In the northern part of Miyagi Prefecture, we first performed a background measurement using the new system. The results showed that radiocesium in the environment was not detected by the four detectors of the system. In the area of this air dose, the effect of radiocesium in the environment on this system was considered small. After that, radiocesium contamination was measured on four oak trees using the new system. The four detectors were positioned in the east, west, north, and south directions at the measurement site. The results are shown in . The specific activity (Bq/kg) in each direction was calculated. The error values in were calculated by taking into account the error of the above quantitative equation and the net count error for each detector. The error values in range from 18% to 22%, which is considered to denote reasonable accuracy. As an example, the energy spectrum of each detector for Tree 1 is shown in .
Table 1. Results of the field measurements in the northern part of Miyagi prefecture
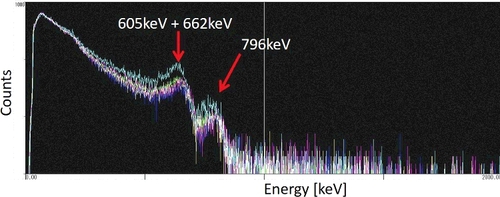
Figure 9. Energy spectra of Tree 1 in the field test in the northern part of Miyagi Prefecture.
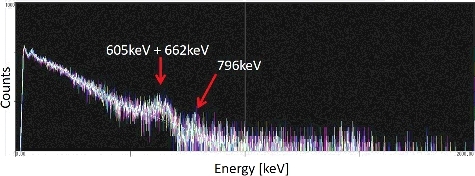
The specific activity of the bark was higher on the east side than on the other sides, for all trees. This suggests that this area was contaminated by radiocesium that was transported by wind from the east. Remarkable levels of contamination were detected on Trees 2 and 3. The new system was also able to detect low levels of contamination and was considered to have reasonable accuracy for the assessment of tree contamination in this area.
4.2. Northern part of Fukushima Prefecture (0.4–0.5 µSv/h)
Because the air dose rate in the northern part of Fukushima Prefecture was relatively high compared to the northern part of Miyagi Prefecture, background measurements (i.e. measurements without surrounding trees) were performed prior to measuring trees. Peaks of 137Cs and 134Cs were clearly observed, as shown in , which is the energy spectrum of each detector.
Figure 10. Energy spectra of the background measurement in the northern part of Fukushima Prefecture.
To subtract this background, the measurements shown in were performed. After measuring contamination on the trees, we reassembled our system near the trees and conducted the measurements again on a square log that was not contaminated with radiocesium. Specifically, the log was used for construction; thus, its density differed from that of the other trees. However, density difference was not taken into consideration in this contamination measurement. In the photograph entitled ʻSignal + BGʼ in , additional lead shielding was placed in gaps between the detectors that were the result of the tree not being straight. The results are shown in . The north side of the trees had a very low specific activity. In contrast, the south, west, and east sides had a high specific activity. Fukushima Daiichi nuclear power plant is located south of this site; thus, the measurements indicated the direction in which radiocesium was transported by the wind. Regarding the error of the result, since both Signal + BG and BG had errors, the estimated error was large when Signal was calculated. Therefore, we could not judge the accuracy of this method by reference to this result.
Figure 11. Schematic view of the background subtraction process.
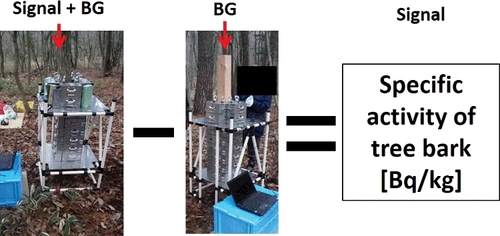
Table 2. Results of the field measurements in the northern part of Fukushima prefecture
To check the accuracy of the subtraction process used to calculate the values in , we measured two logs that were cut at the site and kept in the same location, using the same subtraction process. The length of both logs was about 150 cm. The results are shown on the left side of . The same measurements were conducted in the laboratory (air dose of 0.04–0.05 µSv/h), with no radiocesium background, at Tohoku University. The results are shown on the right side of . Because the two logs were kept in the same location after cutting, and the direction in which they were standing was unknown, we created using the detector ID (i.e. A, B, C, and D). The error rate [%] in was calculated using the results [Bq/kg] obtained in the northern part of Fukushima Prefecture and at Tohoku University.
Table 3. Comparison between the measurements made on each log in the northern part of Fukushima Prefecture and in the laboratory at Tohoku University Aobayama Campus, Sendai
In log 1 of , the values measured in the northern part of Fukushima Prefecture are within the error limits of the values obtained in the laboratory at Tohoku University. The measured values show a maximum uncertainty of 14%. In detector ID: B and C of log 2 of , the values measured in the northern part of Fukushima Prefecture are within the error limits of those measured in the laboratory at Tohoku University. On the other hand, in detector ID: A and D of log 2 of , the measured values are not within the errors of those measured at Tohoku University. The maximum uncertainty is 33%. Because log 2 was bent considerably compared with log 1, an effect of background radiation entering through gaps in the shielding was inferred. We attempted to cover the gaps using additional shielding, but were unable to fill all of them. However, the accuracy of our subtraction method is considered reasonable overall. In the two logs, the specific activity was higher on one of the four sides (log 1 was D, and log 2 was B) than on the others. It is speculated that these sides were both facing south.
5. Discussion and conclusion
We developed an inspection system to measure specific activity on the bark of trees used for the cultivation of shiitake without having to cut the trees in the forest and bring them to an inspection station. After determining the quantification factor used to estimate the specific activity of the bark based on the measured counts, we performed two field tests and evaluated the performance of this system.
The results of the field tests showed that this system has reasonable measurement accuracy for the estimation of specific activity on tree bark, even in high air-dose-rate areas. The system was also able to determine the direction from which the radiocesium had been transported. The detection limit of the system was calculated using the net count rate of each detector, estimated from the quantitative equation shown in and the background count rate (around 1000 counts/600 s on each detector) measured in the laboratory at Tohoku University which there is little influence of background radiation, based on the equation described in Ref. [Citation23]. The detection limit was 43 Bq/kg. Thus, the detection limit of 12.5 Bq/kg, which was the performance target for our system, was not achieved. However, improvement of the shielding and an increase in the measurement time in the area where trees with a specific radioactivity of around 50 Bq/kg are growing should improve the measurement accuracy such that the detection limit target can be achieved.
The number of sample points (eight) used to obtain the quantitative equation was small. To improve the accuracy of the quantitative equation, the number of samples should be increased. Moreover, it will be necessary to verify the accuracy of the system by using a sufficient number of measurement points, and sufficient measuring times, in the areas where trees with a specific radioactivity of 12.5–50 Bq/kg are growing. However, it should be noted that this kind of measurement system, which can be used in forests, was manufactured and tested in this study.
The ability to determine radioactivity levels according to a detection limit of 12.5 Bq/kg would greatly improve the current situation regarding non-destructive inspection of trees. We anticipate that the development of this radiation measurement technology will contribute to the remediation of forestry and agriculture, including mushroom cultivation, in areas contaminated by radiocesium due to the Fukushima Daiichi nuclear disaster.
Acknowledgments
We sincerely thank the staff of the Agriculture, Forestry, and Fishery Departments in Miyagi Prefecture and Fukushima Prefecture for providing us with samples of mushroom logs, and for their support during the on-site measurements. We also sincerely thank Mr Nobuyuki Satoh and Mr Ikuo Wakisaka at Nichiei Industry Co., Ltd. for constructing the housing of our system, and Mr Masayuki Sato and Mr Akira Ujiie at Comet Ltd. for installing the wiring and writing the data acquisition software.
Disclosure statement
No potential conflict of interest was reported by the authors.
References
- Forestry Agency, Ministry of Agriculture, Forestry and Fisheries, Japan. Annual report on forest and forestry in Japan fiscal year 2011. [online] [cited 2018 Feb 6]. Available from: http://www.maff.go.jp/e/data/publish/attach/pdf/index-27.pdf.
- Director-General, Department of Food Safety. Pharmaceutical and Food Safety Bureau, Ministry of Health, Labour and Welfare. Notice no. 0315 article 1 of the department of food safety. 2012 March 15. [online] [cited 2018 Feb 6]. Available from: http://www.mhlw.go.jp/english/topics/2011eq/dl/food-120821_1.pdf
- Hachinohe M, Hamamatsu S, Kawamoto S. Review of the inspection results of FY2011 to FY2013 on radiocesium (134Cs+137Cs) levels in agricultural, livestock, and fishery products, and current studies on radiocesium behavior in the processing and cooking of these products. J Japan Soc Food Sci Technol. 2015;62:1–26. Japanese.
- Orita M, Nakashima K, Hayashida N, et al. Concentrations of radiocesium in local foods collected in Kawauchi Village after the accident at the Fukushima Dai-ichi nuclear power station. Sci. Rep. 2016;6:28470.
- Ishii K. Non-destructive radioactive inspection system for contamination inspection of food products. Isotope News. 2015;729:21–27. Japanese.
- Muramatsu Y, Yoshida S. Mushroom and radiocesium. RADIOISOTOPES. 1997;46:450–463. Japanese.
- The National Statistics Center. Statistical survey of special forestry products. [online] [cited 2018 Feb 6]. Available from: http://www.e-stat.go.jp/SG1/ estat/GL08020101.do?_toGL08020101_&tstatCode= 000001021191&requestSender=dsearch. Japanese.
- The National Statistics Center. Statistical survey of special forestry products, basic data of special forestry products FY 2010, 3, production trends of principal item FY 2010, Shiitake prefectural actual production. [online] [cited 2018 Feb 6]. Available from: http://www.e-stat.go.jp/SG1/estat/GL08020103.do?_to GL08020103_&listID=000001085178&requestSender= dsearch. Japanese.
- The National Statistics Center. Statistical survey of special forestry products, basic data of special forestry products FY 2014, 3, production trends of principal item FY 2014, Shiitake prefectural actual production. [online] [cited 2018 Feb 6]. Available from: http://www.e-stat.go.jp/SG1/estat/ GL08020103.do?_toGL08020103_&listID= 000001149816&requestSender=dsearch. Japanese.
- The National Statistics Center. Statistical survey of special forestry products, basic data of special forestry products FY 2010, 33, procurement route of Shiitake mushroom logs, procurement breakdown from other prefecture. [online] [cited 2018 Feb 6]. Available from: http://www.e-stat.go.jp/SG1/estat/GL08020103. do?_toGL08020103_&listID=000001085178&request Sender=dsearch. Japanese.
- The National Statistics Center. Statistical survey of special forestry products, basic data of special forestry products FY 2014, 33, procurement route of Shiitake mushroom logs, procurement breakdown from other prefecture. [online] [cited 2018 Feb 6]. Available from: http://www.e-stat.go.jp/SG1/estat/ GL08020103.do?_toGL08020103_&listID= 000001149816&requestSender=dsearch. Japanese.
- Forest Agency. Revision of index for mushroom logs and culture medium for mushroom beds. [online] [cited 2018 Feb 6]. Available from: http://www.rinya. maff.go.jp/j/press/tokuyou/pdf/120328_2-01.pdf . Japanese.
- Forest Agency. Development of a guideline for cultivation management of log-cultured mushrooms to reduce radioactive materials. [online] [cited 2018 Feb 6]. Available from: http://www.rinya.maff.go.jp/j/press/ tokuyou/pdf/131016-01.pdf . Japanese.
- Agriculture, Forestry and Fishery Department, Fukushima Prefecture. A revised edition of a manual for safety cultivation mushrooms in Fukushima Prefecture. [online] [cited 2018 Feb 6]. Available from: http://www.pref.fukushima.lg.jp/uploaded/attachment/ 227994.pdf . Japanese.
- Hitachi Zosen Corporation. Delivery of radiocesium screening system for mushroom logs produced in Fukushima Prefecture–consecutive orders to support resumption of shipping and reconstruction of Fukushima brand. [online] [cited 2018 Feb 6]. Available from: http://www.hitachizosen.co.jp/english/ release/2016/03/002115.html
- Furukawa Co., Ltd. Non-destructive radiation measurement system ‘gamma spotter F’ FGSF type -ES. [online] [cited 2018 Feb 6]. Available from: http://www.furukawakk.co.jp/business/others/gammas potterf.html . Japanese.
- Fukushima Prefecture. Implementation of 2nd media tour of FY 2015, a new outgoing project of agricultural products of Fukushima–an approach for production of mushroom and mushroom logs and reconstruction of Fukushima. [online] [cited 2018 Feb 6]. Available from: https://www.atpress.ne.jp/news/84055. Japanese.
- Forestry and Forest Products Research Institute. A project report for stable supply of safe mushroom logs, FY 2011. [online] [cited 2018 Feb 6]. Available from: https://www.ffpri.affrc.go.jp/pubs/various/documents/ kinoko-genboku.pdf. Japanese.
- Forest Agency. Forest, wood and radioactive material–for revitalization of forest and forestry at Fukushima. [online] [cited 2018 Feb 6]. Available from: https://www.ffpri.affrc.go.jp/rad/documents/rad-hukushima.pdf . Japanese.
- Forest Agency. Toward reconstruction and revitalization–current situation of radioactive material and revitalization of forest and forestry. [online] [cited 2018 Feb 6]. Available from: https://www.ffpri.affrc.go.jp/rad/documents/rad-hukushima2015.pdf. Japanese.
- Kuroda K, Kagawa A, Tonosaki M. Radiocesium concentrations in the bark, sapwood and heartwood of three tree species collected at Fukushima forests half a year after the Fukushima Dai-ichi nuclear accident. J Environ Radioact. 2013;122:37–42.
- Ohashi S, Okada N, Tanaka A, et al. Radial and vertical distributions of radiocesium in tree stems of Pinus densiflora and Quercus serrata 1.5 y after the Fukushima nuclear disaster. J Environ Radioact. 2014;134:54–60.
- Japanese Ministry of Health, Labor, and Welfare. Screening method for radiocesium in food products. [online] [cited 2018 Feb 6]. Available from: http://www.mhlw.go.jp/stf/houdou/2r985200000246ev-att/2r985200000246iu.pdf. Japanese.
- Hamamatsu Photonics KK. Radiation detection module C12137-10. [online] [cited 2018 Feb 6]. Available from: https: // www.hamamatsu.com / jp/en/product/ category/3100/4012/4134/C12137-10/index.html
- Japan Radioisotope Association. Radioisotope pocket data book. 10th ed. Maruzen Publishing Co., Ltd; 2001. Japanese.
- Ogawa H, Ito H, Murakami K, et al. The early stage pollution of Japanese cedar (Cryptomeria japonica) by radioactive nuclear from the accident of Tokyo Electric Power Company Fukushima Dai-ichi nuclear power plant. Bull Fukushima Prefectural Forestry Res Centre. 2014;47:49–58. Japanese.
- Yokota K, Ogawa H, Arai S, et al. Safe decontamination of forestry and agricultural wastes including radiocesium. Netsu Sokutei. 2016;43:32–38. Japanese.