
 ?Mathematical formulae have been encoded as MathML and are displayed in this HTML version using MathJax in order to improve their display. Uncheck the box to turn MathJax off. This feature requires Javascript. Click on a formula to zoom.
ABSTRACT
Sample reactivity worth experiments are carried out by substituting aluminum (Al) plates for bismuth (Bi) ones at the Kyoto University Critical Assembly. At the beginning, uncertainty quantification of bismuth isotope is conducted by deterministic calculations with nuclear data library JENDL-4.0, with the use of experimental results of sample reactivity worth. Then, with the combined use of current (Bi) and previous (Pb) experimental results that demonstrate the comparative difference in the sensitivity and uncertainty of Bi and Pb isotopes, experimental results of cross-section uncertainties of Bi isotope are available for examination of neutron characteristics of Pb–Bi coolant material in the accelerator-driven system. From the experimental analyses, further uncertainty analyses by neutron transport calculations are needed for several reactions of Bi isotope, especially with the use of the covariance data of capture, elastic scattering and inelastic scattering reactions in another nuclear data library.
1. Introduction
The accelerator-driven system (ADS) is a potentially promising solution to the achievement of nuclear transmutation of minor actinides and long-lived fission products in a fast neutron spectrum core, and to the use of spallation neutrons generated by the injection of high-energy protons onto a heavy metal target. At the Kyoto University Critical Assembly (KUCA), a feasibility study [Citation1–Citation5] on ADS has been carried out by coupling the solid-moderated and -reflected core, with 100 MeV protons from the fixed-field alternating gradient (FFAG) accelerator. Also, at the VENUS-F facility [Citation6–Citation8] in SCK/CEN, ADS experimental studies have been conducted in a lead (Pb)-reflected core with 14 MeV neutrons for implementation of an experimental facility, such as the Multi-purpose hYbrid Research Reactor for High-tech Applications (MYRRHA) [Citation9].
In upcoming experimental facilities [Citation9,Citation10], liquid lead–bismuth (Pb–Bi) has been selected as not only target material for the generation of spallation neutrons but also coolant material in a fast neutron spectrum core. Before engineering studies on ADS, at the KUCA and the VENUS-F facilities, experimental analyses of reactor physics parameters have been conducted in a subcritical system to establish techniques for accurate measurement of subcriticality and reaction rates, and precise calculation methodologies of ADS kinetic parameters by both stochastic and deterministic approaches. Moreover, sensitivity and uncertainty analyses of reactor physics parameters have been quantitatively evaluated with the use of covariance data of nuclear data libraries, including criticality of actual ADS reactors [Citation11,Citation12], and precision of cross sections of Pb isotopes [Citation13–Citation15].
The main characteristics of coolant material Pb–Bi eutectic (LBE) in ADS are recognized as follows: chemically inactive; high boiling point mechanically; excellent neutron economy caused by large scattering cross sections. From the viewpoint of neutronics, LBE exerts considerable impact on nuclear design parameters for numerical simulations of neutron interactions of Pb and Bi isotopes. To validate their cross sections, uncertainty of Pb isotopes has been analyzed with the use of experimental data obtained at the KUCA facility [Citation13,Citation14] and at the National Criticality Experiments Research Center (NCERC) in the Nevada National Security site [Citation15]. In experimental studies at KUCA and NCERC, Pb sample reactivity worth has been measured with the combined use of Pb and highly-enriched uranium (HEU) plates. Furthermore, numerical simulations have been conducted through both stochastic and deterministic approaches with nuclear data libraries of JENDL-4.0 [Citation16] and ENDF/B-VII.1 [Citation17], in order to examine the uncertainty of criticality induced by the cross sections of Pb isotopes. In a subsequent study on Pb–Bi cross-section uncertainty, the first attempt was made of experimental analyses of the quantification of Bi isotope cross-section uncertainty by conducting Bi sample reactivity worth experiments in a critical state at KUCA, with the consideration of neutron spectrum in the actual ADS core [Citation10], as shown in Figure S1. As in, and with the use of the results of, previous Pb sample reactivity worth experiments, reference samples (aluminum: Al) were substituted for test ones (Bi), and current Bi sample reactivity worth was abundantly obtained to qualitatively interpret the Pb–Bi neutron characteristics.
The main objective of this study was to examine the neutron characteristics of Pb–Bi coolant material in ADS, through experimental studies on uncertainty of criticality induced by the JENDL-4.0 covariance data of Bi isotope cross sections and comparative studies on Bi and Pb sample reactivity worth. The details of sample reactivity worth experiments and evaluation methods are described in Section 2. The results of numerical analyses by the stochastic and deterministic calculations with JENDL-4.0 are presented in Section 3, the comparative study on Bi and Pb sample reactivity worth is detailed in Section 4, and the conclusions are summarized in Section 5.
2. Sample reactivity worth experiments
2.1. Core configuration
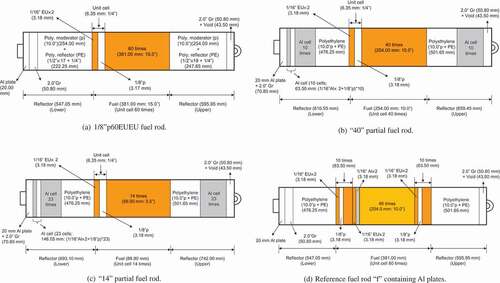
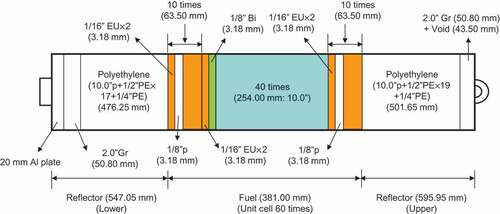
KUCA has three cores designated A, B and C: A and B are polyethylene solid-moderated and -reflected cores, and C is a light water-moderated and -reflected one. The three cores are operated at a zero power in the normal operating state. Sample reactivity worth experiments were carried out in the A-core (), which has polyethylene moderator and reflector rods (Tables S1 and S2, respectively), and four different fuel assemblies, including HEU, polyethylene moderator (p), polyethylene reflector (PE), graphite (Gr) and Al plate: normal ‘F,’ partials ‘40’ and ‘14,’ and test ‘f’ (, respectively). Normal fuel assembly ‘F’ is composed of 60 unit cells, and upper and lower polyethylene blocks about 600 and 550 mm long, respectively, in an Al sheath (54 × 54 × 1520 mm; Table S3). For the normal and partial fuel assemblies, a unit cell in the fuel region is composed of two HEU (Table S4) fuel plates 2 × 2 in square and 1/8 in (3.18 mm; 1/16 in× 2) thick, polyethylene plates 2 × 2 in square and 1/8 in thick. Numerals of 40 and 14 correspond to the number of unit cells in the partial fuel assemblies used for reaching the criticality mass. The test (reference) fuel assembly ‘f’ is composed of 40 unit cells with two HEU fuel plates 1/8 in (1/16 in× 2) thick and two Al plates 2 × 2 in square and 1/8 in (1/16 in× 2) thick, 20 unit cells of HEU and polyethylene plates as in the normal fuel assembly ().
Figure 1. Top view of the KUCA A-core in Bi sample reactivity worth experiments (Reference core).
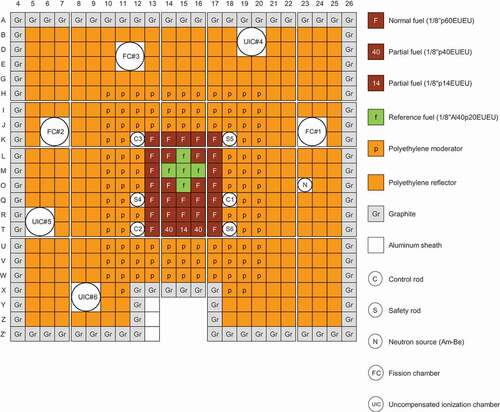
Figure 2. Schematic drawing of fuel assemblies () in the A-core. (a). 1/8”p60EUEU fuel rod; (b). ‘40’ partial fuel rod; (c). ‘14’ partial fuel rod; and (d). Reference fuel rod ‘f’ containing Al plates.
2.2. Experimental settings
Sample reactivity worth was measured by substituting Al plates for Bi ones (Table S5) in the test fuel region at the critical state. In the test fuel region, five test fuel assemblies were set around the center of the core (14, M), (15, L), (15, M), (15, O) and (16, M), as shown in . The sample reactivity worth experiments ranged between three and five fuel assemblies, as shown in , by substituting the reference fuel rods for Bi fuel ones. The substitution was made for a total of 40 unit cells in the central region of the core, by changing Al plates in ) for Bi ones in . The sample reactivity worth induced by the substitution was experimentally obtained through the difference between the excess reactivities of the Al reference core () and the Bi test core (). The critical state was adjusted by maintaining control rods (C1, C2 and C3: Table S6; ) at the certain positions shown in ; excess reactivity was then deduced from the difference between the critical and super-critical states in the core. The experimental excess reactivity was obtained by combining the reactivity worth of each control rod evaluated by the rod drop method with its integral calibration curve by the positive period method. The experimental error of excess reactivity measurement was estimated at less than 3%, demonstrating a statistical error obtained by the measurements several times.
Table 1. Control rod positions at the critical state in reference (Al) and test (Bi) cores shown in and , respectively
Figure 3. Patterns of Bi sample reactivity worth experiments (b: test fuel rod; ). (a) Case 1; (b) Case 2; (c) Case 3; and (d) Case 4.
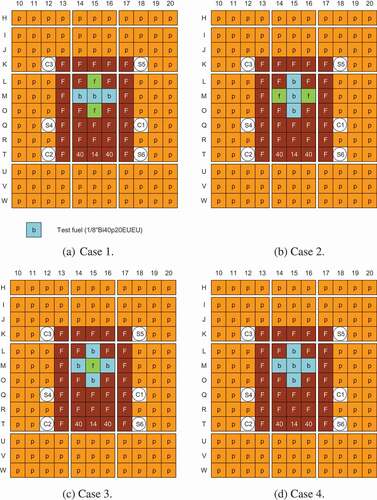
Figure 4. Schematic drawing of test fuel rod containing Bi.
2.3. Evaluation method
2.3.1. Criticality bias
The experimental sample reactivity worth was deduced from the difference between two excess reactivities
and
obtained by the positive period method in the reference and test cores, respectively, when the Al plates were substituted for the Bi ones, as follows:
where and
indicate the effective multiplication factors deduced by the experimental excess reactivities obtained in super-critical cores (clean core) before (Al) and after (Bi) substituting Al plates for Bi ones, respectively, when all the control and safety rods were withdrawn.
In MCNP [Citation18] analyses, numerical sample reactivity worth was deduced from the difference between two excess reactivities
and
in the reference and test cores, respectively, by the same method as that of the experimental sample reactivity worth, as follows:
where and
indicate the effective multiplication factors in super-critical cores before and after substituting Al plates for Bi ones, respectively. Here,
and
are requisite for defining the values of effective multiplication factors in critical cores before and after substituting Al plates for Bi ones, since these numerical values are not always units.
On the basis of the experimental methodology shown in EquationEquation (1)(1)
(1) , where Al plates were substituted for Bi ones, a numerical approach of sample reactivity worth
can be generally expressed as follows:
where and
indicate the effective multiplication factors in super-critical cores.
Numerical sample reactivity worth in EquationEquation (2)
(2)
(2) can be rewritten with the use of the concept of EquationEquation (3)
(3)
(3) , as follows:
where indicates the difference between inverse values of eigenvalue calculations in the two critical states evaluated by MCNP6.1. Here, the first term in EquationEquation (4)
(4)
(4) is defined as ‘criticality bias’ [Citation13] as follows:
2.3.2. Sensitivity coefficient
Sensitivity coefficient S of the integral reactor physics parameter (effective multiplication factor) R is defined by the ratio of the rate of change in R and a certain parameter x as follows:
The effective multiplication factor keff is expressed by neutron balance equation as follows:
where A and F indicate operators of transport and fission terms, respectively, and ϕ the forward neutron flux. Multiplying EquationEquation (7)(7)
(7) by adjoint neutron flux ϕ* and integrating over whole volume and energy, the following equation is obtained:
where brackets < > indicate integration over the whole volume and energy.
With the use of an operator B, EquationEquation (7)(7)
(7) is expressed as follows:
Considering the theoretical background [Citation19] and using adjoint neutron flux ϕ *, the sensitivity coefficient in EquationEquation (6)(6)
(6) is finally expressed by applying the first-order perturbation approximation [Citation20], as follows:
Finally, in a previous Pb study [Citation14], sensitivity analyses of keff were conducted by the SAGEP code [Citation21].
2.3.3. Uncertainty
For the cross-section uncertainty analyses of nuclear data [Citation22], the uncertainty of reactor physics parameter ν is expressed as follows:
where Gtar (1 × p) indicates the sensitivity vector of reactor physics parameters, M (p × p) the covariance matrix of nuclear reaction parameters, si the sensitivity coefficient, the covariance,
the factor of uncertainty and p the number of nuclear reactions including the nuclides. Thus, the contribution of uncertainty ui in each nuclear reaction is defined as follows:
Generally, since sensitivity coefficient si and covariance ci, j are dominant in the energy group, the factor of uncertainty is finally expressed with the use of the maximum number of energy group G as follows:
where g and g’ indicate the energy groups.
3. Numerical analyses
3.1. Eigenvalue calculations
Numerical analyses were conducted with the use of the Monte Carlo code MCNP6.1 together with the JENDL-4.0 nuclear data library for transport. For actual experimental analyses, the capability of eigenvalue calculations by MCNP6.1 was useful in the discussion with the use of JENDL-4.0 for processing important data analyses, and JENDL-4.0 has already been compared with other nuclear data libraries in a previous study [Citation13], while demonstrating a reference library. Notably, the numerical analyses system was the mostly same as previous study in Ref [Citation14].
In the reference core shown in , criticality was reached by adjusting the position of control rod C2 and withdrawing control rods C1 and C3, and safety rods S4, S5 and S6 from the core; excess reactivity was then deduced from the combined use of control rod worth of C2 by the rod drop method and its calibration curve by the positive period method. The measured excess reactivity was attained within an uncertainty of 3%, and compared with the numerical one as shown in . Here, effective delayed neutron fraction (βeff) was attained by MCNP6.1 with JENDL-4.0 in both reference (Al: 798 ± 3 pcm) and test (Bi: 801 ± 3 pcm) cores. Since two values were almost same within statistical errors, the βeff in reference core was used, when converting measured values in dollar units into ones in pcm units. The numerical excess reactivity was obtained by the MCNP6.1 eigenvalue calculations with JENDL-4.0 within a statistical error of 6 pcm through 2,000 active cycles of 25,000 histories. By comparing the measured and calculated results shown in , the C/E (calculation/experiment) value revealed good agreement within a relative difference of 4%, except in Case 1.
Table 2. Comparison between the results of measured and calculated (EquationEquation (2)(2)
(2) ; MCNP6.1) excess reactivities in reference (Al) and test (Bi) cores shown in and , respectively
Furthermore, the measured control rod worth in the reference core was compared with the calculated one by the same method used for excess reactivity, as shown in . As shown in and , the MCNP eigenvalue calculations with JENDL-4.0 revealed accurate reproduction of the experimental results of excess reactivity and control rod worth, respectively, with the C/E values within 6%, ranging widely between 87 and 945 pcm.
Table 3. Comparison between the results of measured and calculated (MCNP6.1) control rod worth in reference core (Al reference core) shown in
3.2. Criticality bias
As discussed in Section 3.1, the accuracy of MCNP6.1 calculations was confirmed in terms of the general definition of sample reactivity worth by the MCNP approach. Here, the actual objective of this subsection was to compare the difference between experimental and numerical sample reactivity worth defined in EquationEquations (1)(1)
(1) and (Equation2
(2)
(2) ), respectively, and to confirm the precision of MCNP calculations of the Bi sample reactivity worth experiments.
Special mention is made of the accuracy of numerical results by MCNP, especially of the absolute values shown in , and additional investigation was requisite to find the reason for the discrepancy between the results of experiments and calculations in EquationEquation (4)(4)
(4) shown in . Then, as suggested in Ref [Citation13], ‘criticality bias’ of sample reactivity worth was useful in the investigation of the discrepancy, when a formulation of sample reactivity worth by MCNP6.1 defined in EquationEquation (2)
(2)
(2) is changed into that by EquationEquation (4)
(4)
(4) . The criticality bias
defined in EquationEquation (5)
(5)
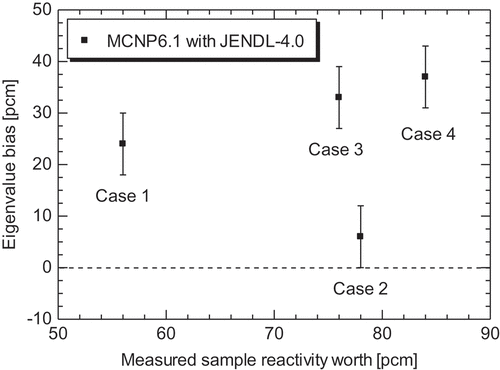
(5) was around 30 pcm, as shown in and . From these results, the criticality bias of 37 pcm at most was confirmed as being included in the sample reactivity worth about 80 pcm, even in the analyses of MCNP calculations, although the absolute value of sample reactivity worth was small.
Table 4. Comparison of measured and calculated Bi sample reactivity worth in EquationEquations (1)(1)
(1) and (Equation4
(4)
(4) ), respectively, and criticality bias in EquationEquation (5)
(5)
(5)
Figure 5. Comparison between the values of criticality bias at critical state evaluated by EquationEquation (5)(5)
(5) .
3.3. Sensitivity
Sensitivity coefficients of keff (Case 4) in EquationEquation (10)(10)
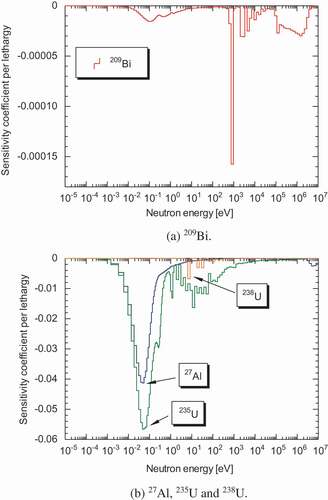
(10) were analyzed by the SAGEP code, for cross-section data of inelastic scattering, elastic scattering and capture reactions in Bi isotope (209Bi) shown in –, respectively, compared as 27Al, 235U and 238U that are mainly core components. The sensitivity coefficients of inelastic scattering reactions ()) of 209Bi were found to be dominant over the high-energy (MeV) region, like those of 27Al shown in ). The sensitivity coefficients of 209Bi elastic scattering reactions revealed an increasing tendency between epi-thermal and fast neutron energy regions shown in ), although the coefficients of 209Bi and 27Al were compared with the mostly same distribution around 1 MeV of the elastic scattering reactions (, respectively). For the sensitivity coefficients of capture reactions, 209Bi was found at a highly-negative peak around 103 eV regions shown in ), whereas 27Al and 235U showed a locally strong depression around the thermal neutron region, as shown in ). Nonetheless, from all the results of sensitivity coefficients, absolute values of 209Bi were markedly very small in vertical axes shown in –8 as compared with the values of 27Al and 235U, demonstrating that the impact of 209Bi cross sections was considered minor in the sensitivity coefficient analyses of keff in the Bi sample reactivity worth experiments at KUCA.
Figure 6. Sensitivity coefficients of inelastic scattering reactions of 209Bi and 27Al in JENDL-4.0. (a) 209Bi and (b)27Al.
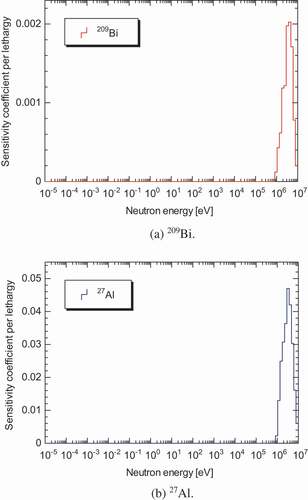
Figure 7. Sensitivity coefficients of elastic scattering reactions of 209Bi and 27Al in JENDL-4.0. (a) 209Bi and (b)27Al.
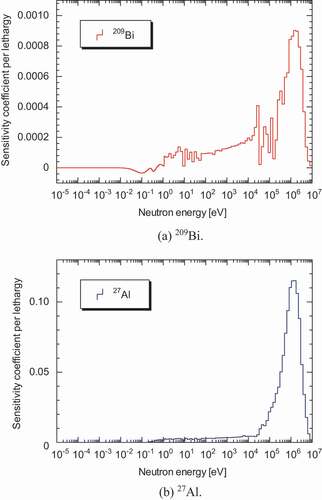
Figure 8. Sensitivity coefficients of capture reactions of 209Bi, 27Al, 235U and 238U in JENDL-4.0. (a) 209Bi and (b) 27Al, 235U and 238U.
3.4. Uncertainty
Uncertainty analyses by the UNCERTAINTY [Citation23] code of the MARBLE system [Citation24] were conducted with the use of JENDL-4.0 covariance data (107-energy-group). Since the covariance data of H, C and Al nuclides consisted mainly of core components are not provided in JENDL-4.0, the uncertainty was analyzed for several reactions of 209Bi, 235U and 238U, including capture, elastic scattering, inelastic scattering, fission and (n, 2n) reactions, comprising reference and test fuel assemblies of the KUCA A-core. Nonetheless, among the covariance data of 209Bi, inelastic scattering reactions were only prepared in JENDL-4.0. As shown in , the results of uncertainty induced by covariance data were large, with total reactivity of 24.4 pcm, compared with the experimental error around 3 pcm of sample reactivity worth (). The value of total uncertainty was acquired by the square root of the sum of squares of reaction-wise contributions, disregarding the covariance between different nuclides in the sum of squares. Among the nuclides, the reaction-wise contribution was dominant mainly over the capture (19.4 pcm) and fission (9.7 pcm) reactions of 235U, and reasonable in the inelastic scattering reactions (10.0 pcm) of 209Bi. In other words, non-negligible contribution of 209Bi inelastic scattering reactions was observed in the uncertainty analyses of Bi sample reactivity worth.
Table 5. Reaction-wise contribution [pcm] to changes in Bi sample reactivity worth (Case 4) induced by covariance data of JENDL-4.0
4. Comparative study on Bi and Pb
Bi sample reactivity worth experiments were considered successfully carried out from the viewpoint of the reproducibility of previous Pb sample reactivity worth experiments, since the measured excess reactivity of the Al reference core was compared with the Bi and Pb experiments under the same condition, as shown in . With the combined use of experimental and numerical results, a comparative study on Bi and Pb sample reactivity worth was instrumental in examining the neutron characteristics of Pb–Bi coolant material in the actual ADS experimental facility.
Table 6. Comparison of the results of measured excess reactivities between Bi and Pb test cores
In terms of the absolute values of sample reactivity worth shown in , the difference between Bi and Pb sample reactivity worth clearly emphasized the significance of the characteristics of the actual ADS facility attributed to the reactivity effect. Interestingly, on the basis of the neutron characteristics of Pb–Bi, an ADS with a Pb–Bi coolant core could exactly be analyzed by nuclear design calculations. Additionally, from the results of the uncertainty of Bi and Pb isotopes shown in , the impact of Bi induced by nuclear covariance data was considered small compared with that of total contribution of Pb isotopes, and invaluable in understanding the reason for choosing Pb–Bi as coolant material in ADS.
Table 7. Comparison of reaction-wise contributions [pcm] between Bi and Pb (Ref [Citation14].) sample reactivity worth (Case 4) induced by covariance data of JENDL-4.0
5. Conclusions
The Bi sample reactivity worth experiments were carried out at KUCA, and the uncertainties of criticality induced by the covariance data of Bi isotope were obtained by numerical calculations. The comparison between the experiments and the calculations by MCNP6.1 with JENDL-4.0 revealed the importance of the effect of criticality bias on the precision of numerical simulations. Additionally, sensitivity coefficients of the Bi isotope were relatively small with the comparison of 27Al, 235U and 238U comprising of fuel plates and core components, and uncertainty induced by its cross sections demonstrated a reasonable result of the Bi sample reactivity worth. From the results of Bi isotope uncertainty, the comparative study on Bi and Pb sample reactivity worth was instrumental in emphasizing the neutron characteristics and the impact of Pb–Bi coolant material in ADS.
Finally, further uncertainty analyses by neutron transport calculations are needed in several reactions of the Bi isotope, especially with the use of the covariance data of capture, elastic scattering and inelastic scattering reactions in another nuclear data library. Thus, precise uncertainty analyses are expected to help in understanding of the neutronics of Pb–Bi coolant material for ADS in nuclear design calculations.
Supplemental Material
Download MS Word (51.5 KB)Acknowledgments
This study was supported by “Research and Development for Engineering Resolution of Nuclear Transmutation Cycle by Accelerator-Driven System” (131101) carried out under the Innovative Nuclear Research and Development Program by the Ministry of Education, Culture, Sports, Science and Technology of Japan. The authors are grateful to all the technical staff at KUCA for their assistance during the experiments.
Disclosure statement
No potential conflict of interest was reported by the authors.
Supplementary material
Supplemental data can be accessed here.
Additional information
Funding
Related Research Data
References
- Pyeon CH, Misawa T, Lim JY, et al. First injection of spallation neutrons generated by high-energy protons into the Kyoto University Critical Assembly. J Nucl Sci Technol. 2009;46:1091–1093.
- Pyeon CH, Nakano H, Yamanaka M, et al. Neutron characteristics of solid targets in accelerator-driven system with 100 MeV protons at Kyoto University Critical Assembly. Nucl Technol. 2015;192:181–190.
- Yamanaka M, Pyeon CH, Kim SH, et al. Effective delayed neutron fraction in accelerator-driven system experiments with 100 MeV protons at Kyoto University Critical Assembly. J Nucl Sci Technol. 2017;54:293–300.
- Pyeon CH, Yamanaka M, Endo T, et al. Experimental benchmarks on kinetic parameters in accelerator-driven system with 100 MeV protons at Kyoto University Critical Assembly. Ann Nucl Energy. 2017;105:346–354.
- Pyeon CH, Vu TM, Yamanaka M, et al. Reaction rate analyses of accelerator-driven system experiments with 100 MeV protons at Kyoto University Critical Assembly. J Nucl Sci Technol. 2018;55:190–198.
- Uyttenhove W, Baeten P, van den Eynde G, et al. The neutronic design of a critical lead reflected zero-power reference core for on-line subcriticality measurements in accelerator drive systems. Ann Nucl Energy. 2011;38:1519–1526.
- Uyttenhove W, Lathouwers D, Kollesterman JL, et al. Methodology for modal analysis at pulsed neutron source experiments in accelerator-driven systems. Ann Nucl Energy. 2014;72:286–297.
- Lecouey JL, Marie N, Ban G, et al. Estimate of the reactivity of the VENUS-F subcritical configuration using a Monte Carlo MSM method. Ann Nucl Energy. 2015;83:65–75.
- Abderrahim HA, Myrrha: DP. A European experimental ADS for R&D applications status at mid-2005 and prospective towards implementation. J Nucl Sci Technol. 2007;44:491–498.
- Tsujimoto K, Sasa T, Nishihara K, et al. Neutronics design for lead-bismuth cooled accelerator-driven system for transmutation of minor actinide. J Nucl Sci Technol. 2004;41:21–36.
- Iwamoto H, Nishihara K, Sugawara T, et al. Sensitivity and uncertainty analysis for an accelerator-driven system with JENDL-4.0. J Nucl Sci Technol. 2013;50:856–862.
- Romojaro P, Alvarez-Velarde F, Kodeli I, et al. Nuclear data sensitivity and uncertainty analysis of effective neutron multiplication factor in various MYRRHA core configurations. Ann Nucl Energy. 2017;101:330–338.
- Pyeon CH, Fujimoto A, Sugawara T, et al. Validation of Pb nuclear data by Monte Carlo analyses of sample reactivity experiments at Kyoto University Critical Assembly. J Nucl Sci Technol. 2016;53:602–612.
- Pyeon CH, Fujimoto A, Sugawara T, et al. Sensitivity and uncertainty analyses of lead sample reactivity experiments at Kyoto University Critical Assembly. Nucl Sci Eng. 2017;185:460–472.
- Fukushima M, Goda J, Bounds J, et al. Lead void reactivity worth in two critical assembly core with differing uranium enrichments. Nucl Sci Eng. 2018;189:93–99.
- Shibata K, Iwamoto O, Nakagawa T, et al. JENDL-4.0: a new library for nuclear science and technology. J Nucl Sci Technol. 2011;48:1–30.
- Chadwick MB, Herman M, Obložinsky P, et al. ENDF/B-VII.1 nuclear data for science and technology: cross sections, covariances, fission product yields and decay data. Nucl Data Sheets. 2011;112:2887–2996.
- Goorley JT, James MR, Booth TE, et al. Initial MCNP6 release overview - MCNP6 version 1.0. 2013. (LA-UR-13-22934).
- Kobayashi K. Reactor physics. Tokyo, Japan: Corona Publishing Co. Ltd.; 1996. (in Japanese).
- Cacuci DG. On the neutron kinetics and control of accelerator-driven systems. Nucl Sci Eng. 2004;148:55–66.
- Hara A, Takeda T, Kikuchi Y. SAGEP: two-dimensional sensitivity analysis code based on generalized perturbation theory. 1984. (JAERI-M 84-027).
- Broadhead BL, Rearden BT, Hopper CM, et al. Sensitivity- and uncertainty-based criticality safety validation techniques. Nucl Sci Eng. 2004;146:340–366.
- Hazama T, Chiba G, Sugino K, et al. Development of fine and ultra-fine group cell calculation code SLAROM-UF for fast reactor analysis. J Nucl Sci Technol. 2006;43:908–918.
- Yokoyama K, Hazama T, Numata K, et al. Development of comprehensive and versatile framework for reactor analysis, MARBLE. Ann Nucl Energy. 2014;66:51–60.