
 ?Mathematical formulae have been encoded as MathML and are displayed in this HTML version using MathJax in order to improve their display. Uncheck the box to turn MathJax off. This feature requires Javascript. Click on a formula to zoom.
ABSTRACT
For radiation protection in high-energy accelerator facilities, internal dose coefficients of short-lived radionuclides were estimated using the dosimetric methodology in accordance with the International Commission on Radiological Protection (ICRP) 2007 Recommendations. A computational program was developed for estimating the dose coefficients. The program was verified by confirming whether it could reproduce the dose coefficients provided by ICRP for intakes of representative radionuclides. In addition, the estimated dose coefficients of short-lived radionuclides were compared to the values generated by Dose and risk CALculation software (DCAL), which is based on a dosimetric methodology that is in accordance with the ICRP 1990 Recommendations, to discuss the reasons why the dose coefficients were changed by the revision of the dosimetric methodologies. The comparison revealed a decreasing trend of dose coefficients in the case of inhalation upon revision of the dosimetric methodologies. By contrast, in the case of ingestion, the dose coefficients tended to increase.
1. Introduction
At high-energy accelerator facilities, various radionuclides are generated as byproducts of nuclear reactions of primary and secondary particles with a variety of materials such as targets, beam dumps, shields, and ambient air. Because these radionuclides are potential sources of radiation exposure to workers in the event of an accident, it is important to assess exposure doses prospectively for radiation protection. For internal dose estimation, the International Commission on Radiological Protection (ICRP) has developed dose coefficients for radionuclide intake by workers and members of the public [Citation1,Citation2] based on the 1990 Recommendations of ICRP [Citation3]. Two types of dose coefficients, namely, e(τ) (Sv Bq−1) and hT(τ) (Sv Bq−1), are defined as a committed effective dose E(τ) (Sv) and a committed equivalent dose for tissue T HT(τ) (Sv) per unit intake of radioactivity, respectively. The symbol ‘τ’ denotes the committed period. For workers, τ is generally set to 50 years. Internal doses can be obtained as the product of the corresponding dose coefficients and estimated radioactivity intake. However, the dose coefficients of short-livedFootnote1 radionuclides with half-lives shorter than 10 min are not provided, even though a few such short-lived radionuclides are expected to be produced [Citation4–Citation6]. At Japan Proton Accelerator Research Complex, for example, the dose coefficients of short-lived radionuclides were estimated [Citation4] by acquiring nuclear decay data of the aforementioned radionuclides [Citation7,Citation8]. ICRP has been developing revised dose coefficients for workers in accordance with the 2007 Recommendations of ICRP as a series of publications called ‘Occupational Intakes of Radionuclides (OIR)’ [Citation9–Citation12]. In addition, ICRP has released a database of the revised dose coefficients and reference bioassay functions as an electronic annex of OIR [Citation11]. However, the latest database (version 3.01.05.18) does not yet include the dose coefficients of short-lived radionuclides. Therefore, it is necessary to estimate the dose coefficients for intake of short-lived radionuclides from the viewpoint of radiation protection planning at the facilities in accordance with the 2007 Recommendations.
The procedures for estimating dose coefficients from basic dosimetric data and models such as nuclear decay data [Citation13], specific absorbed fraction (SAF) data [Citation14] (SAF is the fraction of deposited energy per mass to a target region emitted from a source region), and biokinetic models for radionuclides incorporated into the body are quite complicated [Citation10–Citation12]. Therefore, we developed a program for computing dose coefficients by using a methodology in accordance with 2007 Recommendations [Citation10]. Subsequently, we estimated the dose coefficients for the intake of short-lived radionuclides by using the developed program.
On the other hand, dose coefficients in accordance with the 1990 Recommendations continue to be used widely in actual scenes. When we use the revised dose coefficients, it is important to grasp the reasons why the dose coefficients change with the revision of ICRP Recommendations. There are some studies which analyze the effects of revisions of dosimetric procedure, models, and data. In a previous work, a tendency to decrease colon doses was observed by the revision of the gastro-intestinal model [Citation15]. In another research, e(τ) values for inhalation cases indicated a decreasing tendency by the revision of calculation procedure for hT of the remainder tissues [Citation16]. Adoption of energy-dependent electron SAFs also decreased self-irradiation doses of organs [Citation11]. However, these studies consider the change of the models and data individually. In this study, we estimated the dose coefficients of short-lived radionuclides in accordance with the 2007 Recommendations with those based on the 1990 Recommendations to discuss the comprehensive effects of the revision of ICRP Recommendations.
2. Materials and methods
2.1 Procedure for calculating e(τ)
In the biological and dosimetric methodology of ICRP Publication 130 for determining internal doses [Citation10], the value of e(τ) is defined as follows:
where wT is the tissue weighting factor of a target organ or tissue T. The target organs and tissues to which wT is applied and the values of wT are listed in the 2007 Recommendations [Citation9]. The value of hT(τ) is calculated as follows:
where (Sv Bq−1) and
(Sv Bq−1) are the committed equivalent dose coefficients corresponding to T in the Reference Computational Phantom of Adult Male (RCP-AM) and Female (RCP-AF) constructed by ICRP [Citation17], respectively. When T consists of more than one target regions rT in the SAF data [Citation14], the values of
and
are calculated as follows [Citation10]:
where f(rT,T) is the target region fractional weight [Citation10], and hM(rT,τ) (Sv Bq−1) and hF(rT,τ) (Sv Bq−1) are the committed equivalent dose coefficients in rT of RCP-AM and RCP-AF, respectively. Then, the values of hM(rT,τ) and hF(rT,τ) are computed as follows [Citation10]:
where Ãi(rS,τ) (Bq s) is the number of disintegrations occurring in the source region rS of chain member i per activity intake of a parent nuclide, and (Sv (Bq s)−1) and
(Sv (Bq s)−1) are the radiation-weighted S coefficients Sw in rT per disintegration of the chain member i in rS for RCP-AM and RCP-AF, respectively. The values of Ãi(rS,τ) are evaluated by integrating a series of ordinary differential equations constructed based on biokinetic models provided by ICRP. Kinetics in the alimentary and respiratory tract regions are modeled as the Human Alimentary Tract Model [Citation15] and the revised Human Respiratory Tract Model [Citation10], respectively. Notably, the transfer coefficients of males are used to evaluate Ãi(rS,τ) for both males and females, even when sex-specific data are provided [Citation10]. Absorption into the blood via the respiratory tract regions and the small intestine, and radionuclide kinetics after absorption are depicted by systemic kinetic models considering element-specific characteristics [Citation11,Citation12]. The values of
and
are calculated as follows [Citation10]:
where c (J MeV−1) is a constant value (1.602 × 10¹³) to convert units from MeV to J; wR is the radiation weighting factor for radiation type R [Citation9]; Ei,R,j (MeV) and Yi,R,j are the energy and yield of the jth radiation of type R of chain member i, respectively [Citation13]; and ϕM(rT←rS,Ei,R,j)i (kg−1) and ϕF(rT←rS,Ei,R,j)i (kg−1) are the SAFs from rS to rT at the energy of Ei,R,j, respectively. The SAF values for the given energies are obtained by interpolating the SAF data, which are provided as energy discrete values [Citation14].
2.2 Development of program to calculate e(τ)
Various computational codes have been developed to calculate e(τ), such as Dose and risk CALculation software (DCAL) [Citation18], Integrated Modules for Bioassay Analysis (IMBA) [Citation19], and MONitoring to Dose cALculation (MONDAL) [Citation20]. These codes, however, are designed to calculate e(τ) based on a dosimetric methodology in accordance with the 1990 Recommendations [Citation1] (referred to hereinafter as ‘former methodology’). As of September 2018, there are no published codes to compute e(τ) based on a dosimetric methodology in accordance with the 2007 Recommendations as described in the Section 2.1 (referred to hereinafter as ‘current methodology’). Thus, we constructed a computation algorithm to derive dose coefficients by using the current methodology and developed a Fortran program based on the aforementioned algorithm.
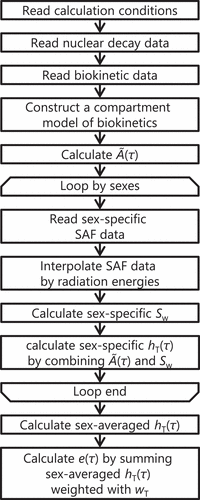
shows a flow of the program to execute the procedure for calculating e(τ) by using the current methodology. The program first reads calculation conditions and subsequently obtains the nuclear decay data of radionuclides including the radioactive progenies of the incorporated radionuclides, and the corresponding biokinetic data. Next, the program constructs a compartment model based on the biokinetic data and calculates the cumulative number of radionuclide disintegrations in the source regions per unit intake Ã(τ) by using Leggett’s algorithm [Citation20] as with DCAL [Citation18]. In the steps for calculating sex-specific hT(τ), the flow is looped by the two sexes [Citation21]. The program obtains sex-specific SAF data and interpolates the SAF data with radiation energies by using the Piecewise Cubic Hermite Interpolation Package (PCHIP) [Citation22]. The values of sex-specific Sw are calculated using EquationEquation (5)(5)
(5) , and thereafter, the values of hT(τ) are calculated by combining Ã(τ) and Sw, as in EquationEquation (4)
(4)
(4) . Finally, the value of e(τ) is obtained by summing the sex-averaged values of hT(τ) weighted using the corresponding wT. summarizes the dosimetric data and models used in the program. The data of element-specific systemic models are recorded in files separate from the execution file in plaintext format. Therefore, users can edit the data of systemic models if needed.
Table 1. Dosimetric data and models used in program developed in the present study
Figure 1. Calculation flow of program developed in the present study.
2.3 Verification of developed program
Verification of the developed program was performed by confirming whether the program reproduces the e(τ) values recorded in the tables of OIR part 2 [Citation11]. The OIR tables lists e(τ) with two significant figures for 98 classifications of the intake (hereinafter called case) of 19 nuclides of 14 elements. The confirmation was performed for all 98 cases.
2.4 Calculation conditions of dose coefficients of short-lived radionuclides
lists the radionuclides whose dose coefficients are evaluated in this study. All of them are not included in the OIR Data Viewer, although they are recorded in the current nuclear decay data [Citation13]. The classifications of intake patterns, which include variations of intake paths and chemical forms, were determined by referring to ICRP Publication 68 [Citation1] to compare the calculation results against the e(τ) values generated using DCAL [Citation18]. The current version of DCAL, version 9.4, can calculate dose coefficients by using the former methodology, except for the nuclear decay data because DCAL version 9.4 uses the latest version of nuclear decay data [Citation13]. In addition, both DCAL and the developed program use Leggett’s algorithm to calculate Ã(τ). Therefore, we can discuss the impact of revision of the dosimetric methodology on the values of e(τ) by means of this comparison.
Table 2. Object radionuclides for calculation of dose coefficients
3 Results
3.1 Program verification
The calculated values of e(τ) generated using the developed program were compared with the values tabulated in OIR part 2 (reference values) [Citation11]. For 91 of the total 98 cases, the results generated using the developed program were consistent with the reference values within two digits. lists the cases in which the calculation results did not agree with the values given in OIR part 2. The difference between the corresponding values of e(τ), D (%), is defined as follows:
Table 3. Values of e(τ) generated using developed program and those listed in OIR part 2, and differences in values of e(τ) and D between the two sets of values
where eprog (Sv Bq−1) is the e(τ) calculated using the developed program, and eOIR (Sv Bq−1) is the reference value. The D values were lower than 5%, as listed in . Slight discrepancy is unavoidable because of rounding errors over multiple calculation steps. As a result, the program was considered to be verified.
3.2 Calculation of e(τ) for short-lived radionuclides
and summarize the calculation results obtained using the developed program and DCAL for inhalation and ingestion of short-lived radionuclides, respectively. The ratio is the quotient of e(τ) generated using the developed program divided by that obtained using DCAL. Most e(τ) values decreased in the inhalation cases, as shown in . By contrast, the e(τ) values in the ingestion cases tended to increase.
Table 4. Values of e(τ) generated using developed program and those generated using DCAL, and ratios of e(τ) for inhalation of short-lived radionuclides
Table 5. Values of e(τ) generated using developed program and those generated using DCAL, and ratios of e(τ) for ingestion of short-lived radionuclides (1/2)
4. Discussion
4.1 Cause analyses of differences in e(τ) for inhalation cases
In the inhalation cases, the e(τ) values generated using the developed program were lower than those obtained using DCAL, except for the inhalation of 10C gases and 36S vapor, as shown in . First, the case of inhalation of 89mY Type M was analyzed because in this case, the e(τ) ratio was the smallest in . lists the calculation results of hT(τ) and e(τ) for the inhalation of 89mY Type M. Here, a proportion index for a tissue PT is introduced to analyze a key tissue or organ with a changed e(τ) value. The values of PT obtained using the developed program (PT,p) and DCAL (PT,D) are defined as follows:
Table 6. Values of hT(τ) and PT, and difference in PT for inhalation of 89mY Type M
where wT,2007 and wT,1990 are the tissue weighting factors given in the 2007 and 1990 Recommendations of ICRP, respectively; hT,p (Sv Bq−1) and hT,D (Sv Bq−1) are the hT values obtained using the developed program and DCAL, respectively; and eD (Sv Bq−1) is the e(τ) value generated using DCAL. Note that the denominator of EquationEquation (7)(7)
(7) for PT,p is eD to elucidate the contribution of hT(τ) in the change in e(τ) based on eD. In addition, also lists the values of PT and the difference between PT,p and PT,D. In this case, the dominant cause that led to a decrease in e(τ) was the decrease in hT(τ) for the remainder tissues (hrem), as presented in . The calculation procedures of hrem in the current and the former methodologies are different [Citation3,Citation9]. In the former methodology, hrem is defined as the tissue-mass-weighted average of the values of hT(τ) for the members of the remainder tissues by using the so-called splitting rule [Citation23]. The splitting rule for calculating hrem is expressed as follows:
where mi (kg) is the mass of the ith member of the remainder tissues, hi (Sv Bq−1) is the committed equivalent dose coefficient of the ith tissue, hT’ is the maximum hT(τ) among the tissues included in the remainder tissues, and hmax is the maximum hT(τ) among the tissues that are assigned specific wT values. By contrast, in the current methodology, hrem is defined as the arithmetic mean of the values of hT(τ) for the members of the remainder tissues, and the splitting rule is abolished [Citation9]. In all inhalation cases with an increase in e(τ), the tissue receiving the highest hT(τ) was the ET region in the DCAL result. That is, the relatively high value of hrem was caused by the predominantly large hT(τ) for the ET region in the DCAL result. Therefore, abolishment of the splitting rule led to a decrease in the value of hT(τ) for the ET region (hET).
The ET region consists of the anterior nasal passage (ET1), and the posterior nasal passage, pharynx, and larynx (ET2). The value of hET is defined as follows:
where hET1, hET2, and hLN-ET are the hT(τ) of ET1, ET2, and lymphatic nodes in the ET region (LN-ET), respectively; and AET1,AET2, and ALN-ET are the apportionment factors considering the differences in radiation sensitivity between the tissues for ET1, ET2, and LN-ET, respectively. The values of AET1, AET2, and ALN-ET are 0.001, 0.998, and 0.001, respectively, according to the former methodology [Citation24]. In the current methodology, LN-ET is not a member of the ET region, and the values of AET1 and AET2 are 0.001 and 0.999, respectively [Citation10]. In any case, hET2 is generally dominant in hET in both methodologies. The decrease in hET was caused by a change in the photon SAF data of self-absorption in ET2. shows the photon SAF data from the surface of ET2 to the target cells in ET2 in the current and the former methodologies [Citation14,Citation25]. The current data are averages of the values for males and females. The ratio of the current SAF to the former SAF is 0.41 at the energy of the main photon emitted from 89mY, which is 0.91 MeV [Citation13]. In the former methodology, the photon SAFs to the thyroid from the source regions were substituted with those to ET2 [Citation24] because the ET regions were not modeled in the previous human model used to evaluate SAF data [Citation26]. By contrast, the current human models include the ET1 and ET2 regions, and the mass of ET2 is smaller than that of the thyroid [Citation17]. Self-absorption SAF depends on the mass of the tissue or region [Citation27–Citation30]. In addition, the deposition fraction of inhaled aerosol to ET2 decreased by 35% owing to revision of the Human Respiratory Tract Model (HRTM) based on a review of particle transport in the ET regions after publication of the original HRTM [Citation10]. Therefore, the hET values decreased in most inhalation cases. These findings revealed that the decrease in e(τ) in the inhalation cases was caused by three factors. The first was abolition of the splitting rule for calculating hrem adopted in the former methodology; the second was the change in the photon SAF data; and the third was the change in the deposition fraction of inhaled radioactive aerosols to ET2 region.
Figure 2. Photon SAFs to target cells in ET2 from surface of ET2. The solid curve and the broken curve indicate the current data [Citation14] and the previous data [Citation25], respectively.
![Figure 2. Photon SAFs to target cells in ET2 from surface of ET2. The solid curve and the broken curve indicate the current data [Citation14] and the previous data [Citation25], respectively.](/cms/asset/16c1e9d0-f3de-4d44-9982-7eb2e9b3c15f/tnst_a_1585988_f0002_oc.jpg)
The e(τ) values increased for inhalation of 10C gases and 37S vapor, as listed in . In these cases, the radionuclides inhaled into the lungs were assumed to be absorbed instantly into the blood [Citation1,Citation11,Citation24], and most radionuclides decayed in the blood owing to their short half-lives. The former blood source SAFs are evaluated with the assumption that blood is distributed throughout the body in proportion to the masses of the tissues and organs [Citation25]. However, the current blood source SAFs are evaluated considering the blood fractions of the tissues and organs [Citation17]. The lungs, colon, and liver, to which relatively large wT values are assigned, are characterized by relatively high blood fractions. Consequently, the current blood source SAFs to highly weighted organs and tissues are larger than the former SAFs. As a result, the increase in e(τ) was caused by the change in SAF whose source region is the blood.
4.2 Cause analyses of differences in e(τ) for ingestion cases
In most ingestion cases, the e(τ) values obtained using the developed program were larger than those obtained using DCAL, as can be inferred from . The primary cause of increase in e(τ) was the increase in the hT(τ) value of the esophagus. In the former methodology, the hT(τ) value of the esophagus is substituted by that for the thymus [Citation31] because the esophagus is not incorporated in the former human model [Citation26] used for SAF evaluation. By contrast, the esophagus is considered in both the biokinetic models and the human models in the current methodology [Citation10,Citation17]. Therefore, the current methodology can consider that the esophagus tissue receives radiation energy emitted from the radionuclides in the esophagus directly. Consequently, the hT(τ) of the esophagus tended to increase in most of the ingestion cases.
The ratio of e(τ) for 94mNb was the smallest in the decrement cases. An analysis using PT revealed that the decrease in hT(τ) for the stomach (hst) caused the change in e(τ). Then, the change in hst was caused by revision of the electron SAFs to the stomach from its contents [Citation14,Citation32]. In the former methodology, the electron SAFs are constant for the alimentary tract region based on simple assumptions [Citation32]. By contrast, the revised SAFs for the alimentary tract region are evaluated by radiation transport simulations considering the positions of the target stem cells buried in the alimentary tract wall [Citation15]. As a result, the electron SAFs to the stomach from its contents are zero below 80 keV because the electrons are shielded by the wall tissue between the surface of the wall and the target stem cells [Citation14,Citation15]. Such difference in the electron SAFs led to the decrease in hst, and consequently, a decrease in e(τ) in the case of 94mNb ingestion. The underlying causes in the cases of 89mZr and 99Nb were the same as that in the case of 94mNb.
The e(τ) values decreased in the two cases of 93Sr. In these cases, it was found in an analysis using PT values that the decrease in the e(τ) values was caused by changes in the hT(τ) values of the colon. The half-life of 93Y, which is the progeny of 93Sr, is 10.2 h, and it is longer than that of 93Sr, 7.42 min [Citation13]. Therefore, the number of decays of 93Y in the colon content, which is the latter part of the alimentary tract, was larger than that in the other ingestion cases because the retention time of colon content is longer than the retention times of the upper parts of the alimentary tract [Citation15,Citation32]. Beta decay electrons are the dominant radiation for exposure dose due to 93Y [Citation13]. The electron SAFs in the colon region decrease when the SAF data are updated [Citation14,Citation32] for the same reason as in the stomach case. Such changes in the SAFs of the colon led to a decrease in the hT(τ) of the colon, and consequently, e(τ) in the cases of 93Sr.
4.3 Comparison to previous studies
In a previous work, it was noted that abolition of the splitting rule tends to decrease e(τ) in the inhalation cases [Citation16]. This present study revealed that the decreasing tendency of e(τ) in the inhalation cases is enhanced by changes in the deposition fraction to the ET2 region associated with revision of the clearance model in the respiratory tract region. By contrast, the present study is the first report in which changes in the blood source SAFs tended to increase e(τ) in the inhalation cases.
For the ingestion cases, it was reported that the e(τ) values decreased owing to changes in the electron SAFs to the colon from its content owing to consideration of the target stem cell position in a few cases [Citation15]. This phenomenon has been observed, but it hardly occurred in the present study because of the short half-lives. On the contrary, the tendency of e(τ) to increase was observed in this study because of the increase in the value of hT(τ) of the esophagus owing to the adoption of human models in which the esophagus is included. If the half-life of the ingested radionuclide is comparatively long, the number of disintegrations in the esophagus will be smaller than those in the colon and the systemic organs and tissues. Consequently, the contribution of hT(τ) of the esophagus to e(τ) will be small. Therefore, the trend of increase in e(τ) for the ingestion cases seems to be limited to short-lived radionuclides.
5. Conclusions
Committed effective dose coefficients of short-lived radionuclides were estimated using a program developed in the present study that employs the dosimetric methodology that is in accordance with the 2007 Recommendations of ICRP. The program was verified using the data listed in OIR part 2.
The calculated coefficients were compared to the values generated using DCAL, which uses the dosimetric methodology that is in accordance with the 1990 Recommendations of ICRP. The trend of decrease in the e(τ) values was observed in the inhalation cases. This was caused by the abolition of the splitting rule, revision of SAF data, and changes in the deposition fraction of inhaled aerosols to the ET2 region. On the contrary, the tendency of e(τ) to increase was observed in the ingestion cases owing to consideration of the esophagus in the current human models and biokinetic models. However, this trend seems to be specific to short-lived radionuclides because the contribution of hT(τ) of the esophagus to e(τ) is small for radionuclides with comparatively long half-lives. By contrast, the influence of revisions in element-specific biokinetic data on dose coefficients was not analyzed because most of the activities disappeared in element-independent regions, such as the respiratory tract and the alimentary tract, because of the short half-lives. Analyses of radionuclides with long half-lives are necessary to discuss the influence of revisions to element-specific systemic kinetics.
The calculated dose coefficients will be available to estimate potential doses resulting from intake of short-lived radionuclides at high-energy accelerator facilities. In addition, knowledge of the influences of revisions to dosimetric methodologies on dose coefficients will be helpful for revision of regulatory standards for radiation protection in accordance with the 2007 Recommendations.
Disclosure statement
No potential conflict of interest was reported by the authors.
Notes
1. In this paper, ‘short-lived’ means that the half-life is shorter than 10 min.
Related Research Data
References
- International Commission on Radiological Protection. Dose coefficients for intakes of radionuclides by workers. ICRP Publication 68. Ann ICRP. 1994;24(4):1–83.
- International Commission on Radiological Protection. Age-dependent doses to the members of the public from intake of radionuclides-part 5. Compilation of ingestion and inhalation coefficients. ICRP Publication 72. Ann ICRP. 1995;26(1):1–89.
- International Commission on Radiological Protection. 1990 Recommendations of the International Commission on Radiological Protection. ICRP Publication 60. Ann ICRP. 1991;21(1–3):1–11.
- Kawai K, Endo A, Noguchi H. Dose coefficients for radionuclides produced in high energy proton accelerator facilities; Coefficients for radionuclides not listed in ICRP Publications. Ibaraki (Japan): Japan Atomic Energy Research Institute; 2002. JAERI-Data/Code 2002-013.
- Miyamoto Y, Ikeno K, Akiyama S, et al. Design concept of radiation control system for the high intensity proton accelerator facility. Ibaraki (Japan): Japan Atomic Energy Research Institute; 2002. JAERI-Tech 2002-086 [in Japanese].
- Shanahan J, Eckerman K, Arndt A, et al. Calculation of dose coefficients for radionuclides produced in a spallation neutron source utilizing NUBASE and the evaluated nuclear structure data file databases. Health Phys. 2006;90(1):56–65.
- Endo A, Yamaguchi Y, Eckerman KF. Nuclear decay data for dosimetry calculation; revised data of ICRP Publication 38. Ibaraki (Japan): Japan Atomic Energy Research Institute; 2005. JAERI 1347.
- Endo A, Eckerman KF. Nuclear decay data for dosimetry calculation; data for radionuclides with half-lives less than 10 minutes. Ibaraki (Japan): Japan Atomic Energy Agency; 2007. JAEA-Data/Code 2007-021.
- International Commission on Radiological Protection. The 2007 Recommendations of the International Commission on Radiological Protection. ICRP Publication 103. Ann ICRP. 2007;37(2–4):61–79.
- Paquet F, Etherington G, Bailey MR, et al. Occupational intakes of radionuclides: part 1. ICRP Publication 130. Ann ICRP. 2015;44(2):5–188.
- Paquet F, Bailey MR, Leggett RW, et al. Occupational intakes of radionuclides: part 2. ICRP Publication 134. Ann ICRP. 2016;45(3–4):7–349.
- Paquet F, Bailey MR, Leggett RW, et al. Occupational intakes of radionuclides: part 3. ICRP Publication 137. Ann ICRP. 2017;46(3–4):1–486.
- International Commission on Radiological Protection. Nuclear decay data for dosimetric calculations. ICRP Publication 107. Ann ICRP. 2008;38(3):e1–e25.
- Bolch WE, Jokisch D, Zankl M, et al. The ICRP computational framework for internal dose assessment for reference adults: specific absorbed fractions. ICRP Publication 133. Ann ICRP. 2016;45(2):5–73.
- International Commission on Radiological Protection. Human alimentary tract model for radiological protection. ICRP Publication 100. Ann ICRP. 2006;36(1–2):69–111.
- Manabe K, Endo A. Calculation of dose coefficients and concentration limits based on tissue weighting factors, et al. revised in the ICRP 2007 Recommendations. Ibaraki (Japan): Japan Atomic Energy Agency; 2010. JAEA-Data/Code 2010-020 [in Japanese].
- International Commission on Radiological Protection. Adult reference computational phantoms. ICRP Publication 110. Ann ICRP. 2009;39(2):21–70.
- Eckerman KF, Leggett RW, Cristy M, et al. User’s guide to the DCAL system. Oak Ridge (USA): Oak Ridge National Laboratory; 2006. ORNL/TM-2001/190.
- Birchall A, Puncher M, James AC, et al. IMBA expert(r): internal dosimetry made simple. Radiat Prot Dosim. 2003;105(1–4):421–425.
- Ishigure N, Matsumoto M, Nakano T, et al. Development of software for internal dose calculation from bioassay measurements. Radiat Prot Dosim. 2004;109(3):235–242.
- Leggett RW, Eckerman KF, Williams LR. An elementary method for implementing complex biokinetic models. Health Phys. 1993;64(3):260–271.
- Netlib Repository at UTK and ORNL. slatec/pchip. [cited 2018 Sep 11]. Available from: http://www.netlib.org/slatec/pchip/.
- International Commission on Radiological Protection. Age-dependent doses to members of the public from intake of radionuclides – part 2 ingestion dose coefficients. ICRP Publication 67. Ann ICRP. 1993;23(3–4):1–7.
- International Commission on Radiological Protection. Human respiratory tract model for radiological protection. ICRP Publication 66. Ann ICRP. 2006;24(1–3):8–120.
- Cristy M, Eckerman KF. SEECAL: program to calculate age-dependent specific effective energies. Oak Ridge (USA): Oak Ridge National Laboratory; 1993. ORNL/TM-12351.
- Cristy M, Eckerman KF. Specific absorbed fractions of energy at various ages from internal photon sources. I. Methods. Oak Ridge (USA): Oak Ridge National Laboratory; 1987. ORNL/TM-8381/V1.
- Zankl M, Petoussi-Henss N, Fill U, et al. The application of voxel phantoms to the internal dosimetry of radionuclides. Radiat Prot Dosim. 2003;105(1–4):539–547.
- Kinase S, Zankl M, Kuwabara J, et al. Evaluation of specific absorbed fractions in voxel phantoms using Monte Carlo simulation. Radiat Prot Dosim. 2003;105(1–4):557–563.
- Zankl M, Schlattl H, Petoussi-Henss N, et al. Electron specific absorbed fractions for the adult male and female ICRP/ICRU reference computational phantoms. Phys Med Biol. 2012;57:4501–4526.
- Manabe K, Sato K, Endo A. Comparison of internal doses calculated using the specific absorbed fractions of the average adult Japanese male phantom with those of the reference computational phantom-adult male of ICRP Publication 110. Phys Med Biol. 2014;59:1255–1270.
- International Commission on Radiological Protection. Annuals limits on intake of radionuclides by workers based on the 1990 Recommendations. ICRP Publication 61. Ann ICRP. 1991;21(4):1–41.
- International Commission on Radiological Protection. Limits for intakes of radionuclides by workers. ICRP Publication 30 part 1. Ann ICRP. 1979;2(3–4):30–34.