
 ?Mathematical formulae have been encoded as MathML and are displayed in this HTML version using MathJax in order to improve their display. Uncheck the box to turn MathJax off. This feature requires Javascript. Click on a formula to zoom.
ABSTRACT
The Master Curve (MC) method is widely used to evaluate the fracture toughness of ferritic steels for reactor pressure vessels in the ductile-brittle transition zone, but this method is only applicable to macroscopically uniform ferritic steels. Based on the measured fracture toughness data of China-produced SA738Gr.B steel Heat-Affected Zone (HAZ) in the as-welded and heat-treated state, the problems of the standard MC method for characterizing the fracture toughness of the HAZ are discussed. Then the Bi-modal master curve method (BMC), SINTAP method, and Single point estimation method (SPE) were used to characterize the fracture toughness of the HAZ of SA738Gr.B steel in the ductile-to-brittle transition zone. The comparative analysis found that the BMC method is better in terms of the accuracy of the estimation and the over-dispersion envelope was caused by the heterogeneity. The estimation results of the SINTAP and SPE models are conservative but can be used for the safety evaluation of the actual structure. The study provided technical support for SA738Gr.B steel to exempt post-weld heat treatment issue.
1. Introduction
The steel CV material of the CAP1400 nuclear power project is SA738Gr.B steel. The maximum thickness of SA738Gr.B steel specified in the 2007 ASME NE specification is 44.5 mm for exempting PWHT. However, in order to improve the seismic resistance and safety requirements, the CAP1400 containment has a cylinder section thickness of 52 mm. The ring section weld of the cylinder section should be subjected to a full-circle post-weld heat treatment, but the post-weld heat treatment faces insufficient on-site electric power, construction difficulty, and risk. Such problems, as well as improper control of parameters can bring great hidden dangers [Citation1,Citation2]. Although Code Case N-841 has increased the maximum thickness of the exempting post-weld heat treatment to 60 mm [Citation3], the US Nuclear Regulatory Commission has not sufficient evident to approve this specification case and cannot use it directly on CV. Exemptions to mandatory PWHT has caused widespread concern in various countries. In Japan, Hayashi et al. conducted a systematic study to exempt PWHT and obtained some conclusions beyond what is commonly known. They obtained the reference temperature T0 of the three types of welding HAZ of 60 mm thick SA738Gr.B, based on ASTM E1921-15, and the low temperature fracture toughness after heat treatment has different degrees of deterioration. This means that it is a non-effective and unnecessary process to improve the fracture toughness of the welded joint of SA738Gr.B steel by post-weld heat treatment. It is concluded that without PWHT of 60mm thick SA738Gr.B steel is feasible [Citation1].
However, the low-temperature fracture toughness of SA738Gr.B Steel Heat-Affected Zone tends to be more complicated due to its intrinsic dispersibility and dispersibility caused by inhomogeneous material composition. Generally, ferritic steel exhibits a ductile-brittle transition (DBT) phenomenon within a certain temperature range. Fracture toughness exhibits high dispersion and strong temperature dependence in the DBT region [Citation4]. Even small temperature changes may result in large changes in fracture toughness. This feature poses a potential threat to the structural safety of the pressure vessel. The fracture toughness master curve (MC) method [Citation5] is based on the Weibull statistical analysis of the weakest chain, which is a good indicator of the distribution of fracture toughness in the DBT region. This method and its test standard ASTM E1921 have been widely accepted internationally [Citation6–Citation9]. It should be noted that the ASTM E1921 is only applicable to macroscopically uniform ferritic steels [Citation10,Citation11]. For macroscopically inhomogeneous materials [Citation12], such as the Heat-Affected Zone (HAZ), the effects of elemental diffusion and heat flow during the welding process lead to the enrichment of some alloying elements and the formation of complex microstructures in the interface region. There is a significant difference in fracture toughness between the base metal and the weld. Meanwhile, the welded HAZ is the weak link in the structure, so it is very crucial to characterize the fracture toughness distribution in the DBT zone accurately. In order to solve the problem that the standard MC method cannot accurately estimate the reference temperature T0 of the heterogeneous material, several processing methods have been proposed in the world, such as the Bi-modal Master Curve (BMC) [Citation13], randomly inhomogeneous master Curve (RIMC) method, Single Point Estimation method (SPE), and Advanced Single Point Estimation method (ASPE) [Citation14]. In addition, there is the SINTAP [Citation15,Citation16] method proposed by European structural integrity. However, inhomogeneous fracture toughness data are still scare and we aim to provide more documents. So further studies are still essential.
In this paper, the fracture toughness of the HAZ of China-produced SA738Gr.B steel under two heat treatment conditions was tested. Considering the urgent need of engineering, this paper focuses on assessing HAZ fracture toughness, the weakest region of welded joint with as welded state and PWHT state. Then, several typical methods as mentioned earlier are used to show that the relationship between fracture toughness and temperature and cumulative failure probability is in the DBT region, and the reference temperature T0 is obtained. The advantages and disadvantages of different models used to represent the inhomogeneous material fracture toughness of the DBT region were compared and analyzed. Related results can provide technical support for the PWHT of SA738Gr.B steel.
2. Material and experimental
The base material is taken from CAP1400 containment SA738Gr.B steel plate with a plate thickness of 55 mm, which is a type of low alloy high strength steel. It is quenched and tempered at the factory, and the room temperature microstructure is granular bainite and a small amount of pro-eutectoid ferrite. This kind of steel has obvious DBT phenomenon, and its room temperature microstructure is shown in .
Figure 1. Microstructure of SA738Gr.B steel.
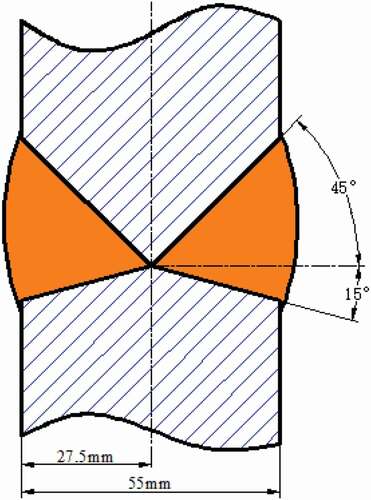
The weldments were made by submerged arc welding (SAW), the welding groove is shown in below, and the SAW-related parameters are shown in . After the two welding test plates have passed the penetration and the radiation test, they all meet the requirements. One of them was subjected to stress relief annealing at a temperature of 607 ± 12°C and a holding time of 10 h marked as (PWHT state), and the other was an as welded state (AW).
Table 1. SAW experiment scheme of SA738Gr.B
Figure 2. Schematic diagram of double-Y groove.
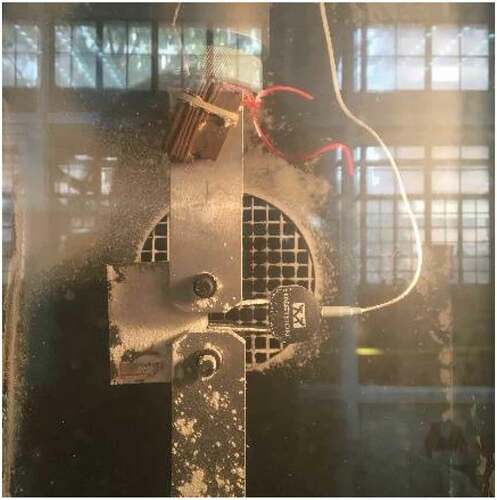
The fracture toughness was obtained with the 0.5T-C(T) specimen having the T-L direction, and the specimens extracted from HAZ are shown in ). A crack having a total length of 12.7 mm was obtained by wire electrical discharge machining (WEDM) and fatigue test, in which fatigue was prefabricated with a sharp crack of about 2 mm. Through the metallographic examination, the width of the HAZ zone is approximately 1.5 mm, as shown in ). The key to the success of this test is that the crack surface is located in the HAZ. For each CT specimen, the validity of the specimen is checked, and the qualified specimen is used for the test. Typical metallographic results are shown in (c,d). Experimental temperatures were set to −130°C and −140°C, respectively, and temperature was controlled within ±3°C using a regulated liquid Nitrogen flow in an insulated chamber equipped with PID controller as shown in . The results of tests were analyzed following ASTM E1921-15a. The KJc values at different temperatures are listed in .
Table 2. Fracture toughness test data
Figure 3. HAZ specimen sampling diagram. (a) Schematic diagram of 0.5T-C(T) specimen sampling in HAZ, (b) Heat-affected zone range metallographic map, (c) Machining groove in HAZ schematic, and (d) HAZ prefabricated fatigue crack specimen.
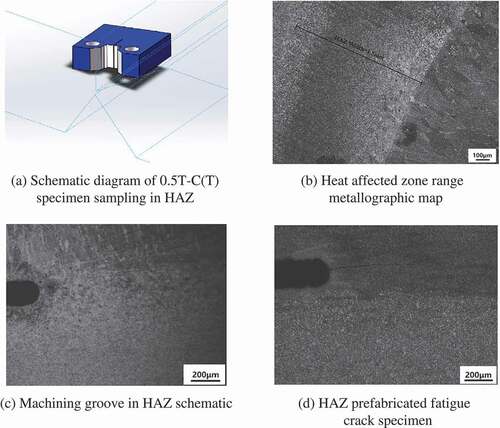
Figure 4. Fracture toughness test environment.
3. MC method and problems caused by heterogeneity
The MC method used as a low temperature fracture toughness assessment technique enables to describe the brittle fracture behavior of ferritic steels with yield strengths between 275 and 825 MPa in DBT region. The MC cumulative failure probability distribution of three parameters Weibull model for a given temperature data has the form EquationEquation (1)(1)
(1) .
Fracture toughness has its specific complexity, such as size effect. According to the research results of Wallin et al., the fracture toughness of different thicknesses should be converted into the standard fracture toughness to be brought into the above EquationEquation (1)(1)
(1) . All data are adjusted to reference thickness with EquationEquation (2)
(2)
(2) :
Facture toughness with temperature failure probability plotted is 50% is defined the master curve with EquationEquation (3)(3)
(3) . The temperature corresponding to the fracture toughness of the master curve at 100 MPa is defined as the reference temperature T0, which is the characterization parameter of the macro fracture property of the material.
ASTM E1921 provides two methods for determining the reference temperature T0, single temperature method and multi-temperature method. For single temperature method, the scale parameter K0 needs to be estimated according to the following EquationEquation (4)(4)
(4) .
The median fracture toughness can be calculated with EquationEquation (5)(5)
(5) :
Then the median fracture toughness for the data set can obtain referenceT0 with EquationEquation (3)(3)
(3) . We need to pay special attention to the fact that the experimental temperature cannot deviate from T0 50 degrees Celsius. Now using a reference temperature T0 to establish the relationship between fracture toughness and temperature at different failure probabilities of materials has the form EquationEquation (7)
(7)
(7) .
According to the MC method, the scale parameter K0 and the reference temperature T0 of the SA738 Gr. B steel HAZ are shown in . The HAZ master curve of SA738Gr.B steel and the 95% and 5% upper and lower boundary curves are shown in .
Table 3. Standard MC method to obtain the characteristic parameters
Figure 5. MC method results of SA738Gr.B HAZ. (a) AW and (b) PWHT.
Clause 1.8 of E1921 specifies that the MC method is only applicable to macroscopically uniform materials; inhomogeneous materials may cause inaccurate estimation of the reference temperature T0 and non-conservative confidence bounds. If we ignore the heterogeneity of HAZ, what is the consequence of using the MC method to predict the fracture toughness of HAZ in the ductile-brittle transition zone? According to the theoretical basis of the MC method, all the fracture toughness KJc data (the data validated by E1921) on the graph with (ln(1/(1-Pf)))1/4 as the ordinate and KJc as the abscissa The fracture toughness data converted to 1T thick material should be distributed on a straight line passing through the (20,0) coordinate point. After the Weibull distribution specified by the MC method is linearized, the fracture toughness data of the SA738Gr.B steel HAZ measured in this paper is plotted in the graph of .
Figure 6. Weibull plots of fracture toughness data (Weibull slop fixed at 4).
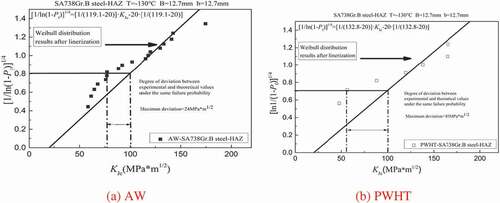
It can be seen from the analysis in and that if the standard MC method is directly used to characterize the macroscopically inhomogeneous HAZ material, there are three problems as follows. First, some data points fall outside the upper and lower boundaries of the failure probability of 5% and 95%, indicating that the standard MC method cannot solve the problem of excessive scatterness of macroscopic fracture toughness due to the extremely inhomogeneous microstructure. Second, the linearization of the standard three-parameter Weibull distribution deviates significantly from the experimental data. Third, comparing (a,b), in the case of a lower failure probability, the MC method is estimated to be significantly larger than the experimental value. Evaluating the fracture toughness of HAZ using standard MC methods may have dangerous consequences. In order to solve these problems, several methods were used to predict the fracture toughness of HAZ in the ductile-brittle transition zone.
4. Brief review of several methods
4.1. The BMC analysis method
The BMC method consists of two interconnected MC distributions whose total failure probability can be represented by a modified three-parameter Weibull distribution EquationEquation (8)(8)
(8) . Where K01 and K02 are the scale parameters of the two distributions, Pa is the probability of the test data in the distribution 1; the threshold fracture toughness Kmin and the shape parameter b are still taken as 20 and 4 of the standard MC method, respectively. The standard MC method only needs to determine the unique distribution parameter K0, while the unknown parameters of the BMC method are Pa, K01, and K02. Based on the idea of maximum likelihood estimation, Pa, K01, and K02 can be determined by using the solution algorithm. The likelihood function can be expressed as EquationEquation (9)
(9)
(9) . To simplify the numerical iterative process, the likelihood function is transformed into a logarithmic form, as shown in EquationEquation (10)
(10)
(10) .
The expressions of the probability density function and the survival function are as follows.
4.2. The SPE analysis method
The SPE method is relatively easy to implement, and only needs to convert the effective KJc data into the value of the 1T sample, and then use the following EquationEquation (13)(13)
(13) to obtain the T0, i of each sample at different temperatures.
The reference temperature T0 value (T0SP) of the heterogeneous material single point method is as shown in EquationEquation (14)(14)
(14)
Therefore, under different cumulative failure probabilities, the variation of fracture toughness of HAZ with temperature is as shown in EquationEquation (15)(15)
(15) .
4.3. SINTAP maximum likelihood estimation procedure
The SINTAP method given below containing three stages is mainly used to analyze the fracture toughness of inhomogeneous materials. It finally obtains a lower bound scale parameter K0, which can be used to characterize the distribution of fracture toughness of heterogeneous materials in combination with the Weibull distribution in the standard MC method.
Stage 1 calculates the estimate of the median fracture toughness, which is essentially the same as the method in E1921. KJc (limit) is used as the screening criterion, and the data validated by E1921 is used for the estimation of stage 1. The characteristic fracture toughness and reference temperature obtained in stage 1 are recorded as K0(step1) and T0(step1), respectively.
Stage 2 conducts a lower tail maximum likelihood estimation, examining and modifying any undue effect of immoderate values in the upper tail of the distribution. Fracture toughness data with cumulative failure probability above 50% is removed, and 50% or less is used for a new MML estimation. The characteristic fracture toughness and reference temperature obtained are recorded as K0(step2) and T0(step2), respectively. Compare the values of K0(step1) and K0(step2). If the value of K0(step2) is not less than the value of K0(step1), stop this analysis step. If the value of K0(step2) is less than the value of K0(step1), repeat stage 2 and re-analyze with K0(step2) instead of K0(step1) until the iteration is consistent with K0(step1) not less than K0(step2) value.
Stage 3 gives a lower-tail estimate method to check the extent of material inhomogeneity and provide a margin of safety for this situation. When the number of specimens is less than 10, an additional safety factor is included in the analysis process. The MML analysis step can generate the scale parameter K0 value and the median fracture toughness KJc(med), respectively, the 63.2% and 50% (median) cumulative failure probabilities from which a probability distribution can be calculated
5. Results and discussion
In order to accurately evaluate the fracture toughness of HAZ in the DBT region, the objectives are as follows: (1) Accurately express the variation of fracture toughness in the ductile-brittle transition interval with temperature under different failure probability; (2) The corresponding method can be well enveloped to cope with scatterness caused by heterogeneity.
5.1. BMC estimation results
According to Section 4, the program is used to solve the parameters Pa, K01 and K02. The results of the HAZ parameters of the as-welded and post-weld heat treatment are shown in .
Table 4. BMC method characteristic parameters fitting values
Further processing to obtain the reference temperature T0BMC in the AW and PWHT states was −128.2°C and −144.8°C, respectively. shows the fracture toughness distribution of the materials in the AW and PWHT states predicted by the BMC method, respectively.
In order to investigate the applicability of the BMC method for characterizing HAZ, the datum of fracture toughness in the two states of SA738Gr.B steel HAZ measured in this paper is plotted in . It can be found that the BMC method has a significant improvement in the cumulative failure probability distribution of the fracture toughness of the SA738Gr.B steel HAZ, and the standard MC method is obvious deviating from the distribution of the test data. From the results of and , some data points in the MC method fall outside the boundary line, which indicate that the MC method cannot solve the problem of excessive scatterness of fracture toughness caused by inhomogeneity. The upper and lower envelope boundaries in the BMC method can accommodate all data points. This means that the BMC method is suitable for characterizing fracture toughness at low temperatures in the case of heterogeneous materials such as HAZ and welds. However, the biggest disadvantage of the BMC method is that it contains three parameters, and the complex equations need to be solved by an algorithm.
Figure 8. Weibull distribution fitting (Weibull slop fixed at 4). (a) AW and (b) PWHT.
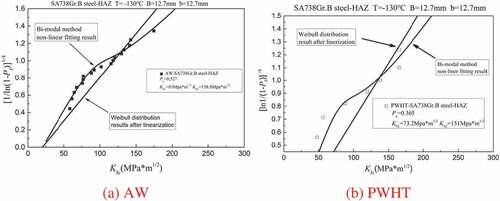
Figure 7. BMC model master curve and its 5% and 95% upper and lower boundary curves.
5.2. SP estimation results
The fracture toughness characteristic parameters of HAZ in AW and PWHT state were characterized by the above SP method, and the reference temperature T0SP in two states was −129.8°C and −124.2°C. shows the prediction of fracture toughness.
Figure 9. SPE model master curve and its 5% and 95% upper and lower boundary curves. (a) AW and (b) PWHT.
The SPE model is relatively simple and convenient to calculate, but lacks a rigorous theoretical foundation. More tests are needed to verify the applicability of the method.
5.3. SINTAP estimation results
The fracture toughness characteristic parameters of HAZ in two states were characterized by the above SINTAP method. Their characteristic parameters are shown in :
Table 5. BMC method characteristic parameters fitting values
Generally, it is recommended that all three stages be employed when the number of tests to be analyzed is less than 10. When the number of specimens is greater than or equal to 10, only stages one and two need to be used. The reliability of the SINTAP analysis depends on the size of the test sample and increases as the sample size increases. Due to the statistical uncertainty of small samples, in order to obtain a very strong reliable results, the sample size needs to be at least 20 valid data points. Through the requirements of SINTAP, the data set can be considered to represent a macroscopically uniform material, if:
If the inequality in EquationEquation (20)(20)
(20) is not fulfilled, the data set may be respective of a macroscopically inhomogeneous material. Based on the data tested in this paper, the SINTAP inhomogeneity screening results are shown in the , indicating that the HAZ in both heat treatment states are heterogeneous materials, which means that 12 test data are sufficient to meet the screening criteria. According to the SINTAP standard, the probability of such an evaluation result being incorrectly estimated is less than 5%. However, SINTAP inhomogeneity screening can only give a qualitative estimate, homogenous, or inhomogeneous, and cannot accurately estimate the degree of inhomogeneity. The SINTAP method cannot explain the larger value of T0(step1)-T0(step2) in the PWHT state. More accurate screening requires more experimental data to avoid the uncertainty caused by small number of samples.
Table 6. SINTAP inhomogeneity screening results
According to the three stages in SINTAP, characteristic parameter K0 in the AW state is 100.1 MPa·m1/2, and K0 in the PWHT state is 77.6 MPa·m1/2, and the corresponding T0SINTAP is −124.5°C and −103.8°C, respectively. The results of the fracture toughness distribution of the HAZ material in two states are shown in .
Figure 10. SINTAP model master curve and its 5% and 95% upper and lower boundary curves.
The SINTAP method conservatively estimates the lower limit of the fracture toughness characteristic parameter. Although it is not accurate, it is suitable for the safety assessment of the actual structure.
In order to facilitate comparison of the macroscopic statistical models, the estimated values of the fracture toughness characteristic parameters determined by the above methods are summarized in .
Table 7. HAZ fracture toughness characteristic parameters
It can be seen from that the HAZ, which is the weak link of the welded structure, has a reference temperature value of less than −100°C in both the as-welded state and the heat-treated state, indicating that the material has a high toughness reserve. In addition, the improvement in the reference temperature after heat treatment is not significant. Even after the post-weld heat treatment, the T0 values obtained by the SPE method and the SINTAP method were even decreased by 5.6°C and 20.7°C, respectively, evidently indicating that the brittle fracture resistance exhibited a deterioration phenomenon. It appears that the PWHT of the CAP1400 steel containment is neither effective nor necessary, and the post-weld heat treatment can be eliminated in the case of a high toughness reserve in the as-welded state. The experimental data and analysis methods in this paper can support the code case N-841, which provides data support for the SA738Gr.B steel without the post-weld heat treatment thickness from 44 mm to 55 mm.
6. Conclusion
The low temperature fracture toughness of the Chinese-produced SA738Gr.B steel HAZ in both states was tested. Problems caused by MC method for inhomogeneous material were analyzed. Several methods for predicting the fracture toughness of HAZ in the DBT region were used and applicability evaluations were performed. The main conclusions are as follows:
The MC method is directly used to predict the fracture toughness of HAZ in the DBT interval, which may lead to non-conservative estimates. The reason is that the data points are seriously deviated from the control area of the three-parameter Weibull distribution in the low temperature range especially.
The analysis results based on each method show that HAZ, which is the weakest link of SA738Gr.B steel welded joint, has a high toughness reserve. The reference temperatures T0 in the AW and PWHT states obtained by the BMC method were −128.20°C and −144.79°C, respectively. After heat treatment, the improvement in fracture toughness is not significant.
From the prediction accuracy and the envelope of the heterogeneous fracture toughness data point, it is shown that the BMC method is more suitable for characterizing the fracture toughness of bimodal inhomogeneous materials, such as HAZ of SA738Gr.B。
The reference temperature T0 in the PWHT state obtained by the SPE method and the SINTAP method is increased by 5.6°C and 20.7°C, and the brittle fracture resistance after heat treatment tends to deteriorate. SINTAP screening criteria works well for screening, and no less than 12 data points can give a qualitative estimate of the inhomogeneity, but do not give an accurate degree of inhomogeneity. SINTAP’s estimate of the reference temperature is a lower-tail estimate, considering the more brittle components in the material, which is a conservative estimate.
HAZ fracture toughness tests and reference temperature T0 analysis showed that PWHT does not significantly change material properties of HAZ, evidently indicating that PWHT is neither effective intended to improve fracture toughness nor necessary for this material and should be reasonably be exempted for the material having a thickness up to 55 mm for containment vessel, just in the same way as allowed for the material having a thickness up to 44 mm in the current code.
The three macro statistical models discussed in this paper have their own advantages and disadvantages. Depending on the purpose of use, it is recommended to use the BMC method for more accurate evaluation. SINTAP can be used as a method of quantitative heterogeneity, but requires a large amount of experimental data. SPE can be used as an engineering method, which is relatively simple and easy to implement.
Nomenclature
| CV | = | Containment vessel |
| Pf | = | Cumulative failure probability |
| B | = | Specimen thickness |
| B0 | = | Reference specimen thickness |
| KJc | = | Fracture toughness |
| K0 | = | The Weibull distribution scale parameter is equal to the fracture toughness value when Pf is 63.2% |
| Kmin | = | Threshold fracture toughness |
| T | = | Experimental temperature |
| T0 | = | Reference temperature |
| KJc(med) | = | Median fracture toughness |
| KJc(limit) | = | Upper limit of fracture toughness |
| i | = | The sequence number of fracture toughness from small to large |
| δi | = | Censoring constant |
| PWHT | = | Post-weld heat treatment |
| fc | = | Probability density function |
| Sc | = | Survival function |
| b0 | = | Remaining ligament length |
| β | = | Sample size uncertainty factor |
| MC | = | Master curve |
| DBT | = | Ductile-brittle transition |
| C(T) | = | Compact tension |
| SINTAP | = | European method for assessing the integrity of industrial structures |
| SPE | = | Single point estimation |
| HAZ | = | Heat-affected zone |
| T0SINTAP | = | Reference temperature by SINTAP |
| T0SP | = | Reference temperature by single point estimation |
| T0BMC | = | Reference temperature by bi-modal master curve |
| BMC | = | Bi-modal master curve |
| MML | = | The maximum likelihood |
| N | = | Total number of fracture toughness data |
| r | = | Number of valid specimens |
| E | = | Elastic modulus |
| ν | = | Poisson’s ratio |
| AW | = | As welded |
| r | = | Number of uncensored data |
Disclosure statement
No potential conflict of interest was reported by the authors.
References
- Hayashi T, Kim CC, Kumagai K, et al. Technical basis for the exemptions to mandatory post weld heat treatment (PWHT) of SA-738 grade B for sec. III div. 1 subsection NE application. ASME 2017 Pressure Vessels and Piping Conference; 2017 Jul 16–20; Hawaii, USA.
- Zhang JB, Gu Y, Liu WH. Discussion on exemption from PWHT of SA-738 Gr.B steel for nuclear power plant steel containment vessel. Hot Working Technol. 2017;46:230–232.
- ASME boiler and pressure vessel code, code case N-841. Exemptions to mandatory PWHT of SA-738 grade B for lass MC applications, section III, division 1. American Society of Mechanical Engineers; 2014.
- Sang YS, Woo KJ, Hwang B, et al. Fracture-toughness analysis in transition-temperature region of three American Petroleum Institute X70 and X80 pipeline steels. Metall Mater Trans A. 2009;40(4):867–876.
- Wallin K. Master curve analysis of the “Euro” fracture toughness dataset. Eng Fract Mech. 2002;69(4):451–481.
- Gui L, Xu T, Shou B, et al. Estimation of Q345R fracture toughness based on master curve. ASME 2017 Pressure Vessels and Piping Conference; 2017 Jul 16–20; Hawaii, USA.
- Chen Z, Pan J, Jin T, et al. Estimation of fracture toughness of 16MnDR steel using master curve method and Charpy V-notch impact energy. Theor Appl Fract Mec. 2018;96:443–451.
- Tobita T, Nishiyama Y, Ohtsu T, et al. Fracture toughness evaluation of reactor pressure vessel steels by master curve method using miniature compact tension specimens. J Pressure Vessel Technol. 2015;137(5):051405.
- Bhowmik S, Chattopadhyay A, Bose T, et al. Estimation of fracture toughness of 20MnMoNi55 steel in the ductile to brittle transition region using master curve method. Nucl Eng Des. 2011;241(8):2831–2838.
- Wallin K, Nevasmaa P, Laukkanen A, et al. Master curve analysis of inhomogeneous ferritic steels. Eng Fract Mech. 2004;71(16):2329–2346.
- Scibetta M. Master curve analysis of potentially inhomogeneous materials. Eng Fract Mech. 2012;94:56–70.
- Moskvichev E. Fracture assessment of cracked welded structures considering the heterogeneity of welded joints. Procedia Mater Sci. 2014;3:556–561.
- Kim J, Kim M, Choi K, Lee B.Fracture toughness assessment of SA508 Gr 3 steel for KSNP RPV using conventional and Bimodal Master Curve approaches. ASME 2014 Pressure Vessels and Piping Conference; 2014 Jul 20–24; California, USA.
- Choi SB, Choi S, Choi JB, et al. Enhancement of master curve method for inhomogeneous material. J Mech Sci Technol. 2012;26(9):2727–2734.
- Webster S. Special issue on structural integrity assessment procedures for European industry (SINTAP). Eng Fract Mech. 2000;67(6):479–480.
- Pisarski HG, Wallin K. The SINTAP fracture toughness estimation procedure. Eng Fract Mech. 2000;67(6):613–624.