
 ?Mathematical formulae have been encoded as MathML and are displayed in this HTML version using MathJax in order to improve their display. Uncheck the box to turn MathJax off. This feature requires Javascript. Click on a formula to zoom.
ABSTRACT
Neutron total and capture cross sections of 243Am have been measured in Accurate Neutron Nucleus Reaction measurement Instrument at Materials and Life Science Experimental Facility of Japan Proton Accelerator Research Complex with a neutron time-of-flight (TOF) method. The neutron capture cross section in the energy region from 10 meV to 100 eV was determined using an array of Ge detectors. Three samples with different activities were used for measurements of the capture cross section. The neutron total cross section in the energy region from 4 meV to 100 eV was measured using Li-glass detectors. Derived cross-section value at neutron energy of 0.0253 eV is b for the capture cross section and
b for the total cross section.
1. Introduction
Nuclear data for minor actinides (MAs) and long-lived fission products are necessary for burn-up analyses of nuclear fuels, improving the design and performance of advanced nuclear reactors and the nuclear transmutation [Citation1–Citation4]. In particular, 243Am is one of the important MAs in the study of nuclear transmutation because 243Am contributes most to the total radiotoxicity of the spent fuel for thousands of years because of its long half-life (7370 yr). The cross section of 243Am(n,) is also important because it produces 244Cm, which is a strong neutron emitter, and also whose yield determines the productions of higher-mass Cm isotopes, e.g. 245Cm (8500 yr) and 246Cm (4760 yr).
The capture and transmission differential data available in the literature for 243Am are summarized in . The latest data are given by Mendoza et al. in 2014 measured at the neutron time-of-flight (n_TOF) facility at CERN [Citation5]. The result covered the neutron energy region from 0.7 eV to 2.5 keV and did not cover the thermal energy region. There are one capture cross section measurement by Hori et al. [Citation6] and two transmission measurements by Berreth et al. [Citation7] and Cote et al. [Citation8] covering the thermal energy region. However, these two transmission measurements were presented in 1970s. The experimental data available for the evaluation of the 243Am capture cross-section at thermal energies are summarized in . As it can be observed, the data are scattered mainly between 75 and 85 barns, and are in some cases incompatible. There is no clear choice about which thermal capture cross section should be used from the point of view of the data.
Table 1. Differential capture and transmission measurements of 243Am
Table 2. Thermal capture cross sections provided by different integral measurements and evaluations of 243Am
To improve the situation, capture cross section of 243Am was measured in Accurate Neutron Nucleus Reaction measurement Instrument (ANNRI) at Materials and Life Science Experimental Facility (MLF) of Japan Proton Accelerator Research Complex (J-PARC) with a neutron time-of-flight (TOF) method. Because capture cross section of 243Am is more than 90% of total cross section at thermal energy, total cross section of 243Am was also measured to check consistency of measured cross sections. Because uncertainty due to the sample mass is one of the most important factors contributing to the discrepancies of measured cross section data [Citation26,Citation27], the activities of the samples were determined accurately with a calorimetric method and a gamma-ray spectroscopic method [Citation28].
The outline of the neutron TOF experiment facility, ANNRI, and information of the samples are described in Section 2. The measurement of capture cross section is presented in Section 3, followed by the neutron total cross section measurement in Section 4. At the end, conclusion is given in Section 5.
2. Facilities and samples
2.1. ANNRI at J-PARC
The experiments with the neutron TOF method were performed in ANNRI. Pulsed neutrons were produced in spallation reactions in the mercury target of the MLF by 3-GeV pulsed protons from the 3-GeV rapid cycling synchrotron in J-PARC [Citation29]. Produced neutrons were slowed down in a supercritical hydrogen moderator and transported to ANNRI, which is designed for neutron TOF measurements.
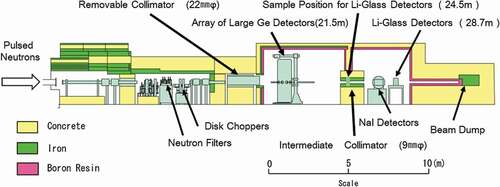
Layout of ANNRI is shown in . Two gamma-ray spectrometers and one neutron detector system are installed in ANNRI. In this measurement, an array of large Ge detectors installed at flight length of 21.5 m and Li-glass detectors installed at flight length of 28.7 m were used. In ANNRI, neutron collimators, resonance filters, and chopper systems are installed to deliver an intense neutron beam to detector systems with good quality [Citation30]. The neutron chopper systems were used to reduce influence of slow neutrons which were produced in the previous proton pulse and overlapped with neutrons produced in the latest pulse (frame-overlap neutrons). More details about the beam line are given in Ref [Citation37].
Figure 1. Vertical cross sectional view of ANNRI.
In the experiments, J-PARC was operated under 25-Hz repetition and under a proton beam power of 200 kW. The proton intensity per shot was stable within 1% in FWHM. Each incident proton pulse consisted of protons.
2.2. Samples
For the experiments, three 243Am samples with nominal activities of 60, 120, and 240 MBq were prepared. The samples were manufactured by V.G. Khlopin Radium Institute in Russia. Americium dioxide (AmO2) powder was mixed with Y2O3 powder and pressed into pellets with diameter of 10.0 0.1 mm and a thickness of 0.5
0.1 mm, according to the specifications provided by the manufacturers. The pellets were encapsulated in Al containers with a diameter of 22 mm and a thickness of 0.1 mm. Similarly, a ‘dummy sample’ which only contains Y2O3 powder without AmO2 powder was prepared. The weight of Y2O3 powder of each sample is shown in .
Table 3. Characteristics of the samples
The activities of the Am samples were determined with a calorimetric method and gamma-ray spectroscopic method independently [Citation28]. In the calorimetric method, decay heat of the 243Am samples was measured accurately by using the calorimeter with a precision of 200nW, and thus activities of the samples were obtained accurately with uncertainties less than 0.45%. For the gamma-ray spectroscopic method, accurate gamma-ray emission probabilities of 243Am and 239Np were determined by combination of gamma- and alpha-ray spectroscopy with uncertainties less than 1.2% and the obtained gamma-ray emission probability of 277.60 keV from 239Np (14.34 ± 0.16%) was used for activity determination [Citation31]. The determined activities of the 243Am samples were obtained with uncertainties less than 2%. The activities of the 243Am samples obtained by the two different methods are shown in . Their results were in good agreement. Because the results by the calorimetric method have smaller uncertainties, they were used in this paper.
To make detailed isotopic and impurity analyses, liquid sample from the same batch of the samples was also supplied by the manufacturers. Isotopic and impurity abundances were determined by thermal ionization mass spectrometry (TIMS) and alpha-ray spectrometry [Citation32]. The results are described in . The determined isotopic purity of 243Am was 97.67% with contamination of 2.29% and 0.04% by 241Am and 244Cm, respectively. In this paper, the results with TIMS were used for Am isotopes, and those by alpha-ray spectrometry were used for 244Cm.
Table 4. Isotopic and impurity abundances of 243Am sample
3. Neutron capture cross section measurements
3.1. Experimental procedure
For the neutron capture cross-section measurements, the array of Ge detectors was used to measure emitted gamma-rays from neutron capture reactions. The array of Ge detectors is composed of two cluster-Ge detectors, eight coaxial-Ge detectors and anti-coincidence shields around each Ge detector as shown in Ref [Citation33]. Each cluster Ge detector consists of seven Ge crystals. The positions of the cluster Ge detectors were arranged so that the distance between the front surface of each detector and the center of the sample position was 175 mm. Lead shield with a thickness of 5 cm was placed in front of each cluster Ge detector to attenuate intense decay gamma-rays form 243Am and 239Np, which is daughter nuclide of 243Am. In the measurements, two cluster Ge detectors were used, but the coaxial Ge detectors were not used because they suffered from severe electrical noise. The signals from the Ge detectors were analyzed using CAEN V1724 (14bit 100 MHz) module with a digital pulse processing software, DPP-PHA [Citation34]. A pulse height and a TOF were recorded in ‘event-by-event’ mode with the module.
The neutron beam was collimated to diameters of 22 mm at the sample position. To reduce the scattering of neutrons by air, helium gas ran through the beam duct.
In the capture cross-section measurement, the 60-, 120-, and 240-MBq 243Am samples were used. Each sample was put in a bag made of fluorinated ethylene propylene (FEP) films and attached to a sample holder. The sample holders were made of polytetrafluoroethylene and shaped into a 50 mm × 70 mm rectangular frame, which was made much larger than the size of the collimated neutrons with a diameter of 22 mm [Citation30]. To estimate influence due to scattered neutrons, a carbon sample was used in Ref [Citation26]. However, an enriched 208Pb sample with a diameter of 5.0 ± 0.1 mm and a weight of 170.2 ± 0.1 mg was used in this experiment because 208Pb and 243Am has similar mass number and capture cross section of 208Pb is much lower than that of carbon. For the background estimation, measurements with the dummy sample and the FEP bag without any sample (Blank) were also carried out. To obtain the energy dependence of the incident neutron flux, measurement with an enriched 10B sample with a diameter of mm and a weight of
mg was also carried out.
The measuring times are summarized in .
Table 5. Measuring times
3.2. Data analysis
3.2.1. Pulse height spectra
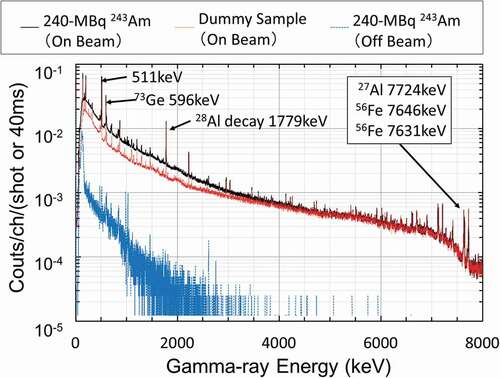
Two prompt gamma-ray pulse-height spectra with the 240-MBq 243Am sample and the dummy case are shown in . The spectra were measured with one of the 14 Ge crystals. They were normalized with the number of incident proton pulses. A decay gamma-ray pulse-height spectrum per repetition period of 40 ms (without neutron beam) is also shown in the figure. A difference between the 243Am and dummy spectra appears clearly below the Q-value of 243Am(n,) reaction (5363 keV). However, almost all the intense photo peaks shown in the spectrum of the 204-MBq 243Am sample are also observed in the spectra of dummy case and the decay gamma-ray. Prompt gamma rays from 27Al (n,
)28Al, 56Fe (n,
) 57Fe and 73Ge (n,
) 74Ge reactions, and decay gamma rays from 28Al are observed in both the gamma-ray spectra of the 243Am sample and the dummy sample. Peaks originating from 243Am neutron-capture events were hidden under the intense background gamma rays.
Figure 2. Prompt gamma-ray pulse-height spectra of the 240-MBq 243Am sample, the dummy case, and a decay gamma-ray pulse-height spectrum from the 240-MBq 243Am sample without neutron beam measured with one of the cluster crystals. Each spectrum was normalized with the number of incident proton beam shots.
3.2.2. Raw TOF spectra
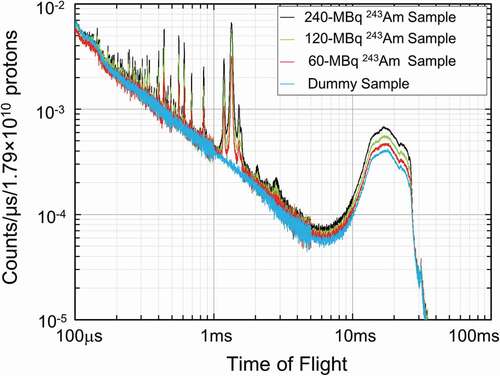
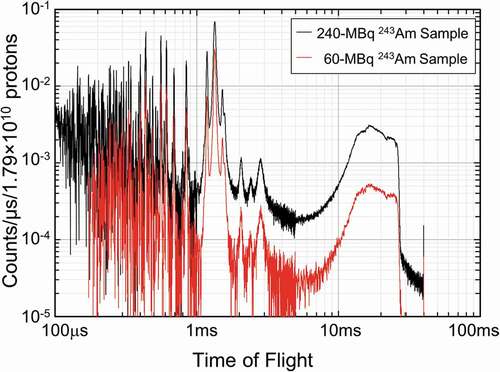
As shown in , although the lead shield with a thickness of 5 cm was placed, intense decay gamma-rays form 243Am and 239Np were observed, especially under 200 keV. In the energy range over 6000 keV, which is higher than the neutron separation energies of 244Am (5363.7 keV [Citation35]), many intense photo peaks due to background gamma-rays are observed. In the analysis, to improve the signal-to-noise ratio, one gate from 600 keV to 6000 keV was applied to derive TOF spectra. Gated TOF count rate spectra per protons of the 240-, 120-, and 60-MBq 243Am samples and the dummy sample are shown in . The TOF spectra were measured with one of the 14 crystals. In the spectrum of the 243Am samples, not only resonances of the 243Am but also the resonances of 241Am (2.82 ms = 0.305 eV, 2.06 ms = 0.572 eV) and 240Pu (1.519 ms = 1.056 eV) are also clearly observed. Therefore, to obtain neutron capture cross sections of 243Am, the contributions from these impurities must be evaluated and subtracted. The broad peak around 20 ms is due to the neutron bump thermalized in the liquid hydrogen in the moderator.
Figure 3. Gated TOF spectra per protons of the 243Am samples and the dummy sample. The spectra were measured with one of the 14 crystals.
3.2.3. Dead time correction
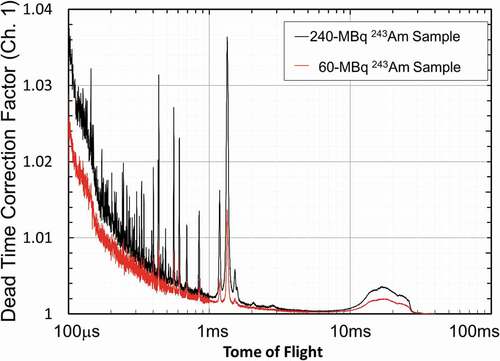
Dead-time correction was applied to the gated TOF spectra with extended dead-time model using a dead time of 5.67 ± 0.02 s (567 ± 2 ch.) per event due to the settings of the CAEN V1724 module. shows a typical time dependence of the calculated dead-time correction factor for one of the Ge crystals. The dead time correction factors at strongest resonance peak of 243Am (
) were 4.0% for the 240-MBq 243Am sample, 3.2% for the 120-MBq sample, and 1.8% for the 60-MBq sample. Those at neutron energy of 0.0253 eV were less than 0.4%. The uncertainties of the correction were calculated using the uncertainty of the dead time per event. This dead-time correction was done for each crystal because event rates depend on the positions of the crystals.
Figure 4. Typical time dependences of the dead-time correction factor for the measurements of the 240-MBq 243Am sample and the 60-MBq 243Am sample.
3.2.4. Background subtraction
In this analysis, we separately estimated backgrounds caused by frame overlapping neutrons and decay γ-rays, sample independent background, backgrounds due to aluminum container and Y2O3 included in the 243Am samples, and the backgrounds due to scattered neutrons by 243Am.
The backgrounds caused by frame overlap neutrons and decay gamma-rays were estimated by fitting the TOF spectra in the TOF region from 37 to 40 ms by using the following equation (an exponential decay plus constant function):
where t is TOF and a, b, and are fitting parameters. The fitted function was moved back in time by 40 ms. This fitting was done for each sample and crystal. In this estimation, propagations of fitting uncertainties were taken into account.
The sample-independent background is represented by the TOF spectrum of blank. After subtracting the backgrounds caused by overlapping neutrons and decay γ-rays, the sample-independent background was subtracted from each spectrum.
The backgrounds due to aluminum container and Y2O3 included in the 243Am samples were derived from the spectrum of the dummy sample considering differences in Y2O3 masses between the 243Am samples and the dummy samples.
There still remains the background due to scattered neutrons by 243Am. This background was estimated by the spectrum of the 208Pb sample by considering the differences in the elastic-scattering cross section and the area densities of the samples. The subtraction procedure was the same manner as that described in Ref [Citation26]. The elastic-scattering cross section was taken from the JENDL-4.0. The difference of diameters between the 243Am samples and 208Pb sample was not considered, because the diameter of the neutron beam at the sample position, 22 mm, was enough large in comparison to the diameters of the samples.
The estimations and subtractions of the backgrounds were done separately for each crystal, because the backgrounds depend on the positions of the crystals. On the other hand, procedures in the following steps are independent of the positions. Therefore, from here on, all 14 TOF spectra for each sample were summed up. The deduced net spectra of the 243Am samples are shown in .
Figure 5. Deduced net spectra of the 240-MBq 243Am sample and that of the 60-MBq 243Am sample.
The TOF parameters for the neutron energy calibration were derived from a TOF spectrum of a gold sample and the resonance energies of gold listed in JENDL-4.0.
3.2.5. Correction for the neutron self-shielding and multiple-scattering effects
Corrections for the neutron self-shielding and multiple-scattering effects in the 243Am samples were made by using the PHITS code [Citation36]. The shape, dimension, isotope abundances, and weight of the samples were taken into account in the calculation. shows the determined correction factors of the 243Am samples. The calculated correction factors at the strongest resonance were 1.29, 1.74, and 2.49 for the 60-, 120-, and 240-MBq 243Am samples, respectively.
Figure 6. Correction factors for neutron self-shielding and multiple scattering on the 240-MBq 243Am sample and the 60-MBq 243Am sample.
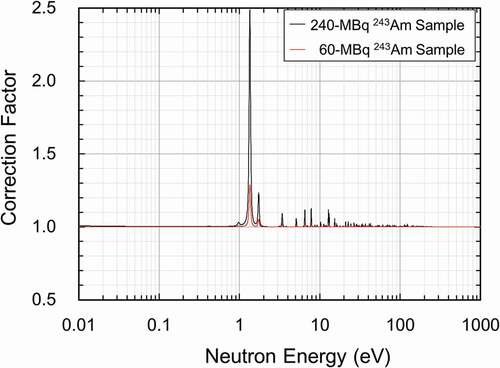
The calculated correction factors strongly depend on the areal densities of the 243Am. The areal densities were calculated from the activities of the samples (67.3 ± 0.3 MBq, 155.8 ± 0.3 MBq, 281.8 ± 0.3 MBq), half-life of 243Am (7357 ± 23y) [Citation38], and diameter of the sample pellet (10.0 ± 0.1 mm). The uncertainties of the areal densities mainly come from the uncertainty of the pellet diameter. Therefore, uncertainties of the correction factors were derived from the uncertainty of the pellet diameter. To derive the uncertainties, correction factors for virtual samples were calculated. The virtual samples have same activities as the real samples and have pellets with diameter of 9.9 mm. Differences between the correction factors for the real samples and those for the virtual samples were considered as the uncertainties due to the correction.
3.2.6. Calculation of relative yield
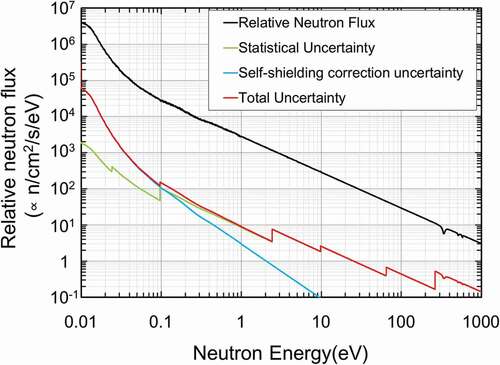
In the present analysis, the incident neutron energy spectrum was determined by measuring 478-keV γ-rays emitted in 10B(n,αγ) reactions. TOF spectra gated on the 478-keV photo peak area were made for the 10B, 208Pb, and blank measurements. Backgrounds were estimated and subtracted in the same manner as the 243Am samples. The 10B(n,αγ) cross section listed in JENDL-4.0 was used to convert the detected counts to the number of the incident neutrons. The correction of the neutron self-shielding and multiple scattering was applied. The uncertainty of the corrections was deduced from the uncertainties of the 10B sample diameter. The obtained relative neutron flux and uncertainties are shown in .
Figure 7. Relative neutron spectrum obtained using the 10B(n,)7Li reactions and uncertainties (total, statistical uncertainty, uncertainty due to self-shielding and multiple-scattering correction).
The relative capture yields of the 243Am samples were calculated from the deduced net spectra of the 243Am samples shown in , the neutron self-shielding and multiple-scattering correction factors shown in , and the averaged neutron flux shown in .
3.2.7. Absolute capture cross section at 1.356 eV resonance
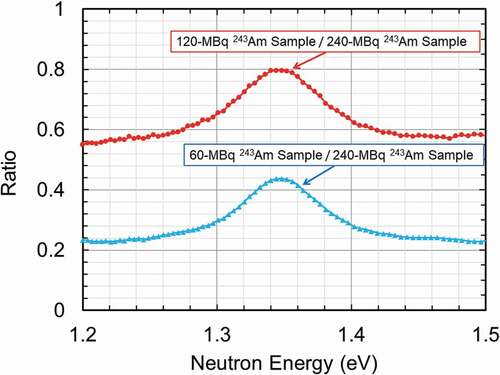
Absolute capture cross section at the 1.356 eV (= 1.34 ms) resonance was derived by taking ratios of the deduced capture yield before correction for the neutron self-shielding and multiple-scattering effects as shown in .
In the measurements, capture yield of 243Am, , is described as follows:
( 241Am, 244Cm, Al, Y, O),
where is neutron energy,
is correction factor due to multiple scattering,
is neutron flux,
is an averaged detection efficiency of the array of Ge detectors for neutron capture reactions of 243Am,
and
are capture, elastic scattering and fission cross section of 243Am,
is areal density of 243Am,
is total cross section of nuclide x, and
is areal density of nuclide x. Because capture cross section is by 1000 times larger than fission cross section, influence due to fission events was negligible. In this calculation,
was also negligible, because the products of the total cross sections and the areal densities for 241Am, 244Cm, Al, Y, and O are much smaller than that for 243Am. Therefore, at the resonance, EquationEquation (2)
(2)
(2) is described as follows:
Using EquationEquation (3)(3)
(3) , the ratios of the capture yields of the 60-MBq and 120-MBq samples to that of the 240-MBq sample,
and
, are described as:
As shown in EquationEquations (4(4)
(4) ), by taking ratios of capture yields of the samples, neutron intensity and detection efficiency of the spectrometer are cancelled out.
The correction factors due to multiple scattering, ,
, and
were calculated with PHITS. The calculated values at the top of the resonance were 1.006, 1.007, and 1.005 for the 60-, 120- and 240-MBq 243Am samples, respectively. The areal densities (
,
, and
) were obtained from the activities of the samples, half-life of 243Am (7357 ± 23y) [Citation38], and diameter of the samples (10.0 ± 0.1 mm). The ratio of the capture yields between the samples,
, and
is obtained from the measurements as shown in . Therefore, in EquationEquations (4
(4)
(4) ), all the parameters except for
and
are known.
is obtained from EquationEquation (4)
(4)
(4) . Absolute neutron capture cross sections of 243Am around the 1.356 eV resonance,
, were obtained by subtracting the elastic scattering cross section data in JENDL-4.0 (
).
Figure 8. Ratios of the capture yields of the 120-MBq 243Am sample and the 60-MBq 243Am sample to that of the 240-MBq 243Am sample.
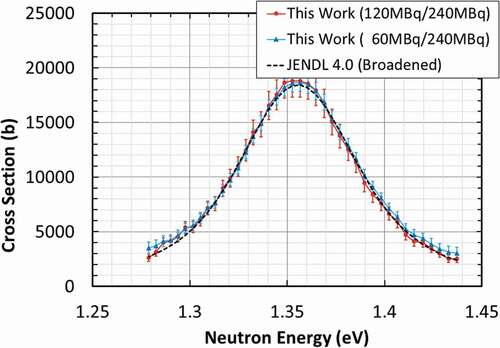
shows the obtained capture cross sections together with values of JENDL-4.0 at 300 K (broadening with the resolution function of ANNRI [Citation39]). The obtained cross sections are consistent with the evaluated data in JENDL-4.0.
Figure 9. Determined neutron capture cross sections of 243Am around the 1.356 eV resonance together with values of JENDL-4.0 for temperature of 300 K (broadened with the resolution function).
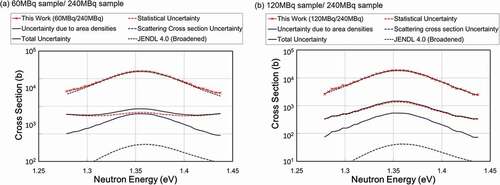
In this analysis, the statistical uncertainty, the uncertainty due to area densities, and the uncertainty of the evaluated elastic scattering cross section were taken into consideration. The derived uncertainties are shown in . Because capture cross section is about 50 times larger than the elastic scattering cross section, influence due to the uncertainty of the evaluated elastic scattering cross section was much smaller than the other uncertainties. The main component of the uncertainty comes from the uncertainties of the areal densities. The uncertainties due to the areal densities of the 243Am samples were derived from the uncertainties of the sample activity, half-life of 243Am, and the diameter of the sample. The main component of the uncertainties due to the areal densities comes from the uncertainty of the sample diameter.
3.2.8. Evaluation of influence of fission events
At the 1.356-eV resonance of 243Am, capture cross sections of 243Am are much larger than fission cross sections of impurities in the sample, and influence of fission event is negligible. However, in the neutron energy region below 1 eV, the influences of fission events had to be evaluated and subtracted, because the samples contain 239Pu (see Sec. 3.2.10) and 239Pu has large fission cross section in this region. The ratio of the sensitivity of fission events to capture events for the array of Ge detectors had been deduced in Ref [Citation33]. The deduced ratio was 2.3 ± 1.0. This means fission events are 2.3 times more sensitive than capture events for the spectrometer. In this paper, the same value was used to estimate the influence of fission events.
3.2.9. Normalization
The relative yield of the 60-MBq 243Am sample calculated in Sec. 3.2.5. was normalized to the derived capture cross section shown in ) using the area of the 1.356 eV resonance. Contaminations of the fission events are small and negligible, because the neutron-capture cross section of 243Am at the resonance is about 2000 times larger than the fission cross section.
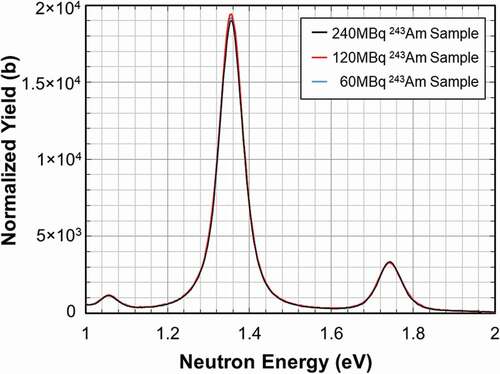
The relative yields of the 120-MBq and 240-MBq 243Am samples were normalized at the 1.744-eV resonance to the normalized yield of the 60-MBq 243Am sample because the influences of the self-shielding and multiple-scattering correction on the 120-MBq and 240-MBq 243Am samples for the 1.356 eV resonance were too large as shown in . The normalized yields from the measurements of the 243Am samples around 1.356 and 1.744-eV resonances are shown in . The three normalized yields agreed well.
Figure 11. Normalized yield from the measurements of the 243Am samples around 1.356- and 1.744-eV resonances.
Uncertainties due to the normalization were derived from the uncertainty of the derived absolute cross section shown in , the uncertainties due to the self-shielding and multiple-scattering correction, and the uncertainties due to the area of the resonances. The deduced uncertainties were 3.3% for the 60-MBq sample measurement and 3.9% for the 120-MBq and 240-MBq sample measurements.
Figure 10. Derived cross section, total uncertainty, statistical uncertainty, uncertainty due to area densities, and uncertainty due to values of evaluated elastic scattering cross section.
3.2.10. Evaluation of the abundance of Pu isotopes
shows the normalized yields from the measurements of the 60-MBq and 240-MBq samples, and comparison to contribution from 243Am and known impurities which was calculated using JENDL-4.0 and abundance ratios written in .
Figure 12. The normalized yields from the measurements of the 240-MBq samples; comparison to the contribution from 243Am and Cm impurities and contribution from deduced impurities of 240Pu and 239Pu. The contributions were calculated using JENDL-4.0.
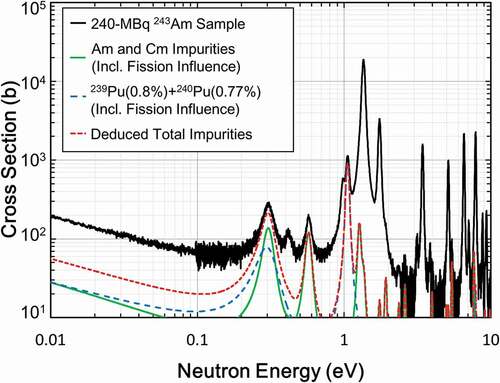
Although, the isotope 240Pu is not included in the isotope and impurity analyses given in , the 1.056-eV resonance of 240Pu is clearly observed. The abundance of 240Pu was derived using an area of the 1.056-eV resonance for the measurement of the 240-MBq sample and evaluated cross section in JENDL-4.0. The derived abundance of 240Pu was 0.77 ± 0.04%.
The resonance around 0.30 eV is observed in . There is large discrepancy between the calculated contribution and the normalized yields, considering that the 0.3-eV resonance comes from 241Am with abundance of 2.29% in the sample. On the other hand, 239Pu has a resonance at 0.296 eV and 239Pu is a granddaughter nuclide of 243Am. It is deduced that the samples contain 239Pu as impurity. The abundance of 239Pu was deduced using an area in the neutron energy range from 0.2 to 0.3 eV, abundance of 241Am listed in and evaluated cross section in JENDL-4.0. The deduced abundance of 239Pu was 0.8 ± 0.1%.
The uncertainties were derived from the uncertainties due to the area of the resonance. The deduced contribution from 239Pu and 240Pu is also shown in .
3.3. Results and discussion
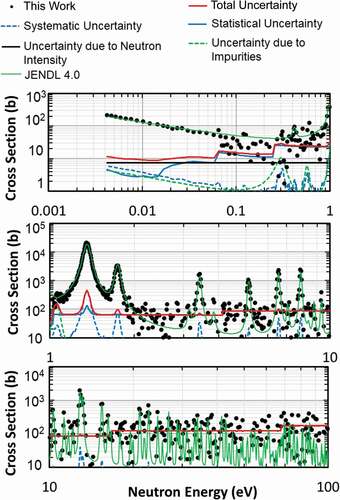
The normalized yields include influences of the impurities and fission events. Contributions from these influences were calculated using the resolution function of ANNRI and JENDL-4.0. Capture cross sections of 243Am measured with the three 243Am samples were derived by subtracting the influences in the neutron energy range of from 10 meV to 100 eV. The derived capture cross sections of 243Am are shown in , , and .
Figure 13. Derived cross section of the 243Am measured with the 60-MBq 243Am sample comparison to the uncertainties of the cross sections (total, statistical uncertainty, uncertainty due to normalization, uncertainty due to dead time correction, uncertainty due to self-shielding and multiple-scattering correction, uncertainty due to neutron flux, uncertainty due to the contribution of fission events, and uncertainty due to impurities).
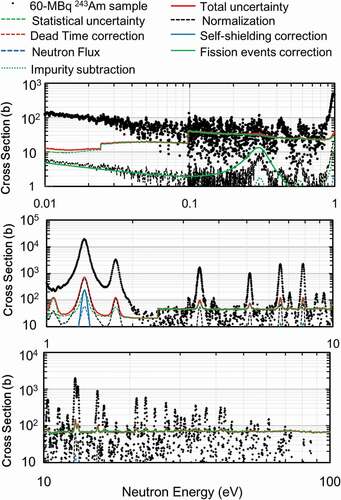
Figure 14. Derived cross section of the 243Am measured with the 120-MBq 243Am sample comparison to the uncertainties of the cross sections (total, statistical uncertainty, uncertainty due to normalization, uncertainty due to dead time correction, uncertainty due to self-shielding and multiple-scattering correction, uncertainty due to neutron flux, uncertainty due to the contribution of fission events, and uncertainty due to impurities).
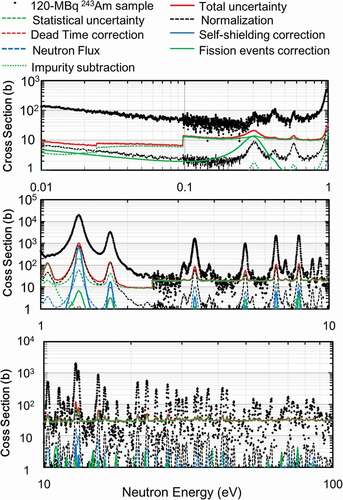
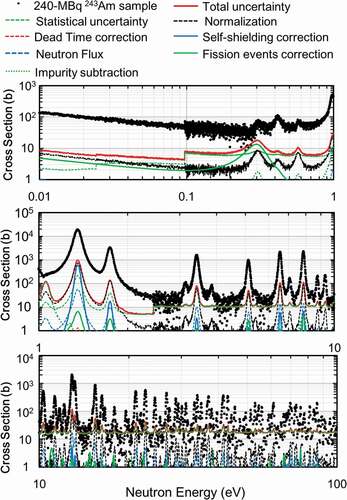
Figure 15. Derived cross section of the 243Am measured with the 240-MBq 243Am sample comparison to the uncertainties of the cross sections (total, statistical uncertainty, uncertainty due to normalization, uncertainty due to dead time correction, uncertainty due to self-shielding and multiple-scattering correction, uncertainty due to neutron flux, uncertainty due to the contribution of fission events, and uncertainty due to impurities).
In this analysis, the statistical uncertainty and the uncertainty due to normalization, the dead time correction, the self-shielding and multiple-scattering correction, the shape of relative neutron flux, the impurity contributions, and the subtraction of fission events were taken into account.
The uncertainties due to impurity subtraction were derived from the uncertainties of the abundances and the uncertainty of the evaluated nuclear data. The uncertainties due to fission events were derived from the uncertainties of the abundances, the uncertainty of the evaluated nuclear data, and the ratio of the sensitivity of fission events to the capture events.
The derived uncertainties are also shown in , , and . The details of these uncertainties at the thermal energy were summarized in . To reduce the statistical uncertainty, the data shown in were averaged over 10 points around neutron energy of 0.0253 eV.
Table 6. Details of uncertainties for the derived capture cross section of 243Am at neutron energy of 0.0253 eV
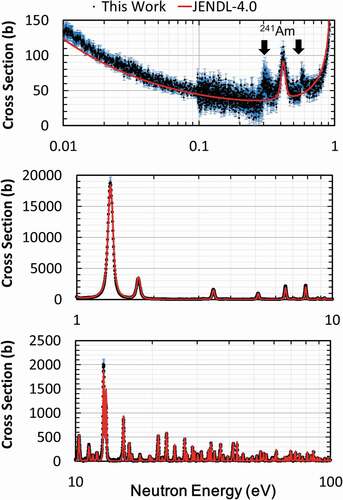
shows the obtained neutron capture cross section of 243Am using the 240-MBq sample with a comparison to evaluated value in JENDL-4.0. The obtained cross section of 243Am has small peak around 0.305 eV and 0.572 eV. These are the resonance peaks of 241Am. It was deduced that the evaluated data of 241Am given by JENDL-4.0 are underestimate at the resonances. Obtained cross-section values at neutron energy of 0.0253 eV were found to be ,
,
b. In neutron energy range below 0.1 eV, the present results are agreed with the result by Marie et al. [14], Hatsukawa et al. [15], and Gavrilov et al. [16] as shown in . However, the results are about 10% larger than the evaluated capture cross section of JENDL-4.0.
Figure 16. Obtained neutron capture cross sections of 243Am measured with the 240-MBq 243Am sample and a comparison to evaluated value in JENDL-4.0.
4. Neutron total cross section measurement
4.1. Experimental procedure
For the neutron total cross section measurement, a 6Li-glass scintillation detector installed at flight length of 28.7 m was used. The scintillator of the detector was GS-20 (6Li enrichment higher than 95%) manufactured by Saint Gobain with dimensions of 50 mm × 50 mm and a thickness of 1 mm. Additionally, to determine background, an enriched 7Li-glass detector was used. The scintillator of the 7Li-glass detector was GS-30 (7Li enrichment higher than 99.99%) manufactured by Saint Gobain with same size and chemical component of the 6Li-glass scintillator. The 7Li-glass detector was set on the upstream side of the 6Li-glass detector. The signals from the photomultipliers (HAMAMATSU:H7195) were analyzed using CAEN V1720 (12bit 250MHz) module with digital pulse processing software, DPP-CI. The module recorded a pulse height and a TOF in ‘event-by-event’ mode.
The 240-MBq 243Am sample and the dummy sample were used for the measurement. These samples were placed in the most downstream side collimator having a diameter of 9 mm as shown in . Flight length from the moderator to the sample position was 24.5 m. To reduce background due to intense gamma-rays from the moderator, lead filters with total thickness of 8.75 cm was placed on the neutron beam line. The total measuring time was about 16 h for the 243Am sample and about 8 h for the dummy sample. To estimate relative neutron intensities, an Al foil with thickness of 10 was set at the sample position of the array of large Ge detectors and prompt gamma-rays from 27Al (n,
) reactions were measured with the Ge detectors at the same time.
4.2. Data analysis
Measured pulse height spectra of the 243Am sample with the 6Li-glass and 7Li-glass detectors are shown in . A peak due to the 6Li(n,)3H reactions and double-hit and triple-hit peaks are clearly observed in the spectrum measured by the 6Li-glass detector. In the spectrum measured by the 7Li-glass detector, a peak due to the 6Li(n,
)3H reactions are also observed because the 7Li-glass scintillator contains slight amount of 6Li (0.01%). In this analysis, lower discrimination level at 1900 ch. was applied to derive TOF spectra.
Figure 17. Measured pulse height spectra of the 240-MBq 243Am sample with the 6Li-glass and 7Li-glass scintillation detectors.
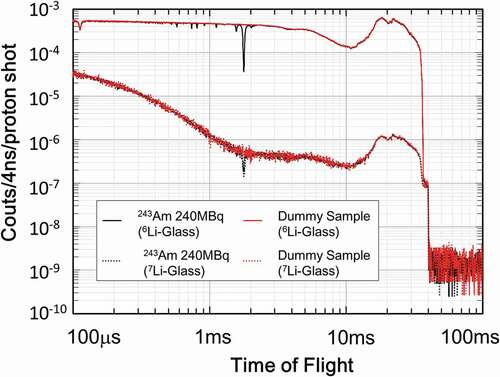
The gated TOF spectra of the 240MBq 243Am sample and the dummy sample with the 6Li-glass and 7Li-glass detectors are shown in . Each TOF spectrum was normalized with the number of proton beam shots. Some dips due to 243Am resonances are clearly observed in the gated TOF spectrum of the 243Am sample measured by the 6Li-glass detector. Because the 7Li-glass detector has slight sensitivity to neutron, the strongest resonance of 243Am is also observed in that measured with the 7Li-glass detector.
Figure 18. Gated TOF spectra of the 240-MBq 243Am sample and the dummy sample with the 6Li-glass scintillation detector and the 7Li-glass scintillation detector. Each TOF spectrum was normalized with the number proton beam shots.
Dead-time correction was applied to the gated TOF spectra using a fixed dead time of ns (
ch.) due to the settings of the CAEN V1720 module. The calculated dead time of the 243Am sample measurement with the 6Li-glass and 7Li-glass detectors are shown in . The dead time for the 6Li-glass detector was less than 2% in the TOF range from 100
to 40 ms. The uncertainties of the correction were calculated from the uncertainty of the dead time per event. The influences of the double-hit and triple-hit events were also corrected in this dead-time correction.
Figure 19. Dead time of the 240-MBq 243Am sample measurements with the 6Li-glass detector and the 7Li-glass detector.
After the dead-time correction, backgrounds due to frame overlap neutrons and background gamma rays were deduced. The TOF spectra were fitted by an exponential decay plus constant function in the TOF region from 37 to 40 ms, and the result was shifted to the left side by 40 ms. Backgrounds due to gamma-rays were derived from the TOF spectra measured by the 7Li-glass detector. Neutron TOF spectra of the 243Am sample and the dummy sample were derived by subtracting the backgrounds due to the frame overlap neutrons and the gamma-rays.
Relative neutron intensities were derived from the results of the Al foil measurements with the array of large Ge detectors. To eliminate the strong decay gammas from 28Al (1778 keV) and influence of gamma flash, the number of the events whose gamma-ray energies were over 2000 keV and neutron energies were less than 0.1 eV was used. By normalizing the neutron TOF spectra with the deduced relative neutron beam intensities, transmission ratio of the 243Am sample was obtained. The obtained transmission ratio is shown in .
Figure 20. Transmission ratio of the 240-MBq 243Am sample.
4.3. Results
Total cross section of 243Am sample was derived in the neutron energy range from 4 meV to 100 eV, using the transmission ratio of the 243Am sample and the areal density of the 243Am sample. The areal density was atoms/cm2 calculated from the activity of the sample (
MBq), half-life of 243Am (
y), and diameter of the sample (10.0
0.1 mm). The TOF parameters for the neutron energy calibration were derived from a TOF spectrum of a gold sample.
The cross section of 243Am sample includes influences of the impurities and the difference of Y2O3 mass between the 243Am 240 MBq sample and the dummy sample, as shown in . Contributions from these materials were calculated using the resolution function of ANNRI and the evaluated total cross sections in JENDL-4.0. Total cross section of 243Am was calculated by subtracting the contributions from the impurities. The derived total cross section of 243Am is shown in .
Figure 21. Derived total cross section of 243Am, and uncertainties of the cross sections (total, statistical uncertainty, systematic uncertainty, uncertainty due to neutron intensity, and uncertainty due to impurity subtraction).
In this analysis, the statistical uncertainty, systematic uncertainty, and uncertainty due to neutron intensity and impurities were discussed. The systematic uncertainty derived from the uncertainty of the areal density of the 243Am 240 MBq sample, i.e. the uncertainties of the sample activity, half-life of 243Am, and the diameter of the sample. The main component of the systematic uncertainty comes from the uncertainty of the sample diameter. The uncertainty due to neutron intensity derived from statistical uncertainties of the number of measured prompt gamma ray events by the array of large Ge detectors. The value was 0.09%. The uncertainty due to impurity subtraction was derived from the uncertainties of the abundances and the uncertainty of the evaluated nuclear data. The derived uncertainties are also shown in . The details of these uncertainties at the thermal energy were summarized in . The main component of the uncertainty comes from the uncertainty due to neutron intensity at neutron energy of 0.0253 eV and the systematic uncertainty at the strongest resonance (1.356 eV).
Table 7. Details of uncertainties for the derived total cross section of 243Am at neutron energy of 0.0253 eV
Obtained cross-section value, at neutron energy of 0.0253 eV, was found to be b. In neutron energy range below 0.1 eV, the present results are about 15% larger than the evaluated total cross section of JENDL-4.0. This under estimate of JENDL-4.0 is also shown in the results of capture cross-section measurement.
5. Conclusion
This work describes neutron capture and total cross-section measurements of the nucleus 243Am carried out at the ANNRI in J-PARC.
The neutron capture cross section of 243Am was measured with the array of Ge detectors using the three 243Am samples with different activities. Absolute capture cross section at the 1.356 eV resonance was derived by taking ratios of the capture yields. The neutron capture cross sections were determined in the neutron energy range from 10 meV to 100 eV by normalizing the relative yield to the derived absolute cross section at the 1.356-eV resonance. The determined capture cross sections at neutron energy of 0.0253 eV were found to be b. In the neutron energy range below 0.1 eV, the present results are about 10% higher compared to the evaluated capture cross section of JENDL-4.0.
The neutron total cross section of 243Am was measured with the 6Li and 7Li-enriched detectors. By using the enriched 7Li-glass scintillator with same size and chemical component of the enriched 6Li-glass scintillator, the backgrounds were evaluated. Total cross section of 243Am was derived in the neutron energy range from 4 meV to 100 eV. The determined cross section at neutron energy of 0.0253 eV was 101 ± 11 b. In neutron energy range below 0.1 eV, the present results are about 15% larger than the evaluated total cross section of JENDL-4.0.
Acknowledgments
Present study includes the result of ‘Research and Development for accuracy improvement of neutron nuclear data on minor actinides’ entrusted to the Japan Atomic Energy Agency by the Ministry of Education, Culture, Sports, Science and Technology of Japan (MEXT).
Disclosure statement
No potential conflict of interest was reported by the authors.
Related Research Data
References
- Salvatore M, Jacqmin R Uncertainty and target accuracy assessment for innovative systems using recent covariance data evaluations. WPEC-26, OECD NEA, 2008.
- Harada H. Meeting nuclear data needs for advanced reactor systems. WPEC-31, OECD NEA; 2014.
- Aliberti G, Palmiotti G, Salvatores M, et al. Nuclear data sensitivity, uncertainty and target accuracy assessment for future nuclear systems. Ann Nucl Energy. 2006;33:700.
- Iwamoto H, Nishihara K, Sugawara T, et al. Sensitivity and uncertainty analysis for an accelerator driven system with JENDL-4.0. J Nucl Sci Technol. 2013;50:856–862.
- Mendoza E, Cano-Ott D, Guerrero C, et al. Measurement and analysis of the 243Am neutron capture cross section at the n_TOF facility at CERN. Phys Rev C. 2014; 90: 034608.
- Hori J, Oshima M, Harada H, et al. Neutron capture cross section measurement on 243Am with a 4π Ge spectrometer. In Chiba S editor. Proceedings of the 2008 Annual Symposium on Nuclear Data (NDS 2008), JAEA-CONF 2009-004; Ricotti, Tokai (Japan); 2009. p. 123.
- Berreth JR, Simpson FB. Total neutron cross section of 243Am from 0.01 to 25 eV. USA. Idaho Nuclear Corp Reports. 1970;1407:66.
- Cote RE, Bollinger LM, Barnes RF, et al. Slow-neutron cross sections of Pu240, Pu242, and Am243. Phys Rev. 1959 Apr;114:505–509.
- Jandel M, Bredeweg TA, Stoyer MA, et al. Neutron capture and neutron‐induced fission experiments on americium isotopes with DANCE. AIP Conf Proc. 2009;1090:220–224.
- Weston LW, Todd JH. Neutron capture cross section of 243Am. Nucl Sci Eng. 1985;91:444–450.
- Wisshak K, Kappeler F. Neutron capture and fission cross section of 243Am in the energy range from 5 to 250 keV. Nucl Sci Eng. 1983;85:251–260.
- Belanova TS, Kolesov AG, Poruchikov VA, et al. Total neutron cross-section and neutron resonance parameters of Am-243 in the energy range 0.4-35. eV. Soviet At Energy. 1976; 40: 368.
- Simpson OD, Simpson FB, Harvey JA, et al. The neutron total cross section of americium-243. Nucl Sci Eng. 1974;55:273.
- Marie F, Letourneau A, Fioni G. Thermal neutron capture cross-section measurements of 243am and 242pu using the new mini-inca α- and γ-spectroscopy station. Nucl Instrum Meth Phys Res Section a. 2006 Jan;556:547–555.
- Hatsukawa YShinohara N, Hata K Measurements of neutron cross section of the 243Am(n,γ)244Am reaction. JAERI Conference Proceedings of the 1997 Symposium on Nuclear Data, 1997 Nov 27–28; Tokai (Japan). 1998; 98–003. p. 221–224
- Gavrilov VD, Goncharov VAIvanenko VV. Thermal cross sections and resonance integrals of fission and capture of 241Am, 243Am, 245Cm, 249Bk, and 249Cf. At Energ. 1976;41:185–190. [in Russian]
- Eberle SH, Robel W, Jung W, et al. Actinides project. First Half-Year Report, Germany: Karlsruhe Institute of Technology; 1971. Technical Report No. 1456 p. 45.
- Folger RL, Smith JA, Brown LC, et al. Foil measurements of integral cross sections of higher mass actinides. Proceedings of a Conference Nuclear Cross-Sections Technology; 1968 Mar 4–7; Washington. p. 1279.
- Bak MA, Krivokhatskii AS, Petrzhak KA, et al. Cross sections and resonance integrals for capture and fission in long-lived americium isotopes. At Energ. 1967;23:316–319. [in Russian].
- Ice CH Production of the Transplutonium Elements at Savannah River. USA: DuPont; 1966. Savannah River Reports, Report No. 66.
- Butler JP, Lounsbury M, Merritt JS. The neutron capture cross sections of 238Pu, 242Pu, and 243Am in the thermal and epicadmium regions. Can J Phys. 1957;35:147–154.
- Harvey BG, Robinson HP, Thompson SG, et al. Some pile neutron cross sections of isotopes of americium, berkelium, californium, and element 99. Phys Rev. 1954;95:581–582.
- Stevens CM, Studier MH, Fields PR, et al. Curium isotopes 246 and 247 from pile-irradiated plutonium. Phys Rev. 1954;94:974.
- Chadwick MB, Herman M, Obložinský P, et al. ENDF/B-VII.1 nuclear data for science and technology: cross sections, covariances, fission product yields and decay data. Nucl Data Sheets. 2011;112:2887–2996.
- Shibata K, Iwamoto O, Nakagawa T, et al. JENDL-4.0: A new library for nuclear science and technology. J Nucl Sci Technol. 2011 Jan;48:1–30.
- Hirose K, Furutaka K, Hara KY, et al. Cross-section measurement of 237Np (n, γ) from 10 meV to 1 keV at Japan proton accelerator research complex. J Nucl Sci Technol. 2013 Jan;50:188–200.
- Harada H, Ohta M, Kimura A, et al. Measurements of 241Am(n, γ) at J-PARC/MLF/ANNRI. Nucl Data Sheets. 2014;119:61–64.
- Terada K, Nakao T, Kimura A, et al. Technical developments for accurate determination of amount of samples used for TOF measurements. Proceedings of the International Conference on Nuclear Data for Science and Technology (ND2016); 2016 September 11– 16;Bruges (Belgium). EPJ Web of Conferences 2017;146. p. 03019.
- Maekawa F, Harada M, Oikawa K, et al. First neutron production utilizing J-PARC pulsed spallation neutron source JSNS and neutronic performance demonstrated. Nucl Instrum Meth Phys Res Section A. 2010; 620:159165.
- Kino K, Furusaka M, Hiraga F, et al. Measurement of energy spectra and spatial distributions of neutron beams provided by the ANNRI beamline for capture cross-section measurements at the J-PARC/MLF. Nucl Instrum Meth Phys Res Section A. 2011;626–627:58–66.
- Terada K, Nakamura S, Nakao T, et al. Measurements of gamma-ray emission probabilities of 241, 243Am and 239Np. J Nucl Sci Technol. 2016 Apr.;53:1881–1888.
- Shibahara S, Hori J, Takamiya K, et al. High precision analysis of isotopic composition for samples used for nuclear cross-section measurements. Proceedings of the International Conference on Nuclear Data for Science and Technology (ND2016); 2016 September 11– 16; Bruges (Belgium). EPJ Web of Conferences 2017;146. p. 03028.
- Kimura A, Fujii T, Fukutani S, et al. Neutron-capture cross-sections of 244Cm and 246Cm measured with an array of large germanium detectors in the ANNRI at J-PARC/MLF. J Nucl Sci Technol. 2012;49:708–724.
- Nakao T, Terada K, Kimura A, et al. Developments of a new data acquisition system at ANNRI. Proceedings of the International Conference on Nuclear Data for Science and Technology (ND2016); 2016 September 11– 16; Bruges (Belgium). EPJ Web of Conferences 2017;146. p. 03021.
- Firestone R. Table of Isotopes (1999 update with CD-ROM). 8th ed. ISBN 0471356336. New York: John Wiley & Sons; 1999.
- Sato T, Iwamoto Y, Hashimoto S, et al. Features of particle and heavy ion transport code system (PHITS) version 3.02. J Nucl Sci Technol. 55:684–690.
- Igashira M, Kiyanagi Y, Oshima M. Nuclear data study at J-PARC BL04. Nucl Instrum Meth Phys Res Section A. 2009;600:332–334.
- Aggarwal SK, Alamelu D, Shah PM, et al. Precise and accurate determination of the half-life of the α-decay nuclide 243Am using 241Am as the reference isotope. Nucl Instrum Meth Phys Res Section A. 2007;571:663–668.
- Kino K, Furusaka M, Hiraga F, et al. Energy resolution of pulsed neutron beam provided by the ANNRI beamline at the J-PARC/MLF. Nucl Instrum Meth Phys Res Section A. 2014;736:66–74.