
 ?Mathematical formulae have been encoded as MathML and are displayed in this HTML version using MathJax in order to improve their display. Uncheck the box to turn MathJax off. This feature requires Javascript. Click on a formula to zoom.
ABSTRACT
In order to measure the amount of nuclear materials in the fuel debris produced in the Fukushima Daiichi Nuclear Power Plant accident, we have designed a measurement system based on a Fast Neutron Direct Interrogation (FNDI) method. In particular, we have developed a fast response detector bank for fast neutron measurements by Monte Carlo simulations. The new bank has more than one order of magnitude faster response compared to the standard ones. We have also simulated the nondestructive measurements of the nuclear materials in homogeneously mixed fuel debris with various matrices which contain stainless steel (JIS SUS304), concrete, and various control-rod (CR) contents in the designed system. The results show that if the debris contains less than 1.0 vol% of CR component and more than 2.5 vol% of spent fuel component, the fissile materials in the debris can be measured by using the designed system.
1. Introduction
Fuel debris produced in the Fukushima Daiichi nuclear accident, March 2011, is considered to be a congealed mixture of molten reactor fuels, control rods (CRs) and construction materials of the reactors. In the decommissioning, material accountancy of the fuel debris will be required for a safeguard purpose. It is difficult to measure the fissile materials in the fuel debris since the debris emits high-dose radiation, and its constituents are generally unknown and also contain neutron absorbers from molten CRs.
In the Japan Atomic Energy Agency (JAEA), we have developed a fast neutron direct interrogation (FNDI) method which is expected to be a promising non-destructive assay technique for measuring the total amounts of nuclear materials (235U, 239Pu, and 241Pu) [Citation1–Citation5]. The FNDI method has been developed mainly for measuring the nuclear materials in waste drums and it is not known whether the method is applicable to the sample such as the fuel debris which contains the neutron absorber.
In this paper, we report on the design of a debris canister assay system (DCAS) which utilizes the FNDI method. We have developed a fast response detector bank and also simulated measurements of homogeneously mixed fuel debris with various matrices which contain various spent fuel (SF), stainless steel (JIS SUS304), concrete, and various CR contents with Monte Carlo code systems.
2. FNDI method
The FNDI method is one of Differential Die-Away (DDA) techniques which interrogate a sample with neutrons to induce fission and estimate the amounts of nuclear materials by measuring the induced prompt fission neutrons [Citation6]. In the techniques, the induced fission neutron counts are estimated from time distribution of the counts of neutrons detected in the detector banks which is insensitive to the thermal neutrons. The interrogation neutrons emitted by neutron generators are moderated rapidly and, in the time distribution, the component decays with a time constant of the bank while the induced fission-neutron component decays with the time constant which depends on a die-away time of the thermal neutrons with large fission cross-sections. The induced fission neutrons are distinguished from the interrogation neutrons by this difference. The conventional DDA techniques interrogate the sample with thermalized neutrons moderated in the measurement system such as internal walls [Citation7,Citation8]. In order to easily distinguish the induced fission neutron component from that of the interrogation neutron, the measurement system is constructed with materials such as graphite which make thermal neutron decay slow. Thus, the die-away time of the thermal neutrons in the sample is dominated by that of the measurement system. On the other hand, the FNDI method interrogates the sample with the fast neutrons and utilizes the moderation by the matrix for thermalization [Citation1]. Thus, the die-away time of the thermal neutron flux in the sample depends on the moderation and/or absorption effects of the sample matrix. By using the dependence of the die-away time on the sample matrix, the FNDI method can reduce the influence of the matrix on the measurements, compared with the conventional DDA techniques. To show the reduction of the influence of the matrix, a mathematical model of the system is formulated with approximations. shows a schematic drawing of the time distribution of neutron counts obtained in the FNDI measurement. If the sample contains the fissile materials, the time distribution of the neutron counts decays as a sum of two exponential functions and the measured data are fitted with a following equation to deduce the induced-fission neutron component;
Figure 1. Schematic of time distribution obtained in measurement by the FNDI method when the sample contains fissile materials.
where is the number of the neutron counts per unit time, t is an elapsed time; the first exponential term describes the interrogation-neutron component; the second exponential term describes the induced fission-neutron component and
is a background component.
In the FNDI method, by assuming the homogeneous matrix in the sample, time variation of the neutron detection events can be described as the following equation (detailed derivation is shown in Appendix);
where is the neutron source intensity,
is the detection efficiency of the detector bank for the fast neutrons from the neutron generator,
is the thermal-neutron flux generated by the moderation of the injected fast neutrons (since the moderation time is much shorter than the die-away time, instantaneous generation of thermal neutrons is assumed here),
is the detection efficiency for the fission neutrons from the sample,
is a velocity of the thermal neutrons,
is the number of neutrons emitted per fission, and
is a macroscopic fission cross-section,
is the decay constant depending on the structure of the detector bank,
is that of the sample region excluding the effect of multiplication by fission (
is the decay constant of the sample region) and
is the probability that the fission neutrons are moderated to the thermal neutrons without disappearing during moderation. Comparing the EquationEquations (1)
(1)
(1) and (Equation2
(2)
(2) ),
and
correspond to
and
. As shown in Appendix,
, where
is a macroscopic neutron absorption cross-section, and
stands for the effect of leakage. Substituting these values into EquationEquation (2)
(2)
(2) ,
and
become as follows:
In EquationEquation (4)(4)
(4) , the first, second, and third terms represent the effects of neutron absorption, leakage, and multiplication, respectively. The total count of induced fission-neutrons can be represented by integral of the second term in EquationEquation (3)
(3)
(3) ,
EquationEquation (5)(5)
(5) clearly shows that the induced fission neutron counts linearly depend on the die-away time
which reflects
and
of the sample as shown in EquationEquation (4)
(4)
(4) . Assuming
,
and
are constants,
which is determined by the amounts of the fissile materials can be obtained by dividing the induced-fission neutron counts by
. In the actual measurements, the fission components are evaluated with the following equation instead of EquationEquation (5)
(5)
(5) since the first and the third terms in the right-hand side of EquationEquation (3)
(3)
(3) cannot be distinguished by their time constants.
EquationEquation (6)(6)
(6) is not a linear function of
though it becomes EquationEquation (5)
(5)
(5) when
. In addition,
and
are not constant but depend on the sample, when the neutron moderating and absorbing power varies considerably in each sample. Therefore, EquationEquation (6)
(6)
(6) is not a simple function. However, it is confirmed experimentally that
varies power function of
[Citation5], and the FNDI method can reduce the influence of the matrix significantly by using this property.
3. Design of DCAS
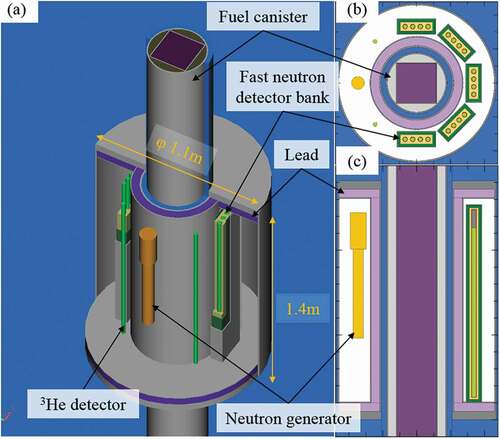
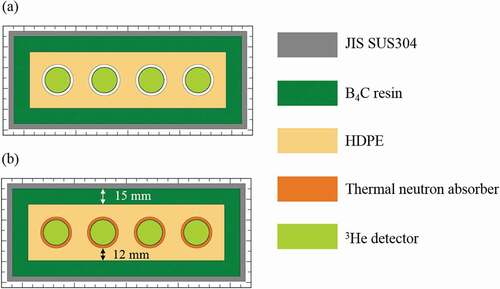
We assume that the debris is removed from the reactor by the so-called submersion method in which the debris is stored in canister and the canister is sealed under water to avoid diffusion of the powder debris. In this case, the measurement system should be installed in a spent-fuel pool near the reactor in order to set the canister to the DCAS easily. depicts a cutaway as well as cross-sectional views of the designed measurement system. Since the design of the canister for the debris has not yet been decided, we assume that the fuel debris is stored in a fuel canister which was most-used in the Three Mile Island accident [Citation9]. The fuel canister is 35.6 cm in diameter and 380 cm long. It has a 23.2 cm square cavity which can accommodate a full-size fuel assembly in the center of the canister. The cavity is surrounded by a thermal-neutron absorber containing boron to prevent re-criticality. Since the thermal neutron from an outer region of the canister cannot penetrate into the debris region, it is suitable structure for the FNDI measurement which reduces the influence of the matrix by utilizing the thermal-neutron die-away time in the sample. To withstand water pressure, we designed the system in a cylindrical shape with a through hole. Outer diameter of the system is 110 cm and height is 140 cm. It has a room for installing a neutron generator and detector banks. Lead shields are installed around the hole and at top and bottom sides of the room for γ-ray shielding. In the room, the D-T neutron generator and the detector banks are arranged to surround the canister between them. Although a D-D neutron generator is also applicable, here we adopted the D-T neutron generator which generally has more neutron intensity than that of the D-D neutron generator. The detector bank consists of 4 3He detectors, a high-density polyethylene (HDPE) block, and a B4C resin layer. The lead γ-ray-shield and the structure of the detector bank will be discussed in Sections 3.1 and 3.2, respectively. In measurements, the debris canister is inserted into the hole of the system and measured by scanning along the axial direction. The interrogation thermal neutron flux depends on the position of the fissile material in the canister. If the fissile material is located far side of the neutron generator, the interrogation thermal neutron flux is low. On the other hand, if fissile material is located near the side of the neutron generator the neutron flux is high. The detection efficiency of the detector banks for the induced fission neutron also depends on the position of the fissile material. As a result, total detection efficiency of the system for fissile materials, which is proportional to the product of the interrogation thermal neutron flux and the detection efficiency for the fission neutron, depends on the position of the fissile material. The difference in the detection efficiency contributes to the measurement uncertainty. To reduce the uncertainty caused by localization of the fissile materials, the canister is rotated during the measurement. The information related to the localization of the fissile materials can be obtained by synchronizing the data acquisition and the rotating system. The information will improve the measurement accuracy.
Figure 2. (a) Cutaway drawing of measurement system. (b) Horizontal and (c) vertical cross-sectional view of the system.
3.1. Optimization of lead shield thickness
For the measurement of the fuel debris, the γ-ray shield is required since the 3He detector causes misdetection under high γ-ray radiation dose-rate. Since a typical 3He detector that is commercially available and not customized to tolerate high-dose gamma-ray works below few Rad/h (few tens of mGy/h) [Citation10], we set the limit of γ-ray radiation air-dose-rate at the detector position as 20 mSv/h in this research. We adopted the lead as the shield material which is a typical γ-ray shield. Considering the influence on the FNDI measurement and the γ-ray shielding effect, the thickness of the lead shield was optimized by simulation. The thermal-neutron fluence in the debris region in the canister which causes the fission and the γ-ray air-dose-rate at the detector position were calculated by PHITS ver.2.82 [Citation11] with JENDL 4.0 nuclear data library [Citation12] (with the EGS mode for γ-ray) for several lead thicknesses around the through hole. In the simulation, 200 cm of the canister is modeled. An input energy-spectrum of the γ-ray was estimated from γ-ray-emitting nuclides obtained by burnup-calculation results with ORIGEN2 [Citation13] with JENDL 4.0 nuclear data library for one metric ton uranium (MTU) of initial enrichment of 3.70% 235U, average burnup of 25.9 Gwd/MTU, irradiation time of 965.25 days, cooling time of 10 years, and void fraction of 40%. To normalize intensity of the energy spectrum obtained in the unit of photons/s/MTU, we assume that 50 vol% of the cavity in the canister is occupied by SF which consists of nuclides obtained in the results of the calculation mentioned above and the remaining portion is porosity. Normalizing the intensity to per canister using mass of the SF which is calculated from the SF volume and the density of the materials, the γ-ray dose rate at the surface of the debris is obtained to be 171 Sv/h. In the simulation, considering commercially available devices, we assume the following conditions. The D-T neutron-generator emits 14 MeV neutrons at a rate of 109 neutron/s and measurement time is 100 s/sample; hence the source intensity was 1011 neutrons. The density of the HDPE is 0.95 g/cm3 and that of the B4C resin is 1.8 g/cm3 and the B4C resin contains 60 wt% natural abundance boron. The 3He detector is 1 m long and its diameter is 25.4 mm and filling pressure of the 3He gas is 4 atm. Although other types of neutron detectors which utilizes 10B(n,α) reaction is also applicable, in the simulation, we assumed the use of the 3He detectors which has little bit higher detection efficiency and is successfully used in former FNDI measurement system. shows the dependence of the γ-ray radiation air-dose-rate at the detector position and the thermal-neutron fluence in the debris region on the thickness of the lead shield. Circle symbols and the left side ordinate show the γ-ray radiation air-dose-rate. Square symbols and the right ordinate show the thermal-neutron fluence. The thermal-neutron fluence and the γ-ray air-dose-rate decrease as the lead shield becomes thicker. From the above results and considering cost, size, and weight, a thinner lead shield is preferable; hence the thickness of the lead shield was determined to be 5 cm which is enough to decrease the γ-ray radiation air-dose-rate below 20 mSv/h.
Figure 3. Dependence of the γ-ray radiation dose rate at the detector position and the thermal-neutron fluence in the debris region on the thickness of the lead shield.
3.2. Fast response detector bank for fast neutron measurements
As mentioned in Chapter 2, the die-away time in the FNDI method depends on the moderation and/or absorption effects of the measurement sample. Since the radius of the canister is smaller than that of the drum and debris contains neutron absorber such as CRs, it is expected that the die-away time is shorter than that of the previous FNDI measurement system developed for measuring the waste drums. Then, the difference between time constant of the detector bank and the die-away time is small and thus it is hard to distinguish between the interrogation and induced fission-neuron component. Thus, the fast response detector-bank will be required to distinguish each component.
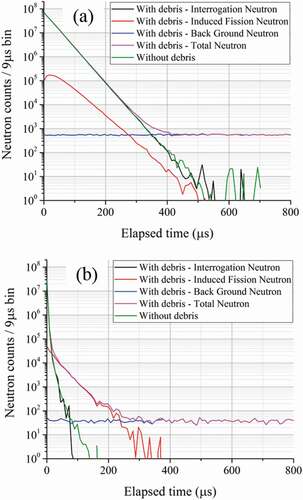
(a) shows the time variations of neutron detection events in typical detector banks for the previous FNDI method placed in the DCAS, for the cases that the debris is homogeneously distributed in a whole region of the square cavity in the canister (with debris) and that the whole region of the cavity is filled with only water (without debris), obtained with Monte Carlo simulation code MVP2 [Citation14] with JENDL 4.0 nuclear data library. MVP can simulate neutron reactions and transportation with the neutron generation number tagged. In other words, MVP can output separately the simulation results of the interrogation neutrons from the neutron generator and the induced fission neutrons. In ), black, red, blue, magenta, and green lines show the simulation results of the interrogation-neutron component, the induced fission-neutron component, the background-neutron component, the total-neutron counts and the case without debris, respectively. Comparing the data for ‘with debris – total’ and ‘without debris,’ one can easily observe that the difference is very small and it is hard to measure the fissile materials in the debris from these data by the FNDI method. This is due to the fact that the induced fission-neutron component is hidden below the interrogation-neutron component. The typical die-away time in the previous work for developing the FNDI method is between 200 and 400 μs [Citation5]. Hence, the previous FNDI method can separate the induced-fission and the interrogation-neutron components by using the detector bank with slow response of which the time constant is 29.5 μs. On the other hand, the die-away time observed in ) is 40.2 μs, which is much shorter than that in the previous work, and the detector bank cannot separate the induced fission-neutron component and the interrogation-neutron component. Then, the fissile materials would be able to be measured by making the response of the bank (and therefore the decay of the interrogation-neutron component) faster. In this research, new fast response detector-banks for fast neutron measurements are developed.
Figure 4. Time distributions of neutron detection events measured by (a) standard detector bank and (b) fast response detector bank with 1 mm thick cadmium neutron absorber. We assume the homogeneous debris matrix whose constituents are mixed in an atomic level to simplify performance evaluation of the detector bank. The debris consists of 25 vol% SF, 15 vol% JIS SUS304, 50 vol% water, and 10 vol% void. Calculating from the volume of the cavity (200 cm of the canister is modeled as described in Section 3.1.) and the density of each material, these values are equivalent to the 221.1 kg SF, 128.3 kg JIS SUS304, and 53.9 kg water. The SF consists of the nuclides obtained for the γ-ray shielding calculations in Section 3.1. The FNDI measurement and the background neutrons which make a constant component were simulated separately. Since almost all the background neutrons are generated from spontaneous fission of 244Cm, the neutron-source energy-spectrum in the simulation for the background is defined by that of the spontaneous fission. The source intensities are defined by normalizing the amount of 244Cm obtained in the above burnup calculation in a similar way described in Section 3.1 with changing the SF volume from 50 vol% to 25 vol%.
(a) shows the structure of the detector bank which is used to simulate the measurement data shown in (a). In the typical detector bank, the 3He neutron detectors are embedded in a neutron moderator covered with a thermal-neutron absorber. Our standard detector bank shown in (a) adopted a 54-mm thick HDPE block and a 15-mm thick B4C resin as the moderator and the absorber, respectively. Incoming low energy neutrons are absorbed by the B4C resin layer and only relatively high energy neutrons which can pass through the B4C resin layer penetrate into the HDPE layer. They are moderated and detected by the 3He detectors. Thus, the detector bank is insensitive to the thermal neutrons and can detect only the relatively high energy neutrons. Although the HDPE layer increases the detection efficiency, thermal neutrons moderated by the HDPE layer increase the die-away time in the detector bank and make it difficult to separate the interrogation neutrons from the induced fission ones. To avoid this, the die-away time, which dominates a time constant of the detector bank, should be shortened by absorbing the low energy neutrons using thermal-neutron poison. Jordan et al. achieved it by mixing boron which is a thermal-neutron poison in the detector banks [Citation15,Citation16]. In their measurement system, the die-away time of the thermal neutrons is not so short (382 μs) and the system does not require the very fast response detector-bank. On the other hand, the die-away time of the DCAS is an order of magnitude shorter than their system and a faster detector bank is required. (b) depicts the fast response detector-bank developed in this research. In the fast response detector-bank, the 3He detector is covered with the thermal-neutron absorber to avoid the detection of the low energy neutrons moderated by the HDPE layer.
Figure 5. Cross-sectional view of (a) standard detector bank and (b) fast response detector bank for fast neutron measurements developed in this work.
The response time should be balanced against the detection efficiency by optimizing the material and the thickness of the thermal-neutron absorbers which cover the 3He detector. The material and thickness of them were optimized because the detection efficiency is heavily dependent on them. For the optimization, the performance was evaluated for the absorbers of 1 mm and 2 mm thick cadmium sheets, and 1 mm, 2.5 mm, 5 mm, 7.5 mm, and 10 mm thick B4C blocks. In the evaluation, we use a figure of merit (FOM) introduced by Jordan et al. [Citation14,Citation15]. The FOM is defined as a ratio of net signal to its statistical standard deviation and described by the following equation:
where is the total-neutron count in the case of the sample containing the fissile materials, and
is that in the case of the sample containing water only. Because of their difficulties, time resolution and pulse pile-up of the 3He detectors are not incorporated into the simulation and the time distribution of the neutron counts has a peak without counting losses as shown in (a). On the other hand, in the real measurement, the time resolution of the 3He detector is limited and the time distribution has a plateau by counting losses immediately after the neutron burst with the high count rate. In our 3He detector, the counting loss occurs at the counting rate more than 2.4 MHz. In this research, we assume that the D-T neutron generator is driven in 1000 Hz (1000 pulses/second) and measurement time is 100 s; hence the neutron counts in vertical axis of (a) represent the sum of 105 sweeps. The time distribution has the plateau by the counting losses when the counting rate exceeds the 2.2 × 10⁶ counts/bin (2.4 MHz×9 μs bin×105 sweeps). Thus, the FOM is calculated from integral of the neutron counts in the time region after the bins which have more than 2 × 10⁶ counts/bin. The evaluation results for each bank are summarized in together with the result for the standard detector bank. The cadmium absorber is effective and the bank with 1 mm thick cadmium has the highest FOM of 160, while that of the standard bank is 62. The cadmium absorbers are more effective than the B4C absorbers. compares cross sections of 113Cd(n,γ) and 10B(n,α) which are the most contributing reactions to the neutron absorption of the cadmium and the B4C absorbers, respectively [Citation12]. While the cross-section of 10B(n,α) varies linearly with the 1/v law, that of 113Cd(n,γ) has a resonance peak around 0.2 eV. The cadmium absorber can effectively shield only the low energy neutrons which contribute to the increase of the die-away time. The 1 mm thick cadmium is adopted as the neutron absorber for covering the 3He detector. Although gamma-rays from the cadmium and boron may affect the background of the 3He detectors immediate after the neutron burst of the generator, the obtained data in the first time bin is not used in the analysis because of large neutron counting losses. Therefore, the background of the gamma rays from cadmium and boron are negligible. (b) shows the time distribution of the neutron counts in the fast response detector banks with the 1 mm thick cadmium absorber. The interrogation and the induced fission-neutron components are clearly distinguished due to the fast response of the new bank. The time constant of the fast response bank in (b) is 1.78 μs while that of the standard bank is 29.5 μs. The time constant is improved by more than one order of magnitude.
Table 1. Figure of merit of each detector bank
Figure 6. Cross sections of 113Cd(n,γ) and 10B(n,α).
4. Simulation for measurement of debris
The debris measurement simulations were conducted for the designed system. As mentioned in Section 3.2, the debris is assumed to be homogeneously distributed in the whole region of the square cavity. Although the debris is thought to be inhomogeneous and consists of a lot of materials, we assume the homogeneous debris matrix to simplify the performance evaluation of the system. We assume that the porosity of the debris is 50 vol% and filled with water since we assume the submersion method as a removal method. The debris consists of the SF, the JIS SUS304 from the construction material, the concrete which is included when the molten core-concrete interaction (MCCI) occurs, the CRs which strongly affect the FNDI measurement, and the water. To investigate the influence of the various matrices, the measurements were simulated for the SF contents of 22.11, 110.6, 221.1, and 442.2 kg (equivalent to 2.5 vol%, 12.5 vol%, 25 vol%, and 50 vol% of the cavity, respectively) and the CR contents of 0, 0.426, 2.13, 4.26, and 7.1 kg (equivalent to 0 vol%, 0.06 vol%, 0.3 vol%, 0.6 vol%, and 1.0 vol% of the cavity, respectively) with the constant contents of the 128.3 kg JIS SUS304 or 35.6 kg concrete (equivalent to 15 vol% of the cavity) in the debris. The atomic densities were changed with the constant volume of the debris region for varying the debris components contents. As described in Section 3.2, the SF consists of the nuclides obtained by the burnup calculation in Section 3.1.
The induced fission neutron counts and the die-away time are obtained by fitting the time distributions of neutron detection events shown in (b). shows the fitting result. The points show the simulation result, and green, blue and red lines show the first term, the second term, and the sum of them in EquationEquation (1)(1)
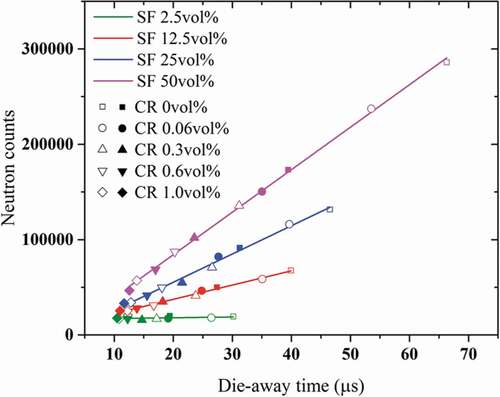
(1) , respectively. shows a correlation between the number of induced fission-neutron counts obtained by integrating the induced fission neutron components from the third bin, and the die-away time obtained for each case. Green, red, blue, and magenta symbols show the simulation results for the debris containing SF 22.11 kg, 110.6 kg, 221.1 kg, and 442.2 kg, respectively. Square, circle, triangle, inverted triangle, and rhombus symbols show the simulation results for the debris containing CR 0 kg, 0.426 kg, 2.13 kg, 4.26 kg, and 7.1 kg, respectively. Outlined and solid symbols show the simulation results for the debris containing 35.6 kg concrete and 128.3 kg JIS SUS304, respectively. The results for the same SF-content cases show a linear relation between the neutron counts and the die-away time independently of the other constituents. Each line represents the linear fitting result for the same SF content. As the CR content increases, the neutron counts and the die-away time decrease. The die-away times of the JIS SUS304-containing debris matrices are shorter than those of the concrete-containing debris matrices since JIS SUS304 contains iron which has relatively high thermal-neutron absorption cross-section. As the SF content increases, the die-away time increases because of a neutron-multiplication effect even if the other matrix constituents remain the same. The above results show the correctness of EquationEquations (4)
(4)
(4) and (Equation6
(6)
(6) ). Obtaining the linear functions for different SF contents beforehand, the FNDI method can evaluate the amounts of fissile materials in different debris matrices with a great reduction of the influence of the various matrices by using the measured induced fission-neutron counts and die-away time. It is confirmed by the simulation that the influence of the matrix can be greatly reduced by using the FNDI method not only in the system designed by Ohzu et al. [Citation5] but also in the DCAS. All the debris matrices assumed here can be measured with DCAS. Although the debris may be unmeasurable when the SF content decreases or the CR content increases, it is beyond the scope of this paper.
Figure 7. Simulation result for the time distribution of neutron detection events and fitting results in the case where debris contains SF 25 vol%, JIS SUS304 15 vol%, CR 0 vol%, and water 50 vol%.
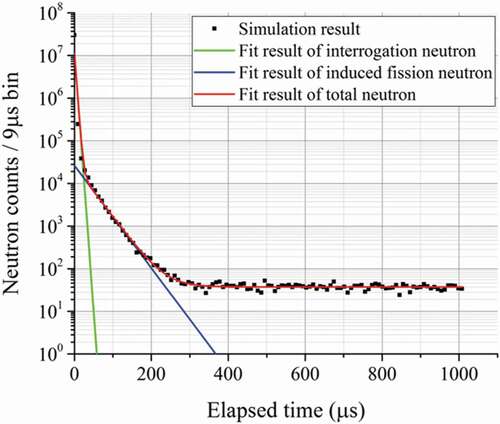
Figure 8. Correlation between induced fission neutron counts and die-away time. Outlined and solid symbols represent the results of the concrete and JIS SUS304 matrices, respectively. Each line represents a linear fitting result of each SF content.
5. Summary
In this research, we have designed the measurement system for the fissile materials in the fuel debris based on the FNDI method. In particular, we have developed the fast response detector-bank to apply the system to the measurement of the debris in the fuel canister. The fast response bank has a more than twice larger FOM and more than one order of magnitude faster response compared to the standard bank. We have also simulated the measurement of the homogeneously mixed fuel debris. From the results, a linear relation between the induced fission-neutron counts and the die-away time were obtained for each SF content independently of the debris matrix. This is the feature of the FNDI method; using the relation, the amount of the fissile materials in the fuel debris can be measured greatly reducing the influence of the various matrices.
Acknowledgments
The authors wish to thank T. Kurata and K. Hattori for their technical support in this work.
Disclosure statement
No potential conflict of interest was reported by the authors.
Correction Statement
This article has been republished with minor changes. These changes do not impact the academic content of the article.
References
- Haruyama M, Ara K, Takase M. High-sensitivity detection of fissile materials in a waste drum by direct interrogation of 14 MeV Acc neutrons. Nihon-Genshiryoku-Gakkai Shi J Atomic Energy Soc Jpn. 2001;43(4):397–404. [in Japanese].
- Haruyama M, Takase M, Tobita H, et al. High-sensitive detection by direct interrogation of 14 MeV Acc neutrons, (I) Uranium-contained metal matrix in a waste drum. Nihon-Genshiryoku-Gakkai Shi J Atomic Energy Soc Jpn. 2004;3(2):185–192. [in Japanese].
- Haruyama M, Tobita H, Takase M, et al. High-sensitive detection by direct interrogation of 14 MeV Acc neutrons, (II) Uranium-contained cloth matrix in a waste drum. Nihon-Genshiryoku-Gakkai Shi J Atomic Energy Soc Jpn. 2007;6(1):65–72. [in Japanese].
- Haruyama M, Takase M, Tobita H. Improvement of detection limit in 14 MeV neutron direct interrogation method by decreasing background. J Nucl Sci Technol. 2008;45(5):432–440.
- Ohzu A, Komeda M, Kureta M, et al. Development of non-destructive assay system using fast neutron direct interrogation method for actual uranium waste drums. Nihon-Genshiryoku-Gakkai Shi J Atomic Energy Soc Jpn. 2016;15(2):115–127. [in Japanese].
- Kunz EW, Atencio DJ, Caldwell TJ. A 1-nCi/g sensitivity transuranic waste assay system using pulsed neutron interrogation. United States: Los Alamos Scientific Laboratory; 1980. LA-UR-80-1794.
- Favalli A, Pedersen B. Design and characterization of a pulsed neutron interrogation facility. Rad Prot Dosim. 2007;126(1–4):74–77.
- Favalli A, Mehner CH, Crochemore MJ, et al. Pulsed neutron facility for research in illicit trafficking and nuclear safeguards. IEEE Trans Nucl Sci. 2009;56(3):1292–1296.
- Tmi DOE. Fuel characteristics for disposal criticality analysis. United States: United States Department of Energy; 2003. DOE/SNF/REP-084.
- Beddingfield HD, Johnson HN, Menlove OH. 3He neutron proportional counter performance in high gamma-ray dose environments. Nucl Instrum Methods A. 2000;455:670–682.
- Sato T, Iwamoto Y, Hashimoto S, et al. Features of Particle and Heavy Ion Transport code System (PHITS) version 3.02. J Nucl Sci Technol. 2018;55(6):684–690.
- Shibata K, Iwamoto O, Nakagawa T, et al. JENDL-4.0: A new library for nuclear science and engineering. J Nucl Sci Technol. 2011 Jan;48(1):1–30.
- Croff GA. ORIGEN2: A versatile computer code for calculating the nuclide compositions and characteristics of nuclear materials. Nucl Technol. 1983;62:335–352.
- Nagaya Y, Okumura K, Mori T, et al. MVP/GMVP2: general purpose Monte Carlo codes for neutron and photon transport calculations based on continuous energy and multigroup methods. Japan: Japan Atomic Energy Research Institute; 2005. JAERI-1348.
- Jordan AK, Gozani T. Detection of 235U in hydrogenous cargo with differential die-away analysis and optimized neutron detectors. Nucl Instrum Meth A. 2007;579:388–390.
- Jordan AK, Gozani T, Vujic J. Differential die-away analysis system response modeling and detector design. Nucl Instrum Meth A. 2008;589:436–444.
Appendix
This appendix gives a detailed calculation process for the model of the time variation of the neutron detection events in the FNDI measurement system.
In the FNDI method, assuming the homogeneous matrix in the sample, the first generation thermal-neutron flux from the neutron generator is described as the following equations using time-dependent one-group diffusion theory [Citation1];
where is the initial thermal-neutron flux generated by the moderation of the injected fast neutron (since the moderation time is much shorter than the die-away time, instantaneous generation of thermal neutrons is assumed here),
is a velocity of the thermal neutron,
is the coefficient that is related to neutron leakage (it can be obtained by assuming that the neutron leakage is proportional to the volume integral of the neutron flux),
is a macroscopic neutron absorption cross-section. For the fundamental mode,
, where
is the diffusion coefficient and
is the geometrical buckling. The second generation thermal neutron flux which is generated by the moderation of fission neutrons produced by the first generation thermal neutrons in the sample region can be described by convolution:
where is the number of neutrons emitted per fission,
is a macroscopic fission cross-section and
is a probability that the fission neutrons are moderated to the thermal neutrons without disappearing during the moderation. Similarly, the n-th generation thermal neutron flux is described by
Here, we define the response function of the detector bank as
where is the detection efficiency for the fission neutron and
is the decay constant depending on the structure of the detector bank. Time variation of detection events for fission neutrons generated by the first generation thermal neutrons, which we call the first generation of detection events, can be described by convolution:
Here, we assume that fission neutrons generated in the sample reach the detector bank without any delay considering a large speed of fast neutrons. Similarly, that of the n-th generation is described by
Here, the following equations are defined:
Calculating the integral, EquationEquation (A8)(A8)
(A8) becomes the following:
Substituting EquationEquation (A10)(A10)
(A10) into EquationEquation (A7)
(A7)
(A7) ,
becomes the following:
Next, to derive a model for the total neutron detection event, is summed from n=1 to infinity. For simplification, the summation of the last terms which include
and those of the others terms in
which include
are calculated separately. For the former one, the n-th generation of the neutron detection event,
, is as follows:
is generally satisfied in the FNDI measurements, the sum of all generations of EquationEquation (A12)
(A12)
(A12) becomes as follows:
For the latter one, the n-th generation of the neutron detection event, , is described as follows:
The sum of all generations of EquationEquation (A14)(A14)
(A14) becomes as follows:
The Maclaurin series of is represented as
Applying this equation, EquationEquation (A15)
(A15)
(A15) becomes as follows:
For , the sum of all generations of EquationEquation (A16)
(A16)
(A16) becomes as follows:
Time variation of the detection event of neutron from the neutron generator can be described as follows:
where is the neutron source intensity and
is the detection efficiency of the detector bank for the fast neutrons from neutron generator. The total neutron detection event can be obtained by summing EquationEquations (A13)
(A13)
(A13) , (A17), and (A18):
The same result can be obtained by using the solution of time-dependent one-group diffusion theory with the fission source:
(A20)
is represented as follows:
It should be noted that Equation (A20) can be obtained by using EquationEquation (A4)(A4)
(A4) as follows:
Reference
[1] Duderstadt J. J, Hamilton J. L, ‘Nuclear reactor analysis’, New York: John Wiley & Sons, Inc. 1976.