
 ?Mathematical formulae have been encoded as MathML and are displayed in this HTML version using MathJax in order to improve their display. Uncheck the box to turn MathJax off. This feature requires Javascript. Click on a formula to zoom.
ABSTRACT
Following the Fukushima Daiichi nuclear accident, fears have arisen that terrorists can cause a similar accident by acts of sabotage against nuclear facilities; as a result, the importance of nuclear security has increased. In particular, sabotage by insiders is a distinct threat to nuclear power plants. In response to limitations of physical protection system (PPS) in nuclear facilities, in this paper, we propose a behavior recognition method that is based on hand motion time-series data analysis and use deep learning to explore insider sabotage detection.
1. Introduction
Following the Fukushima Daiichi nuclear disaster, the importance of nuclear security has experienced a noticeable increase. Although the Fukushima accident was caused by a natural disaster, from a nuclear security standpoint, fears were raised that terrorists could cause similar accidents by acts of sabotage against a nuclear power plant (NPP) [Citation1]. With respect to nuclear security, due attention should be paid to insider sabotage, as insiders are individuals with authorized access to nuclear facilities and can potentially attempt unauthorized sabotage. Taking advantage of their access to authority and knowledge, they can bypass dedicated physical protection elements or other provisions [Citation2].
At present, the primary countermeasures against insider sabotage include the individual trustworthiness of NPP employees, the two-man rule, and physical protection system (PPS). However, as a result of the strict Personal Information Protection Law in Japan, background checks are insufficient. In addition, although the two-man rule is somewhat effective in restricting access to sensitive areas in an NPP to unaccompanied employees, it can be compromised by a trained terrorist who can incapacitate an unsuspecting partner [Citation3].
The PPS in an NPP is designed to protect the facility against the design basis threat (DBT) and minimize the likelihood of an accident. The International Atomic Energy Agency (IAEA) has indicated that the PPS of an NPP should be integrated and effective against both sabotage and unauthorized removal [Citation4]. An effective PPS performs the following primary functions [Citation5]:
Deterrence: prevention of sabotage by implementing measures that are perceived by potential adversaries as too difficult to defeat, such as, the presence of security guards in parking lots, adequate lighting at night, the posting of signs, and the use of barriers.
Detection: discovery of adversary actions. Measures of effectiveness for detection include the probability of sensing adversary actions and the time required to report and assess an alarm.
Delay: slowing down of adversary progress. Delays can be accomplished by personnel, barriers, locks, and activated delays.
Response: actions taken by the response force to prevent adversary success.
In the case of inside sabotage, deterrence is not applicable; furthermore, and it is not practical to monitor all individuals through a common video surveillance system in a nuclear facility. It should also be emphasized that if detection fails, the delay and response functions do not get activated. Considering these limitations, a new automatic detection system which should respond fast, reliable, and perform on robust algorithms for tool tracking, human motion recognition, and activity analysis is necessary.
Hand motions are significant components of human activity and are used in maintenance and sabotage behaviors, such as modifications to power boards using tools and the contamination of control computers with viruses using USB devices. Hand motion analysis can be used to detect these behaviors. However, conventional research on abnormal behavior detection mainly focuses on the entire human body. Singh et.al [Citation6]. developed a novel approach to detect the moving objects in the video surveillance systems of NPPs. In this approach, a Gaussian blur algorithm is used to raise an alarm if abandoned objects are detected. Ishii et.al [Citation7]. proposed a human behavior detection method using cubic higher-order local auto-correlation (CHLAC) features, which can minimize rapidly changing characteristics of an individuals movement direction and categorize an individuals movement types. The computational complexity of this method, however, is large, and advanced hardware environment is required for real-time processing. To reduce the computational complexity of CHLAC, Iwata et.al [Citation8]. use principal component analysis (PCA) for dimensionality reduction; however, this method did not provide significant improvement in the detection of complex human body motions. Very little research on detecting insider sabotage using hand motions has been conducted, primarily because hand motions are more complex than full body motions owing to the 26 degrees of freedom (DOF) of the human hand [Citation9].
In this paper, we present an insider sabotage detection method in response to the limitations of the PPS in NPPs. This method uses deep learning to achieve hand motion recognition, and we address ambiguity in time-series data by implementing a deep neural network (DNN) to extract the features of each frame. This method builds upon our earlier publication of a real-time hand tracking system [Citation10]. In comparison with our earlier paper, the present paper contains more technical details and more complex motion recognition results. In addition, we evaluate the robustness of our method against data loss by using verification datasets with different data loss ratios.
2. Motion recognition
Conventional studies on abnormal behavior detection commonly use static data analysis. However, distinguishing malicious behaviors from ordinary maintenance behaviors through static image analysis is difficult because of the similarities shared by these two types of motion. In comparison with static data analysis, time-series data analysis can detect a larger number of scenes, more detailed information, and time variation information. However, the large computational complexity of time-series data analysis is an obstacle for real-time calculation. To overcome this problem, it is necessary to extract features and conduct a dimensionality reduction. To this end, the PCA method is commonly used. However, if there are nonlinear relationship between variables, PCA is unable to accurately describe the data accurately. Thus, a nonlinear PCA method is required, and deep learning can be used to convert high-dimensional data to lower dimensions [Citation13].
2.1. Learning complex features using deep neural networks
Deep learning is a novel area of machine learning research that has been developed with the objective of advancing machine learning toward one of its original goals: artificial intelligence (AI) [Citation14]. The fundamental architecture for deep learning is a DNN, which is simply a feedforward network with several hidden layers. In contrast to shallow feedforward neural networks, DNNs have the advantage of significantly greater representational power.
2.2. Stacked autoencoder
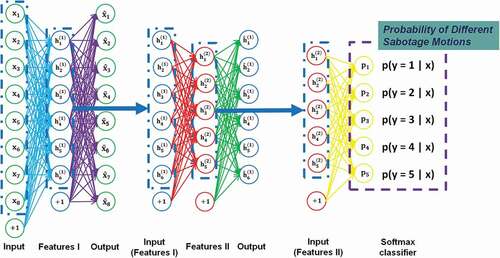
A stacked autoencoder (SAE) is a typical DNN that consists of multiple layers of sparse autoencoders (AEs) to learn complicated functions that represent high-level abstractions; in addition, it contains a softmax classifier for classification problems [Citation15]. An SAE possesses all the benefits of DNNs of greater expressive power and is used in this paper for behavior recognition. The architecture of an SAE is illustrated in .
Figure 1. Stacked autoencoder architecture.
For an SAE, the encoding step of each layer (l) is performed in forward order as follows:
The decoding step is performed by running the decoding stack of each AE in reverse order as follows:
Here, and
denote parameters (weights and bias) of the
AE for the encoding step, and
and
denote parameters of the
AE for the decoding step. Moreover,
is the activation of the deepest layer of hidden neurons and provides a representation of the input in terms of higher order features.
Following feature extraction, can be fed to a softmax classifier for classification problems.
Greedy layerwise training can then be used to obtain optimal parameters for the SAE. The training steps are as follows:
The first layer is trained on raw input to obtain parameters
,
The parameters from the first layer are used to transform the raw input into a vector consisting of the activations of the hidden neurons. This vector is used to obtain parameters
Steps (1) and (2) are repeated in subsequent layers, using the output of each layer as input for the subsequent layer.
Following the completion of training, fine-tuning using backpropagation can be used to improve the results by tuning the parameters of all the layers simultaneously.
To improve the performance of an SAE, fine-tuning is used in the training process. Fine-tuning treats all layers of an SAE as a single model, and all weights are improved in one iteration. The implementation of fine-tuning using the backpropagation algorithm is summarized as follows:
(1) Perform a feedforward pass, computing the activations for layers ,
, up to the softmax output layer
, using the equations defining the forward propagation steps.
(2) For the softmax output layer , compute the error term as follows:
where is the total weighted sum of inputs to the softmax layer, and “
“denotes the element-wise product operator (e.g. if a = b
c, then
=
). In addition, the softmax layer has:
where I is the input label and P is the vector of conditional probabilities.
(3) For l = 3, 2, set
(4) Compute the desired partial derivatives:
The above equations indicate that an SAE has greater expressive power and that higher layers of the SAE tend to learn higher order features. An SAE can thus be considered an effective method for motion recognition.
3. Experiments
Monitoring the real-time behavior of employees in nuclear facilities and classifying their motions can be useful for nuclear security. The goal of this study is to classify five potential malicious motions, which are illustrated in and defined as follows:
Figure 2. Potential sabotage motions.
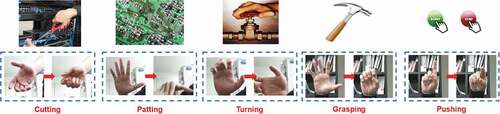
Cutting (using scissors, etc.).
Patting (control panel, etc.).
Turning (switch, etc.).
Grasping (tools).
Pushing (buttons).
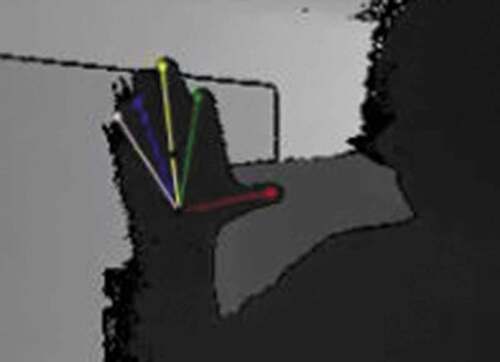
With the ability to capture hand motions using the real-time hand tracking system on the basis of RGB-D image analysis from our preliminary study [Citation10], the positions of each fingertip can be captured at a frame rate of 29.8 frames per second (fps) without the use of graphics processing unit (GPU), as illustrated in . For practical purposes, the following factors in a neural network training set should be taken into account:
Figure 3. Real-time hand tracking results.
Individual characteristics of hands.
Relative distance and angle to the camera.
Motion speed.
To capture hand motions for the training set, we considered the first two factors (individual characteristics of hands and relative distance and angle to the camera) in the current experiment. Five volunteers were instructed to perform each hand motion 20 times repeatedly, with each motion lasting for 2 s at a different distance and angle to the camera. The factor of motion speed will be considered in future experiments. Each frame of the captured motion data included the 3D positions of five fingertips. In addition, to verify the detection ability of the trained SAE, time-series test data were obtained. The test data consisted of both malicious motions and ordinary motions in the following order: Pushing, Normal, Grasping, Normal, Cutting, Normal, Patting, Normal, Turning. Each motion in the test data was performed five times, and each particular motion lasts for 2 s.
3.1. Data preprocessing
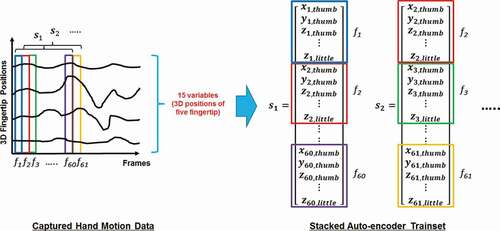
Each frame of the captured data includes the 3D positions of five fingertips and can be expressed as the following 15-dimensional vector:
where i is the frame number. The 3D position variables (x, y, and z) of the five fingers are arranged in order: thumb, index finger, middle finger, ring finger, and little finger. In addition, each motion lasts 2 s, and the frame rate of the real-time hand motion capturing system is 29.8 fps; that is, each cycle of motion consists of 60 frames. Thus, each sample in the training set includes fingertip positions from 60 consecutive frames with 15 variables (3D positions of five fingers) for each frame as follows:
The conversion of the captured hand motion data to a time-series format SAE training set is demonstrated in .
Figure 4. Conversion of captured hand motion data to a time-series format training set.
3.2. Implementation details
For the network and parameter settings, we used three AEs to construct an SAE model. The first AE was trained on raw input (time-series format training set, 900 neurons in each sample) to learn the primary features
of the raw input. Next, these primary features
were fed to the second sparse AE to obtain the secondary feature activations
for each of the primary features. Thereafter, the secondary features
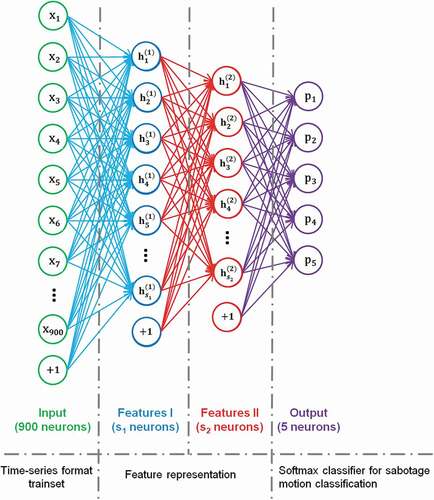
were provided as ‘raw input’ to a softmax classifier (five neurons), which was trained to map the secondary features to digit labels. Finally, all three layers were combined to form an SAE with two hidden layers and a final softmax classifier layer capable of classifying sabotage motions as illustrated in . The SAE parameters were trained from a random start, using stochastic gradient descent to perform weight updates.
regularization was used with a coefficient of 0.001 to mitigate overfitting [Citation16].
Figure 5. Proposed SAE model architecture.
The number of hidden neurons generally has a large impact on the performance of an SAE model. Therefore, we proposed four network architectures with different numbers of neurons; the details are provided in . The performance of these models was verified in our experiments for optimization.
Table 1. Four proposed network architectures
4. Results and discussion
4.1. Motion recognition validation
We performed our experiment using a test dataset consisting of different motions in the following order: Pushing, Normal, Grasping, Normal, Cutting, Normal, Patting, Normal, Turning. The hand motion data of each frame were fed to the SAE to obtain the pattern probability using the softmax classifier. presents the motion recognition output; here, the probability of different motions for each frame is represented by different colors.
Figure 6. Motion recognition output. Different colored lines represent the probability of different motions (red line: probability of pushing motion; blue line: probability of grasping motion; green line: probability of cutting motion; yellow line: probability of patting motion; pink line: probability of turning motion).
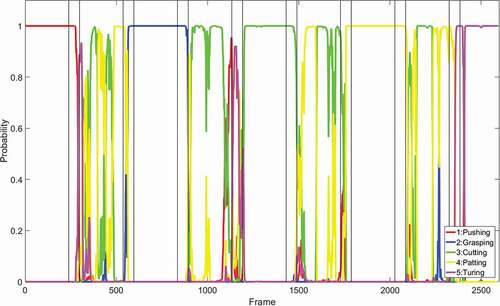
For each frame, the motion with the highest probability was selected as the detected motion, and it contributed to a correctly detected frame if it corresponded to the motion in the test data label. Finally, the accuracy of each motion was obtained as follows:
where is the number of correctly detected frames and N is the total frame count.
presents the validation results for the proposed models. For the pushing and grasping motions, the accuracy is nearly 100% using all the proposed models, signifying that the behaviors are perfectly recognized. Model 3 and Model 4 result in a significantly higher accuracy for the turning motion (83.575% and 84.541%, respectively) than Model 1 and Model 2 (57.005% and 57.488%, respectively). This is because networks with too many hidden neurons can cause overfitting problems, leading to poor recognition performance. Of all the models, Model 3 displays superior performance for the cutting motion (93.305% accuracy). In addition, it recognizes the normal motion (i.e. an undefined motion consisting of a randomly captured motion to reflect ordinary human behavior) with an accuracy of 71.849%. The overall accuracy of Model 3 is 82.555%, which is a satisfactory classification performance. Thus, further experiments are conducted using this model.
Table 2. Motion recognition accuracy
4.2. Robustness verification
Lossy transmission is a common problem in monitoring systems. Data loss can occur because of network problems, operational errors, computer viruses, unexpected accidents, and so on. It is thus important to verify whether satisfactory detection results can be achieved even when image frames are lost. In addition, the robustness of our motion recognition method against data loss should be evaluated.
Data loss can generally be split into two categories:
Nonconsecutive frame loss due to sudden data transmission failure, which may cause intermittent information loss in data acquisition.
Consecutive frame loss due to motion detection failure (e.g. some areas of the human body are hidden behind an obstacle), which may cause continuous information loss in data acquisition and changed patterns in the data.
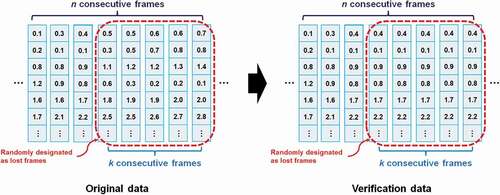
To verify the robustness of our motion recognition method when dealing with the lossy transmission, we generated different verification datasets, randomly selecting lost frames on the basis of the captured test dataset. For nonconsecutive frame loss, we randomly designated one frame as a lost frame from each n consecutive frames and replaced the data of this frame with data from the previous frame (see ). On the basis of this approach, verification datasets with data loss ratios 20%, 33%, and 50% were generated, with each dataset containing 1000 verification samples. In addition, for consecutive frame loss, we randomly designated k consecutive frames as lost frames from each n consecutive frames and replaced the data of these frames with data from the first selected lost frame (see ). Verification datasets with consecutive frame loss ratios of 10%, 20%, 30%, 40%, and 50% were generated, with each dataset containing 1000 verification samples.
Figure 7. Verification dataset generated for nonconsecutive frame loss.
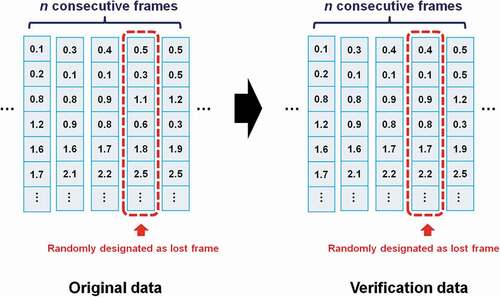
Figure 8. Verification dataset generated for consecutive frame loss.
We performed verification experiments using these verification datasets. Verification results for nonconsecutive frame loss are presented in , and it indicates that no significant decrease in accuracy occurred for nonconsecutive frame loss. In addition, for consecutive frame loss, even when 50% consecutive frames were lost, our method still achieved a recognition accuracy of approximately 80% for the pushing and patting motions (see ). Furthermore, the grasping and cutting motions were recognized with an accuracy of 72.223% and 76.368%, respectively. Recognition of the turning and normal motions also had an accuracy of greater than 50%. Thus, the results indicate that our method is robust to data loss.
Table 3. Verification results for nonconsecutive frame loss
Table 4. Verification results for consecutive frame loss
4.3. Computational efficiency analysis
Using an Intel Xeon E5-2630 v4 server with 2.20 GHz and 32 GB RAM, we spent approximately 0.0025 s per frame during testing. Given the rapid frame rate (29.8 fps) of our real-time hand tracking system, we were able to recognize hand motions in 27.6 fps. To further improve the computational efficiency, future work can consider implementing GPU acceleration and parallel computing to achieve real-time detection in NPPs.
5. Conclusion
In this study, we proposed a hand motion recognition method using an SAE. We performed our recognition experiment using a hand motion dataset captured by our real-time hand tracking system. The overall accuracy of our method was approximately 82.555%, which demonstrates the effectiveness of the methods in the recognition of malicious hand motions. To thoroughly evaluate the performance of our method, we verified its robustness against data loss using verification datasets with different data loss ratios. The verification results indicated that our method is capable of maintaining robustness when experiencing both nonconsecutive and consecutive frame loss. In addition, our method is capable of accurate hand motion recognition in real time; it can thus be regarded as the first step toward achieving insider sabotage detection to improve nuclear security.
Disclosure statement
No potential conflict of interest was reported by the authors.
Additional information
Funding
References
- Akiyama N. The Fukushima nuclear accident and crisis management-lessons for Japan-US alliance cooperation. Tokyo, Japan: The Sasakawa Peace Foundation; 2012. https://www.spf.org/jpus/img/investigation/book_fukushima.pdf
- Garcia ML. Design and evaluation of physical protection systems. Burlington (MA): Butterworth-Heinemann; 2007.
- Leventhal PL, Hoenig MM. Nuclear terrorism: reactor sabotage and weapons proliferation risks. Contemp Econ Policy. 1990;8:106–121.
- International Atomic Energy Agency. Nuclear security recommendations on physical protection of nuclear material and nuclear facilities. Vienna, Austria: International Atomic Energy Agency; 2011. (INFCIRC/225/Revision 5).
- International Atomic Energy Agency. Engineering Safety Aspects of the Protection of Nuclear Power Plants against Sabotage. Vienna, Austria: International Atomic Energy Agency; 2007; (IAEA Nuclear Security Series No. 4).
- Singh GK, Shukla V, Patil S, et al. Automatic detection of abnormal event using smart video surveillance system in a nuclear power plant. 55th Annual Meeting of the Institute of Nuclear Materials Management; 2014 July 20–24; (Atlanta USA). Vol. 1, p. 3139–3146.
- Ishii T, Murakami H, Koike A Human behavior detection method with direction change invariant features. Proceedings of 7th International Symposium on Medical Information and Communication Technology ISMICT; 2013 Mar 6-8; Tokyo (Japan). p. 257–261.
- Iwata K, Satoh Y, Sakaue K, et al. Development of software for real-time unusual motions detection by using CHLAC. Bio-inspired Learn Intell Syst Secur. 2008;34–39.
- Oikonomidis I, Kyriazis N, Argyros AA Markerless and efficient 26-DOF hand pose recovery. 10th Asian Conference on Computer Vision; 2010 Nov 8–12; Queenstown (New Zealand). p.744–757.
- Chen S, Demachi K, Fujita T, et al. Insider malicious behaviors detection and prediction technology for nuclear security. E-J Adv Maint. 2017;9:66–71.
- MacQueen J. Some methods for classification and analysis of multivariate observations. Proc fifth Berkeley symp math stat probab. 1967;1(14):281–297.
- Zill D, Wright WS, Cullen MR. Advanced engineering mathematics. Burlington (MA): Jones & Bartlett Learning; 2011.
- Hinton GE, Salakhutdinov RR. Reducing the dimensionality of data with neural networks. Science. 2006;313(5786):504–507.
- Bengio Y, Lamblin P, Popovici D, et al. Greedy layer-wise training of deep networks. Adv Neural Inf Process Syst. vol. 19, 2007;153–160.
- Vincent P, Larochelle H, Lajoie I, et al. Stacked denoising autoencoders: learning useful representations in a deep network with a local denoising criterion. J Mach Learn Res. 2010;11(Dec):3371–3408.
- Ng AY Feature selection, L 1 vs. L 2 regularization, and rotational invariance. Proc. the twenty-first international conference on Machine learning; 2004 Jul 4; New York (USA). p. 78. ACM