
 ?Mathematical formulae have been encoded as MathML and are displayed in this HTML version using MathJax in order to improve their display. Uncheck the box to turn MathJax off. This feature requires Javascript. Click on a formula to zoom.
ABSTRACT
This paper aims at clarifying the potential and the limit of the method to surmise the timing of the containment vessel (CV) failure utilizing the Emergency Action Levels (EALs) issued as a nuclear operator’s notification in an early phase of the severe accident (SA). We analyzed the timings of the EALs issued in all kinds of the SA sequences of several PWR plant models by using the SA analysis code, MAAP. We found high correlations between the timing of SE41 (EAL issued at CV pressure of 0.5 design pressure) and the timing of the CV failure in the typical scenarios, e.g. over-pressure failures. We could therefore establish an evaluating method to estimate the time for a CV failure. This method has the potential to support the decision-making in nuclear emergency preparedness.
1. Introduction
In many countries, the operating nuclear power plants are required to include the Emergency Action Levels (EALs), which were introduced in the Safety Standards of International Atomic Energy Agency (IAEA) [Citation1] [Citation2], in their emergency response plans. The EALs issued by an operator are the inputs for a government to make decisions of the precautionary action for the local residents of those countries. Japanese government has also adopted the scheme of EALs since 2013 [Citation3]. The Japanese operators’ EALs for each plant are publicly available [Citation4–Citation6]. The EALs simply express the current plant statuses. However, the Japanese local governments are still requiring predictive information to surmise the timing of breakage of the radioactive barrier and the following exposure because they need to make decisions of the protective actions considering multiple disaster and impediments to evacuation [Citation7]. From the real sequence of the Fukushima accident, it was identified that the scheme of the EALs has a potential to solve this problem in the early phase of the severe accident (SA) [Citation8].
The containment vessel (CV) failure time represents the onset of the release of the radioactive nuclides to the environment. The timings of the CV failure in the representative SA sequences are analyzed in the probabilistic risk assessment (PRA) [Citation9–Citation12]. However, up to now no comprehensive survey of the times for the CV failures, for all possible SA sequences, exist. The regulatory guidance of the United States notes that planning should not address a single accident sequence as each accident could have different consequences [Citation13].
This US guidance also arranged for decision-makers to recommend the precautionary protective action corresponding to the rapidness of the SA sequences and the choice of the evacuation or sheltering in place [Citation13]. However, the specific way to determine the rapidness of the accident sequences according to the notification issued by operators was not found in any countries’ guidance and the previous studies.
Based on the above considerations, we are trying to develop complementary methods for the decision-makers to determine the timing of the CV failure in SA scenarios from the EALs issued as a nuclear operator’s notification. The method is to support governments to judge the precautionary protective action for the residents.
2. Modeling and boundary conditions
2.1. MAAP code
In this paper, we performed analyses for the SA sequences from the trigger events to the CV failures with the SA comprehensive analysis code, MAAP (Modular Accident Analysis Program) version 4.07. The MAAP is a computer code which outputs the responses of the physico-chemical phenomena in the reactor, the primary-loops and the CV, from the input events such as the loss of coolant accident (LOCA), the station blackout (SBO) and the emergency core cooling system (ECCS) failures occurred during full-power operation. This code is not for precise calculations of the dynamic phenomena because it treats the momentum equation as a quasi-static process. Instead, it calculates rapidly and roughly the conservation of the state variables such as mass and energy [Citation14]. Therefore, this code is suitable to calculate the hundreds of sequences and enough applicable to estimate the timing of EALs and CV failure on an hourly basis for the protective actions of the residents.
2.2. PWR analysis model
For this study, typical Japanese dry type PWRs with three- and four-loop primary systems were used as the reference plants. The input parameters such as the equipment and fuel types were based on the amendment of the application for the alteration in the installment license reported to Nuclear Regulatory Authority Japan by the Kansai Electric Power Company [Citation9–Citation12]. The MAAP models are divided into detailed nodes and all of the nodes are connected by the junctions. The validation of the model is shown in the license documents.
2.3. Boundary conditions
We analyzed the timings of EALs issued in all kinds of the SA sequences for 4 PWR reactors of different generations as the reference model plants. The first two reference model plants A1 and A2 are both the dry type PWR with three-loop primary systems built in 70’s. We analyzed these two plants independently because the specifications of the nodes and the junctions are slightly different between these plants. The model plant B is three-loop plant built in 80’s. The last model plant C is the latest four-loop plant built in 80’s. The main boundary conditions of these 4 models, Model A1, A2, B and C used in this study, are given in . The main parameters such as the initial pressure or temperature of each model plants shown in are publicly available [Citation9–Citation12].
Table 1. The boundary conditions and parameters of the four model plants analyzed by the MAAP code in this study
2.4. The validation of the code and the model
In this study, mainly the aspects of the time dimension of the SA events are discussed. Therefore, we compared the calculated timing of some SA events with our base-case model (equivalent to the plant model analyzed in this study as Model B shown in ) for the same scenario as was done in the calculations in a previous study using the MELCOR (Methods for Estimation of Leakages and Consequences Of Releases) code developed by U.S. NRC [Citation15]. In this previous study using the MELCOR code, two scenarios of the large-brake LOCA (LBLOCA) and SBO with the auxiliary feed water system (AFWS) failure were analyzed. Therefore, we also analyzed these two scenarios by MAAP, and compared the chronology of the SA progress, such as the core uncover, the cladding breakage and the reactor pressure vessel (RPV) failure between the outputs of two codes as a validation. The result of the validation for these two scenarios is shown in .
Table 2. The result of the validation comparing the chronology of SA progress between MAAP and MELCOR for two scenarios
Even though the available boundary conditions and parameters used in the reference analyses of MELCOR were limited, the simulated maximum deviations between both SA sequences of core melt progression are within 12 min and 1.4 h. We estimated that these time periods are enough shorter than the time duration to the RPV failure of each scenario, and the rest events are almost parallel. The reference case simulated the effectiveness of the accident management countermeasure, such as the containment natural circulation cooling. Therefore, the validation could not show the containment response. However, according to the previous study, the deviation in the containment response between the two simulations using different models is driven primarily by differences in the simulation of core melt progression [Citation16]. Therefore, our models and the code are capable of simulating the timings of EALs and CV failures in SA phenomena.
3. Method
The sequences analyzed in this study are developed from the event trees of the PRA for each Model plant. shows all 58 sequences we analyzed for the Model B plant [Citation11]. For example, sequences classified into the plant damage states of AEW, shown in the first two rows of ‘Rapid core damage, Wet atmosphere’, are characterized by the large break LOCA (A), relatively earlier core damaging (E), and the wet atmosphere of CV by the steam (W) in the PRA analysis. The explanatory notes for the symbol of each scenario and the plant damage states are also shown in the lower part of . The total numbers of sequences for each plant damage states are summed up in the right column. For the Model B plant, 13 kinds of sequences were simulated for AEW. In this study, the first sequences simulated for AEW is described as AHLF in the first cell of AEW, initiated by the malfunctions (initiators); the large break LOCA (A) and the recirculation failure of the low-pressure Injection (HL) and the containment spray system (F).
Table 3. The sample of the malfunctions for all sequences of the Model B plant derived from the event trees of the probabilistic risk assessment
Similarly, we analyzed all 117 sequences for the Model A1, 117 sequences for the Model A2, and 48 sequences for the Model C by MAAP code. The total number of simulated sequences for these 4 plants (A1, A2, B, and C) was 340. The number of the sequences for each plant is different because of the difference of safety design of the plant system.
In each simulation by MAAP, we determined the timing of each EAL. shows the analyzed EALs [Citation4–Citation6]. For example, EAL described as SE21 is notified when an operator recognizes the occurrence of the potential loss of the safety injection while LOCA. Specifically, this EAL is issued when the following three conditions are satisfied; water level of CV sump is not zero, GE21 is not yet issued, and the flow-rate of the high-pressure injection system is zero. These conditions for issuing each EAL are expressed in the column of ‘Conditions’. We analyzed 11 EALs from SE21 to GE42 shown in . These 11 EALs could be identified quantitatively by the plant parameters in the progress of SA events. Other EALs were impossible to utilize to determine the CV failure. Therefore, those EALs were rejected from the evaluation in this study because those are qualitative such as the loss of the monitoring functions or quantitative but identified after the radioactive nuclides were released, such as the increase of radiation level in the site boundary area. We also rejected EAL29 and EAL30 because these EALs are applied for the shutdown operation and the accident in the Spent Fuel Pit (SFP) which was not analyzed in this study. We included the marking program in the analysis according to those conditions showing in in order to record their notification timing.
Table 4. Evaluated EALs identified quantitatively by the plant parameters in the progress of SA events
As a result of the MAAP analyses for 340 sequences for all 4 plants using the data shown in , and , we could acquire the database of the timings of each EAL and the CV failure. For the acquired database, we assumed that the time duration between the initial malfunction (initiator) and any EAL has linear or non-linear relationship to the time duration between the initiator and the CV failure on the appropriate condition. If our assumption is true, we can support the decision-maker in a nuclear emergency giving a theory to surmise the timing of the CV failure from the EAL. Therefore, we tried to identify the proper EALs by surveying the correlations between the timings of EALs and the timing of CV failure. These results are presented in Section 4.
For the CV failure timing, there are several failure modes, such as the over-pressure failure and the over-temperature failure. The thresholds for these failure modes have also several set points, such as 2Pd (twice of design pressure) and 3Pd (three times of design pressure). We selected 2Pd for the over-pressure failure and 200°C for the over-temperature failure as the set points according to a previous study by Japanese operators [Citation9]. Finally, we discuss the effectiveness and the limit of developed method in Section 5.
4. Result
The timing of several notifications based on EALs and the timing of the CV failure (if it failed) were calculated for one sequence. Examples of timings of AEW sequences of the Model B plant and the images of acquired database are shown in . According to , 13 scenarios were analyzed for the AEW sequences of model B. These 13 sequences triggered by 13 kinds of initiators are shown vertically in this . For example, the timing of 11 EALs and the CV failure simulated in the sequences of AEW1 initiated by AHLF scenario (see Section 3) is shown horizontally in the first row of . In this sequence, SE24 was issued 0.56 h after the initiator. The reactor core damaging expressed by GE28 is occurred 1.19 h, and the CV failed 23.00 h. The example of computed results of the progress of this sequence (AEW1 initiated by AHLF scenario) is shown in . According to , some EALs are not notified within 200 h in some scenarios of AEW. The CV did not fail within 200 h in some scenarios. For the AEW scenario, all of these failures were detected by the set point of over-pressure of the CV. The analysed timings of the CV failure were distributed between 22.68 h to 24.64 h.
Table 5. The sample of the timing of EALs and the CV failure for AEW sequences of the Model B plant
Figure 1. The example of computed results of RPV and CV pressure progress of AEW1 sequence (initiated by AHLF scenario).
Similarly, the timings of 11 EALs and the CV failure are also analyzed for all sequences for model A1, A2 and C. As a result, we acquired the data base including the timing of 11 EALs and CV failure for 340 sequences of model plant A1 to C. Based on these data, we confirmed the frequency distribution of each timing of EALs and the correlation between the timing of each EALs and the CV failure (2Pd or 200°C) of all sequences and models for each 11 EALs.
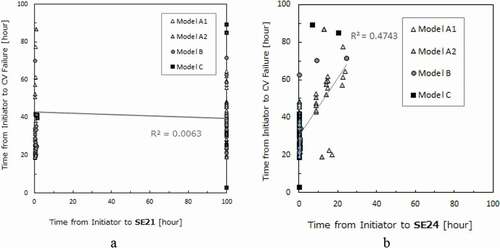
After we acquired the database, we checked the correlation of the timing of each EALs and the CV failures by plotting the data on the times from the initiators to CV failures vs the times from the initiators to each EALs. As we expected, we found that several EALs have stronger correlation and others do not. The example of EALs which have weaker correlation for the CV failure are shown in ( and ). The first group of the weaker correlation is represented by SE21 shown in (the left graph in ). When we plotted the times from the initiators to CV failures vs the times from the initiators to SE21, it could be seen that most of plots of SE21 occurs at short times within 1 or 2 h and this EAL was not issued within 100 h in many sequences. Similarly, the data of GE21, GE24, SE25, GE25, and SE42 formed the similar arrangement. We could not find any correlation between the time duration from initiator to these 6 EALs and the time duration from initiator to the CV failure. The second group of the weaker correlation is represented by SE24 shown in ) (the right graph in ). SE24 was notified in the all sequences, however the correlation between SE24 and the CV failure was also small because the coefficient of determination, R2 of these EALs were 0.4743 for the integrated data of all model plants.
Figure 2. The example of the correlation analysis for two EAL groups which have weaker correlation of the times from the initiators to CV failures vs the times from initiators to EALs.
On the other hand, it could be seen that the results of the correlation analyses for the rest of EALs (GE28, SE41, GE41, GE42) shown in showed relatively higher correlation.
Figure 3. The correlation between timings of EALs and the CV failure classified by the plant model.
In , the plotted data are classified by the 4 plant models of A1, A2, B and C. In order to associate the simulated data to the CV failure scenario for all 4 plants, we rearranged the same data classified by the CV failure modes as shown in . In , we classified the data into 4 different CV failure modes according to NUREG-1150 for 4 plants model [Citation17];
Figure 4. The correlation between timings of EALs and the CV failure classified by the CV failure mode.
-mode; failure due to over-pressure defining as 2Pd in this study
g- and
The results of these analyses are discussed in Section 5.
5. Discussion
In this study, we tried to develop the complementary methods for the decision-makers to determine the timing of the CV failure in SA scenarios from the EALs issued as a nuclear operator’s notification.
As a result of the analyses of the timing of EALs and the CV failure for the domestic PWR’s SA sequences shown in and , it could be seen that there were positive correlations between the timing of the CV failure and the timing of 4 EALs even though these EALs were not issued within 100 h in some sequences. We could not interpret any significant difference between the different models for each plant from where the plotted data were classified by the model plants. However, we could observe the plots in , where the data were classified by the CV failure modes, are organized in clusters of each failure modes. Therefore, we examined the correlation for the mode’s cluster for each CV failure. The coefficient of determination, R2 of each failure mode’s cluster of 4 EALs are shown in . The largest R2 appeared in the first rows of -mode failure. We could observe relatively large correlation in
-mode of SE41 (R2; 0.841) and GE41 (R2; 0.834). The largest R2 for the
-mode was observed in the data of GE41. However, R2 of GE28 and GE42 were relatively small in any failure modes and it is therefore difficult to determine the timing of the CV failure from the issuing timing of these EALs.
Table 6. The coefficient of determination of each CV failure modes of four EALs
We then compared SE41 and GE41 which have large coefficients of determination for the CV failure time. SE41 is issued when the internal pressure of CV reached 0.5Pd, and GE41 is for 1.0Pd (see ). In the most cases, SE41 and GE41 were issued within 24 h from the initiators. SE41 was issued prior to GE41 (approximately 5–12 h earlier than GE41) in all sequences. Therefore, SE41 is a more suitable for the method to determine the timing of the CV failure because it gives the prediction earlier than GE41, and we focused on SE41 in the following discussion.
We developed an equation to determine the timing of -mode CV failure from the timing of SE41. The determined equation to surmise the CV failure from SE41 is shown in . In , at first, we drew the linear approximating curve by the least-squares method to plot of
-mode failure. The intercept of this curve was 19.17 and the slope was 1.42. This evaluation line gives the time difference between SE41 and the CV failure (time duration from 0.5 Pd to 2 Pd) for the decision-making for the protective action. The time difference is 42% of the duration from initial pressure to 0.5 Pd, plus 19.17 h.
Figure 5. The evaluation line to surmise the CV failure from SE41 made with the approximating curve of the data of mode failure.
We interpret that the slope and the intercept of the evaluation line shown in represent the rising speed of CV pressure in SA phenomena, and it also related to the robustness of the CV. For example, it can be seen that the -mode CV failure times of the newest plant C are larger than other model plants according to the plots of SE41 in . We inferred this is because the robustness of the CV of the plant C, made out of the pre-stressed concrete is larger. The results of the analysis of SE41 also showed that
- and
- mode failures were plotted above the distribution of
mode failures, therefore, the surmising the timing of
- and
-mode failures were enveloped by the evaluation line made with the data of
mode failures. Consequently, this evaluation line has a potential to give a complementary information for a decision-maker to evaluate the timing of
-,
- and
-mode CV failure from SE41.
On the contrary, in the results of the correlation between SE41 and CV failure, the bypass mode failures (g- and -mode) were plotted below the
-mode distribution. Therefore, the bypass events weren’t determined by SE41. We also found that the bypass mode failures were not determined by other EALs including GE42 which is related to the loss of barriers (see and the small value of R2 of GE42 in ). However, the occurring of the bypass modes, initiated by SGTR or IS-LOCA can be detected in the early accident phase by the decrease of pressure or level of the reactor coolant, the radiation monitor of the main steam line, stack or the auxiliary building area [Citation9–Citation12]. Therefore, there is possibility for the decision-makers to recognize that the method to determine the CV failure from SE41 cannot be applied for the situation from an operator’s notification, and that they need to make decision not relying on the EAL.
In addition, the other modes such as the base-mat penetration and hydrogen explosion were evaluated in the operator’s documents [Citation9–Citation12]. However, these other modes were not determined. We inferred that - mode and
-mode failures were prior to these other modes in this study because that the Level 1.5 PRA assumed higher pressure point as containment limit pressure than 2Pd. Therefore, these other CV failure modes are also enveloped by the evaluation line generated by only the simulation data resulted in
-mode failure.
Based on the above considerations, we concluded that the developed evaluation method makes it possible for a decision-maker to determine the timing of CV failure except in the CV bypass sequences from an operator’s notification triggered by the EAL; SE41, taking account of the notification of the onset of the bypass mode event.
We acknowledge there are two limitations from the application of MAAP code and the effective purpose of the evaluation for the CV failure time.
First, this method cannot be applied to the SFP events, the filtered venting system operation, or the shutdown situation such as the mid-loop operation because the sequences we generated for the calculations are not applicable for these operational modes. In Japan, EAL30 is prepared for the SFP events, and EAL29 is for the shutdown operation. The operation method of filtered venting system is currently under review by the regulatory authority. Therefore, further studies are possible and expected for these conditions.
Second, in Japan, the protective action for the residents is identified by the first issued SE or GE. Therefore, some might say that there is no need of the prediction of the CV failure. However, the developed method to determine the CV failure time has the potential to support the local municipalities evaluating the possibility of the radiation exposure during the evacuation, corresponding to the required time for the evacuation by the estimate of the evacuation time (ETE). It is therefore expected that further studies will enhance the effectiveness of the emergency preparedness for the nuclear disaster.
6. Conclusion
We analyzed the timings of the EALs issued in all kinds of the SA sequences of several operating PWR. We found high correlation (R2 = 0.841) between the timing of SE41 (CV pressure > 0.5 design pressure) and the timing of over-pressure (= 2 design pressure) failure of the CV and so that we could establish the evaluating method to estimate the CV failure time.
This method has potential to support the decision-making of the protective action for governments in nuclear emergency preparedness.
Acknowledgments
This work was supported by Kansai Electric Power Company and the Institute of Nuclear Safety System. The authors wish to thank Prof. Yoshitaka Yoshida for the great helpful arrangement of the MAAP code analysis. The authors also appreciate Prof. Tadashi Watanabe for the helpful technical comments to prepare this paper.
Disclosure statement
No potential conflict of interest was reported by the authors.
References
- International Atomic Energy Agency. Preparedness and response for a nuclear or radiological emergency: safety standard series No. GS-R-2. 4.20, Functional Requirements. Vienna (Austria): IAEA; 2002. p. 16.
- International Atomic Energy Agency. Preparedness and response for a nuclear or radiological emergency: general safety requirements part 7 safety standard series no. GSR part 7. 5.16, Functional Requirements. Vienna (Austria): IAEA; 2015. p. 19.
- Nuclear Regulation Authority (NRA). Nuclear emergency response guideline revision 3. Tokyo (Japan): NRA; 2013. p. 13–33.
- The Kansai Electric Power Co., Inc. The nuclear operator emergency action plan of Mihama nuclear power plant. Supplement. Osaka (Japan): The Kansai Electric Power Co., Inc.; 2017. p. 83.
- The Kansai Electric Power Co., Inc. The nuclear operator emergency action plan of Takahama nuclear power plant. Supplement. Osaka (Japan): The Kansai Electric Power Co., Inc.; 2017. p. 86.
- The Kansai Electric Power Co., Inc. The nuclear operator emergency action plan of Ohi nuclear power plant. Supplement. Osaka (Japan): The Kansai Electric Power Co., Inc.; 2017. p. 85.
- Sasaki Y. [Current status and issues of Genkai area’s nuclear emergency preparedness system: focusing on the issues in notifying information]. Fukushima Univ Admin Social Sci. 2014; Vol. 27 (4), 52 [in Japanese]
- Nagashima K, Yasuda N Study on description of plant status at fukushima accident by emergency action level. The 26th International Conference on Nuclear Engineering: ICONE26; 2018 Jul 22;London (England).
- The Kansai Electric Power Co., Inc. The amendment of the application for the alteration in the installment license of Takahama Unit 1,2. Tokyo (Japan): Nuclear Regulation Authority; 2016. Supplement 2.I. Attachment 2.1.1, Level 1.5 Probabilistic Risk Assessment; pp. 2.1.1-84. Supplement 2.II. Evaluation for Containment pressure and temperature; pp. 1-27. [in Japanese].
- The Kansai Electric Power Co., Inc. The amendment of the application for the alteration in the installment license of Mihama Unit 3. Tokyo (Japan): Nuclear Regulation Authority; 2016. Supplement 2.I. Attachment 2.1.1, Level 1.5 Probabilistic Risk Assessment; pp. 2.1.1-84.Supplement 2.II. Evaluation for Containment pressure and temperature; pp.1-25. [in Japanese].
- The Kansai Electric Power Co., Inc. The amendment of the application for the alteration in the installment license of Takahama Unit 3,4. Tokyo (Japan): Nuclear Regulation Authority; 2015. Supplement 2.I. Attachment 2.1.1, Level 1.5 Probabilistic Risk Assessment; pp. 2.1.1-82. Supplement 2.II. Evaluation for Containment pressure and temperature; pp. 1-23. [in Japanese].
- The Kansai Electric Power Co., Inc. The amendment of the application for the alteration in the installment license of Ohi Unit 3,4. Tokyo (Japan): Nuclear Regulation Authority; 2017. Supplement 2.I. Attachment 2.1.1, Level 1.5 Probabilistic Risk Assessment; pp. 2.1.1-79. Supplement 2.II. Evaluation for Containment pressure and temperature; pp. 1-25. [in Japanese].
- United States Nuclear Regulatory Commission. Criteria for preparation and evaluation of radiological emergency response plans and preparedness in support of nuclear power plants: NUREG-0654/FEMA-REP-1 Supplement 3 guidance for protective action strategies. Washington, DC (United States): US-NRC; 2011. 2.7, Strategy for Rapidly Progressing Scenarios; pp.9. Note 1, Rapidly Progressing Severe Incident; pp. A-3.
- Rahn F. MAAP4 applications guidance: desktop reference for using Maap4 software, revision 2. Palo Alto. CA (United States): Electric Power Research Institute (EPRI); 2010. 1020236. 2.3, Computational Structure and Design Philosophy of MAAP4; pp.2-10.
- NRA. Analysis of important phenomena on evaluation of countermeasures to prevent containment failure (PWR). Tokyo (Japan): NRA; 2014. Technical report Series NTEC-2014-2001.
- Wachowiak R. Modular accident analysis program (MAAP) –MELCOR Crosswalk Phase 1 Study. Palo Alto. CA (United States): Electric Power Research Institute (EPRI); 2014. Technical Update 3002004449. A.4, Simulation of Bulk Containment Response; A-13.
- Office of Nuclear Regulatory Research. Severe accident risks: an assessment for five U.S. Nuclear Plants. Washington D.C. (USA): U.S.NRC; 1990. NUREG-1150.