
 ?Mathematical formulae have been encoded as MathML and are displayed in this HTML version using MathJax in order to improve their display. Uncheck the box to turn MathJax off. This feature requires Javascript. Click on a formula to zoom.
ABSTRACT
In view of the complexity of current detection efficiency calibration of radioactive gas sources, a method using solid planar sources to be equivalent to gas sources was studied. For the 50 mL gas source box, an optimal equivalent scheme was selected by Monte Carlo Simulations. Then, the full-energy-peak efficiency curve of gas sources at the measurement position of 25 cm, with source-to-detector distance of 25 cm, was fitted by measuring solid planar sources with known activity. To verify the accuracy of the efficiency curve, 41Ar, 133Xe and 87Kr gases were produced and determined by length-compensated method. Then, their full-energy-peak efficiencies at 25 cm position away from the detector were directly calibrated. The percentage efficiency deviations between interpolation from the efficiency curve and direct calibration are all less than 2.5%, which proves the accuracy of the equivalent method. This calibration method is a general one and can be also used for some other radioactive sample measurements, such as non-destructive analysis of gaseous fission product samples with a suitable source-to-detector distance.
1. Introduction
Activity determinations of radioactive gases (85Kr, 133Xe, 135Xe, 131mXe, 133mXe, et al.) play important roles in nuclear reactor safety monitoring and the Comprehensive Nuclear-Test-Ban Treaty (CTBT). To do this, these gases should be collected and prepared for accurate measurement, usually with a high-resolution gamma-ray spectroscopy spectrometry. Accurate calibrations of gamma-ray detection efficiency for gas sources measured on the high purity germanium (HPGe) detectors are the key but not easy work. The most reliable approach is directly direct calibrated with radioactive standard gases. The standard activity can be determined by internal gas counters [Citation1,Citation2] or β-γ coincidence techniques [Citation3–Citation5]. But this method is generally limited to partial nuclides with beta decay mode, suitable half-lives and can be easily produced by (n,γ) or (n,2n) reactions, such as 41Ar,133Xe,135Xe, et al. Another general method is by interpolating from the efficiency curve calibrated by solid or liquid volume sources [Citation6–Citation8]. It is appropriate for most calibration of gas sources. However, the self-absorption correction cannot be neglected and the calibration source preparation procedures are often complex [Citation9,Citation10]. Efficiency can be also obtained from Monte Carlo simulations, which is perfect to calculate the relative the relative efficiency values of sources with different geometric shapes [Citation11,Citation12–Citation14]. But it is difficult to get exact values for the challenge of precise construction for simulation models [Citation15]. Therefore, this method is mostly used in the measurement of environmental samples with low accuracy requirements.
Another widely employed method is efficiency transfer method [Citation12,Citation16–Citation20]. Its basic principle is to obtain the detection efficiency of target sources with different geometries by using the experimental efficiency value of point sources and efficiency transfer factors. The transfer factors between the efficiency of reference point sources and target sources are usually obtained by Monte Carlo simulation or semi-empirical calculation. Saegusa [Citation21] and co-workers detailed described the method for determination of efficiency curves of volume samples by the combination of Monte Carlo simulations and a single-point calibration using a standard point source. It is a general method for most volume source efficiency calibrations, but the efficiency-curves group around the detectors which must be initially obtained is rather a lot of work.
To overcome these drawbacks in this article, a method using solid planar sources to be equivalent to gas sources has been developed. In this article, we firstly describe the principle of the equivalence and selected the optimal equivalent calibration scheme for our measurement system by Monte Carlo Simulations. Then, the processes of efficiency calibration and verification are also described in detail. This method is a simple, general and accurate method and suitable for the efficiency calibration of most regular-shaped gas sources. Strictly speaking, this method also belongs to the efficiency transfer method. However, the equivalent process of this method is simpler, the efficiency transfer factor value is about 1.0 and the uncertainty is small. At the same time, the source box material’s absorption correction for gamma rays is also negligible because we can use the same source box material and thickness. This method is suitable for the efficiency calibration of most regular-shaped gaseous sources.
2. Principle and simulations
2.1. Principle of equivalent efficiency calibration method
The mainly ideal of the equivalent calibrating method is that for every cylindrical volume gaseous source, we can find a planar source with the same cross-section to be equivalent to it. As shown in , a homogeneous cylindrical gas source named S with height of h was placed at the position of H (H≫h) apart from the upper face of the detector. Let S be divided into equal n pieces (n≫1), named Sk (k = 1, 2 … n) respectively. Then, the distance between the bottom of each piece and the upper surface of the detector can be written as:
Figure 1. Schematic diagram of the equivalent method.
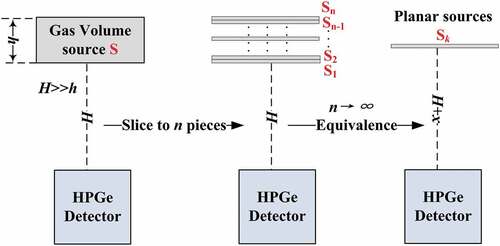
The detection efficiency at energy of Eγ of S and Sk are regard as εS and εk. We can easily know ε1≥ ε2≥ ... ≥εn−1≥ εn and ε1≥ εS≥εn for the inverse relation between the detection efficiency value and source-to-detector distance. When n tends towards infinite, every piece above can be deemed to a planar source and there must be one satisfied formula: εk≈εS. So, the key for the equivalence algorithm is to find appropriate measuring position (H’).
2.2. Simulations
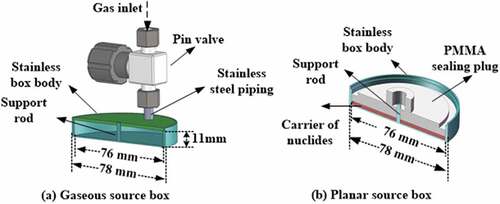
Geant4 simulation toolkit, a software that can simulate the physical process of particle transport in matter [Citation15,Citation22], was used for our simulations. shows the section diagrams of two types of source boxes we used in our simulation models and efficiency calibrations. They have the same diagram diameter of 76 mm and the same bottom and sidewall thicknesses of 1 mm. For the gaseous source box, the air space height inside is 11 mm. Hollow steel pipes were filled in the steel piping between the valve and the box body to reduce the proportion of dead volume to less than 0.1% compared with the volume of the whole box. Then, the dead volume had been neglected in our simulation. The tube between the valve and the main body of the source box is filled with a hollow steel column such that the ratio of the tube’s volume to the volume of the source box is less than 0.1%. Therefore, during the simulation, we ignored this small volume of gas. The carrier of nuclides in the planar source box shown in ) was made of filter paper with less than 0.1 mm thickness. So the self-absorption of it can be neglected.
Figure 2. Section diagrams of two types of source boxes.
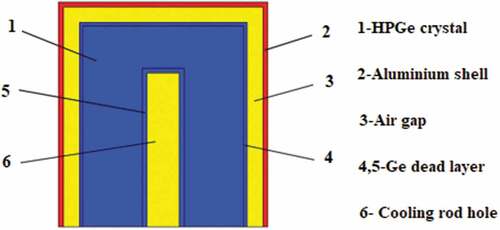
A coaxial HPGe detector model was established and shown in . The detailed parameters mainly provide by manufacturer’s instructions are listed in . Precise parameters are non-essential for we are only interested in the relative efficiency ratios between solid and gas sources at different energy.
Table 1. Mainly parameters of the HPGe detector model.
Figure 3. Schematic diagram of the coaxial HPGe detector.
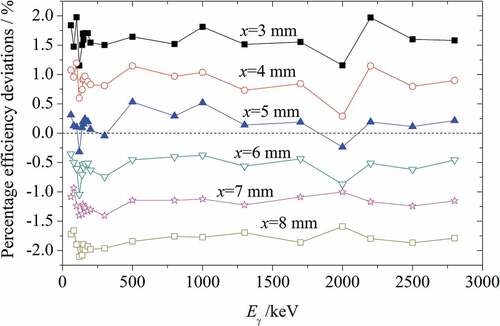
The full-energy efficiencies of the gaseous volume source at position of 25 cm and the solid planar sources at multiple positions H′ = 25 cm+x (x= 3, 4, …, 8 mm) were simulated. The γ-ray full-energy peaks were chosen from 60 keV~2.8 MeV, 20 points in total. The relative standard uncertainties of all simulated values are about 1% when ignored the inaccuracy of geometric models. shows the percentage deviations of the full-energy peak efficiency between the volume source and planar sources with multiple values of x. Obviously, when measuring at a high position apart from the detector, the slight change of measuring positions would bring insignificant variations of efficiency. When x = 5 mm, the deviations for all energy peaks are less than 0.6%, which are within the limits of simulation uncertainties. It indicates that solid planar sources measured at position of 25.5 cm can be used to calibrate the full-energy peak efficiency curve of the gaseous volume source measured at position of 25 cm equivalently.
Figure 4. Percentage efficiency deviations between gaseous volume source and planar sources with multiple values of x.
3. Experimental
3.1. Planar sources preparation and measurement
Radioactive solutions of 152Eu, 75Se, 133Ba, 60Co, 134Cs, 124Sb and 24Na were prepared and their specific activity was determined by the standardized measurement system, respectively. The relative standard uncertainties of the specific activity were about 1.0% (k = 1), except 75Se (1.5%, k = 1). They were dropped on the filter papers of the planar source boxes shown in ) quantitatively and homogeneously. After drying, the filter paper was impacted by sealing plug made of Polymethyl methacrylate (PMMA). Silica gel was used to seal the tiny gap between the plug and the box bodies. For every nuclide, a planar source was prepared.
The planar sources were measured at the position of 25.5 cm distance from the top of a coaxial type HPGe detector with a relative efficiency of 70% and FWHM of 1.9 keV at 1332keV of 60Co. A digital multichannel analyzer (ORTEC DSPECPLUS) and a computer were used to record the γ-ray spectra. The ORTEC software GAMMAVISION was used to extract the necessary data from the spectra. The count rate of the ith ith full-energy peak Ei can be written:
where NSi is the peak net counts at energy Ei, TL and TR are live time and real time of the count, λλ is the decay constant for the measured nuclide.
The coincidence summing effects are negligible when measured at a high position (such as 25.5 cm). So the full-energy peak efficiency at energy Ei can be computed by,
where Pi is the emission probability of gamma-ray at energy of Ei, a (Bq/g) is the specific activity of the radioactive solution of the measured nuclide, M (g) is the mass of injected solution when planar source prepared, F is the self-absorption factor, for the thin filter paper, it equals 1.0.
The relative standard uncertainty of εi is:
where u(ni) is the statistical uncertainty of ni for multiple measurements, u(M) is about 0.5%, u(Pi) is given by the evaluations nuclear database ENDF/B-VII.1 [Citation16] [Citation23]. u (a) is relative standard uncertainty of a: for 75Se, it is 1.5%; and for others, it is 1.0%; u(Fi)≈0.
The main γ-ray peak energy, emission probabilities, measured efficiencies and their relative standard uncertainties of these nuclides are listed in .
Table 2. Mainly γ-ray peak energy, emission probabilities, measured efficiencies, and their relative standard uncertainties.
3.2. Efficiency curve fitting
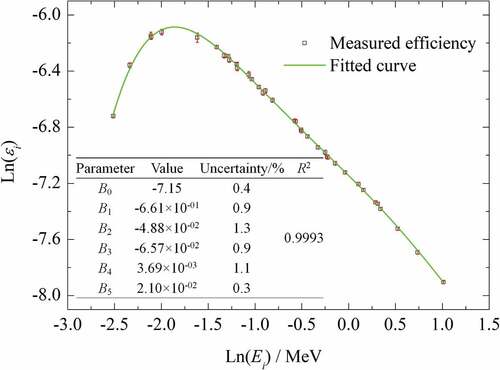
The full-energy efficiency function was derived as fifth-order polynomials in double logarithmic scale [Citation24]:
where Bk(k = 0,1,2,3,4,5) is the polynomial coefficient; the unit of Ei is MeV, i = 1,2,3, … 37 (shown in ). The values of εi and Ei (i = 1, 2, 3 … 37) are listed in , but here the unit of Ei is MeV.
The weighted least square method was used to fit EquationEquation (5)(5)
(5) . The independent variable matrix X can be written as,
And the Y matrix is:
Use the reciprocal value of the square of relative standard uncertainties listed in to make up the weight matrix W:
Then, the polynomial coefficient matrix and its covariance matrix are given by the following equations:
The fitting efficiency curve was and parameters are shown in . Where R2 is the goodness of fit.
Figure 5. Efficiency curve fitted by weighted least square method.
For arbitrary energy Ex, its full-energy peak efficiency ε (Ex) and covariance matrix of efficiencyare obtained by:
3.3. Verification
To verify the accuracy of the efficiency curve above, the full-energy-peak efficiencies of 133Xe, 87Kr and 41Ar were also directly calibrated with radioactive gases and then compared with the values interpolated by EquationEquation (11)(11)
(11) . The major characteristic γ-ray energy peaks of these three radioactive gases are 81 keV, 402 keV, and 1294 keV, respectively.
3.3.1. Gas source preparation
Three types of polyethylene targets containing high purity target gas were prepared. Each contains about 1 mL of 132Xe, 86Kr or 40Ar in volume in standard condition. Then, they were irradiated in the pneumatic rabbit tube of Xi’an Pulsed Reactor with thermal neutron flux about 1013 n/(cm2·s) for several minutes, to produce enough 133Xe, 87Kr and 41Ar, respectively. After irradiation and cooling, the targets were used to prepare gas sources. shows the schematic diagram of the gas source preparation platform. Where Y1~ Y7 are valves.
Figure 6. Schematic diagram of the gas source preparation platform.
where Y1~ Y11 are valves; V1,V2, and V3 are three sections of pipeline sealed by corresponding valves; GS1 is the 50 ml gas source box for γ measurement; PC1, PC2, and PC3 are proportional counters with different volumes and used for specific activity measurement. The carrier gases were natural xeon gas for 133Xe, natural krypton gas for 87Kr and P10 (90% Ar +10% CH4) gas for 41Ar.
The relative activity ratio (RV) between GS1 and PC3 can be derived from the volumes of pipelines, three counters, and GS1.
Take the preparation of 87Kr sources as an example to illustrate the preparation process. Put the 86Kr target into target breaker. Vacuumize the whole platform (except the carrier gas bottle) and close all the valves. Break the target and open Y2, Y4 and Y11 so that 87Kr can be carried to the buffer tank by the carrier gas (P10 gas: 90% 40Ar+10% CH4). Close Y2 and Y4, vacuumize V3. Then, open Y1, Y4, Y5, and Y6 after waiting for 3 min. Close Y1 and Y6. By now, the 50 ml gas source (GS1) has been prepared.
Open Y8 and let the gas in V1 diffuse into PC3, close Y8 after 3 min. vacuumize V1, V2, V3 and target breaker. Then, close Y10 and guide the carrier gas into V1 and adjust the pressure to 400 kPa. Open Y8 and fill PC3 with 400 kPa carrier gas. Close Y8 and Y6, vacuumize V1 for 10 min. Close Y10, open Y7, Y8 and Y9 for 5 min. Close Y7, Y8 and Y9 and now three sources for proportional counter measurement have been prepared.
Preparations of 133Xe and 41Ar sources are on the whole the same. The relative activity ratio (RV) between GS1 and PC3 can be derived from the volumes of pipelines, three counters, and GS1:
where V(GS1) is the volume of GS1; V(PC1), V(PC2) and V(PC3) are the volumes of three counters, respectively.
3.3.2. Direct efficiency calibration of 133Xe, 87Kr, and 41Ar
Let’s continue with take the full-energy-peak efficiency calibration of 87Kr (402 keV) as an example. The proportional counters were sent to metering station to determine the specific activity of 87Kr by length-compensated method. The determination principle, internal gas proportion counters system, and data analysis processes are described in reference [Citation6] in detail. GS1 was measured at 25 cm position distance from the top of the detector mentioned before. The efficiency at energy of 402 keV can be calculated by:
where n is the full-energy-peak net counting rate at reference time, Pγ is the emission probability of 402 keV, a is the specific activity of 87Kr at reference time, F is the self-absorption factor, F≈ 1.0 when the source pressure is not very high.
The direct calibration results of these three peaks are shown in .
Table 3. Directly calibrated efficiency (εd) of 81 keV, 402 keV, and 1294 keV.
The major contributions to the relative standard uncertainties of directly calibrated efficiencies are listed in .
Table 4. Major contributions to the uncertainties of directly calibrated efficiencies.
3.3.3. Comparison of the efficiencies calibrated by equivalent and direct method
shows the efficiencies and their uncertainties of 81 keV, 402 keV, and 1294 keV interpolated by the equivalent efficiency curve. The percentage efficiency deviations from the values calibrated by direct method (εd) are also shown. The results of two methods are consistent in the uncertainty range, indicating the accuracy of the equivalent calibration method.
Table 5. Efficiency calibrated by equivalent method and comparison with direct calibration results.
4. Conclusion and discussion
The exact detection efficiency calibration is a foundational but not easy work for gaseous sample measurements. In this paper, a new efficiency calibration method for gas sources was investigated and verified. With GEANT4 simulation toolkit, we choose the best measurement position of the planar source to be equivalent to the gas source measurement. Then, the equivalent efficiency curve was fitted by the measurement of several planar sources. The full-energy peak efficiencies of 133Xe (81 keV), 87Kr (402 keV) and 41Ar (1294 keV) were also directly calibrated with their activities determined by length-compensated method. The efficiencies calibrated by the two methods are consistent well in the uncertainty range, indicating the accuracy of the equivalent calibration method.
Most of the nuclides we used in preparation of the planar sources have much longer half-lives than that of the radioactive gases. Thus, they can be easily prepared and preserved. This equivalent efficiency calibration ideal is a general one and can be also used for some other radioactive sample measurements. For example, when do non-destructive analyses of the gaseous fission products sealed in small quartz tubes and measured with a bit higher source-to-detector distance compared with the length of the tubes [Citation25], we can use the equivalent efficiency curve calibrated by solid point-like point sources. It should be pointed out that the self-absorption factors should be considered if necessary.
In addition to the detection efficiency calibration of radioactive gas sources, another purpose of establishing this method is to calibrate the detection efficiency of fission products in fission ionization chambers for our future fission yield measurement projects. Our ionization chamber is similar in shape to that in reference [Citation26] (see its ), but is completely sealed in structure, allowing non-destructive measurements of both gaseous and solid fission products after irradiation.
Disclosure statement
No potential conflict of interest was reported by the authors.
References
- Yunoki A, Yamada T, Kawada Y, et al. Activity measurement of 85Kr diluted by a large volume balloon technique. Appl Radiat Isot. 2010;68(7–8):1340–1343.
- Williams RM, Aalseth CE, Brandenberger JM, et al. Development of a low-level 39Ar calibration standard - Analysis by absolute gas counting measurements augmented with simulation. Appl Radiat Isot. 2017;126:243–248.
- McIntyre JI, Cooper M, Carman AJ, et al. Concentration independent calibration of β-γ coincidence detector using 131mXe and 133Xe. J Radioanal Nucl Chem. 2009;282(3):755–759.
- Xie F, Li XS, Dai YH, et al. Activity determination of 41Ar using efficiency extrapolation method and 4πβ (PS)-4πγ (NaI) coincidence. Appl Radiat Isot. 2015;97:8–11.
- Popov YS, Kazarinov NM, Popov VY, et al. Measuring low activities of fission-product xenon isotopes using the β-γ coincidence method. Instrum Exp Tech. 2005;48(3):380–386.
- Xie F, He XB, Zhang XL, et al. Redetermination of γ emission probability for 87Kr. Atom Energy Sci Tech. 2010;44(5):517–519. [in Chinese].
- Chen ZY, Xie F, Wang HX, et al. Preparation of calibration sources of 88Kr and 138Xe for HPGe detector. J Radioanal Nucl Chem. 2007;273(1):257–261.
- Qin GX, Liu YJ, Wu HX, et al. Efficiency calibration of a HPGe detector for the measurement of the primary coolant. J Radioanal Nucl Chem. 2016;310(3):1033–1040.
- McMahon CA, M F F, Wong J, et al. Determination of self-absorption corrections for gamma analysis of environmental samples: comparing gamma-absorption curves and spiked matrix-matched samples. Appl Radiat Isot. 2004;60(2–4):571–577.
- Hasan M, Bódizs D, Czifrus S. A simplified technique to determine the self-absorption correction for sediment samples. Appl Radiat Isot. 2002;57:915–918.
- Pibida L, Nafee SS, Unterweger M, et al. Calibration of HPGe gamma-ray detectors for measurement of radioactive noble gas sources. Appl Radiat Isot. 2007;65(2):225–233.
- Oishi T, Yoshida M, Saegusa J, et al. Determination of detection efficiency curve for a gas monitor with a built-in germanium detector. J Nucl Sci Technol. 2001;38(3):203–208.
- Tian ZN, Ouyang XP, Li Z, et al. Virtual point source efficiency calibration method for voluminous sample of radio-xenon based on efficiency function of point source. J Radioanal Nucl Chem. 2016;308(2):579–586.
- Dryak P, Experimental KP. MC determination of HPGe detector efficiency in the 40-2754 keV energy range for measuring point source geometry with the source-to-detector distance of 25 cm. Appl Radiat Isot. 2006;64(10–11):1346–1349.
- Kurihara O, Takasaki K, Momose T, et al. Computational evaluation of peak efficiencies for a whole-body counter with scanning germanium detectors. J Nucl Sci Technol. 2001;41(sup4):243–246.
- Gouda MM, Badawi MS, El-Khatib AM, et al. Calculation of NaI(Tl) detector full-energy peak efficiency using the efficiency transfer method for small radioactive cylindrical sources. Nucl Technol Radiat. 2016;31(2):150–158.
- Vidmar T, Gasparro J. Crystal rounding and the efficiency transfer method in gamma-ray spectrometry. Appl Radiat Isot. 2009;67(11):2057–2061.
- Lépy MC, Altzitzoglou T, Arnold D, et al. Intercomparison of efficiency transfer software for gamma-ray spectrometry. Appl Radiat Isot. 2001;55(4):493–503.
- Liu LY, Ma JZ, Didier F, et al. Monte Carlo efficiency transfermethod for full energy peak efficiency calibration of three type HPGe detectors: A coaxial N-type, acoaxial P-type and four BEGe detectors. Nucl Instrum Meth A. 2006;564(1):608–613.
- Abbas MI, Badawi MS, Ruskov IN, et al. Calibration of а single hexagonal NaI(Tl) detector using a new numerical method based on the efficiency transfer method. Nucl Data Sheets. 2015;771(000):110–114.
- Saegusa J, Oishi T, Kawasaki K, et al. Determination of gamma-ray efficiency curves for volume samples by the combination of monte carlo simulations and point source calibration[J]. J Nucl Sci Technol. 2000;37(12):1075–1081.
- Agostinelli S, Allison J, Amako K, et al. GEANT4-a simulation toolkit. Nucl Instrum Meth A. 2003;506(3):250–303.
- Chadwick MB, Herman M, Obložinský P, et al. ENDF/B-VII.1 nuclear data for science and technology: cross sections, covariances, fission product yields and decay data. Nucl Data Sheets. 2011;112(12):2887–2996.
- Gilmore GR. Practical Gamma-ray Spectrometry. 2nd ed. Warrington(UK): Nuclear Training Services Ltd; 2008. p. 203.
- Pierson BD, Prinke AM, Greenwood LR, et al. Improved cumulative fission yield measurements with fission spectrum neutrons on 235U. Nucl Data Sheets. 2019;155(000):86–97.
- Selby HD, Mac Innes MR, Barr DW, et al. Fission product data measured at Los Alamos for fission spectrum and thermal neutrons on 239Pu, 235U, 238U. Nucl Data Sheets. 2010;111(12):2891–2922.