
 ?Mathematical formulae have been encoded as MathML and are displayed in this HTML version using MathJax in order to improve their display. Uncheck the box to turn MathJax off. This feature requires Javascript. Click on a formula to zoom.
ABSTRACT
To estimate the subcriticality in dollar units for an arbitrary state-change, the time-domain decomposition-based integral method (TDDI) is proposed using the point kinetics theory based on the fundamental mode approximation. In a general transient subcritical system, reactivity, neutron source intensity, and point kinetics parameters can vary simultaneously. Furthermore, the state-change may not necessarily be a stepwise change. For such a transient, the TDDI method can estimate the subcriticality after the transient using only the time variation of the neutron count rate. Therefore, the proposed method is useful to approximately estimate the subcriticality in a system where a detailed core configuration is unknown. To investigate the applicability of the TDDI method, transient experiments with simultaneous reactivity and source changes or to two successive safety rods dropping were performed at the Kindai University Training and Research Reactor (UTR-KINKI). By comparing with reference values using excess reactivity and control rod worth, it was validated that the subcriticality values obtained by the TDDI method better agree with the reference values than the previous integral method.
1. Introduction
The subcriticality measurement technique is important to assure the safety margin from the critical state. Although various measurement techniques have been proposed to measure the subcriticality (or negative reactivity ), there are still problems to be addressed in applying the technique to a general transient situation, where not only
but also the neutron source intensity
and point kinetics parameters (neutron generation time
and the effective delayed neutron fraction
) can be simultaneously varied.
For example, consider the application of the subcriticality monitoring to the refuelling process at a boiling water reactor (BWR) in shutdown state [Citation1,Citation2]. During refuelling or handling of a control rod in BWR, operators confirm the magnitude of neutron flux in the low-power (startup) condition by the startup range neutron monitor (SRNM) [Citation3]. Because the SRNM requires minimum neutron count rate to assure its intactness, burnt fuel assemblies containing inherent neutron sources (e.g. spontaneous fissions of 242Cm and 244Cm) or an external neutron source is loaded at first around a detector during refuelling. Thereby, and
can change simultaneously during the refuelling. In addition, the point kinetics parameters can also vary, because the change of fuel loading pattern yields the spatial variations in fission rate and importance function, and thereby affects the point kinetics parameters.
Another example is the subcriticality measurement in the removal of fuel debris at the Fukushima Daiichi nuclear power plants. The fuel debris includes the spontaneous fission nuclides such as 242Cm and 244Cm, which are also contributors for 135Xe and 88Kr detected by the primary containment vessel (PCV) gas monitoring system [Citation4]. The removal process has an impact on both and
, i.e. fissile and neutron-source nuclides are simultaneously removed. If the moderation ratio (or the H/U ratio) varies owing to the submerging and the drilling operation, this variation also results in the simultaneous changes of
and point kinetics parameters. In addition, because the detailed condition is not well known, there are large uncertainties in the preliminary analysis of
and point kinetics parameters. Although the detailed material compositions and spatial distribution are unknown, the major fissile nuclide in fuel debris seems to be 235U. The relative delayed neutron yields
of 235U [Citation5] is reasonable as the representative value used in the subcritical measurement.
In the above-mentioned simultaneous transient, time variation in neutron count rate cannot be distinguished into each of the components due to ,
, and point kinetics parameters, meaning that the subcriticality measurement by the conventional neutron source multiplication (NSM) method [Citation6–Citation8] or inverse kinetics method [Citation9–Citation11] is difficult because
and point kinetics parameters are generally assumed to be constant. Although the continuous subcriticality monitoring during the transient is a challenging problem, if steady-state values of neutron count rates can be measured under both steady-states before and after the transient, other measurement techniques have applicability to evaluate the subcriticality after the transient. For this investigation, we refocused on the integral method, which can estimate the subcriticality in dollar units after a stepwise transient, using only the time variation in the neutron count rate [Citation12]. Note that the previous integral method had an issue with its applicability to a more general event where a stepwise state-change does not necessarily occur. Thus, in the previous study [Citation13,Citation14], ‘time-domain decomposition-based integral (TDDI) method’ was proposed using the point kinetics theory based on the fundamental mode approximation. Similar to the integral method, the TDDI method requires only the time variation in the neutron count rate to estimate the subcriticality. Furthermore, when an arbitrary state-change (e.g. step- or ramp-wise variations in
,
, and kinetics parameters) occurs, the TDDI method can approximately estimate the subcriticality without the following information: (1) the reference subcriticality
before the transient, (2) the absolute values of neutron source intensity and the point kinetics parameters before and after the transient, and (3) the time variation in them. The above-mentioned key points are important advantages in the use of the TDDI method, especially for an unknown system. Note that, since the TDDI method is based on the point kinetics theory, there is a measurement error due to this approximation. To reduce the measurement error due to the higher-order modes of neutron flux, neutron detector position should be carefully chosen.
The goal of our research is to develop the subcriticality measurement technique after the transient, when the neutron count during a certain counting gate width (typical width between 0.1 and 1 s) is successively measured in the subcritical system. In the previous study, the verification of the integral and TDDI method was performed via virtual numerical experiments [Citation12,Citation13]. Subsequently, the applicability of the TDDI method to an actual experimental facility was investigated through transient experiments in a source-driven subcritical system conducted at the Kyoto University Critical Assembly (KUCA) [Citation14]. However, a transient experiment with a simultaneous change of and
was not sufficiently investigated because a startup source of Am-Be was utilized as the steady external neutron source. This study aims to investigate the further applicability of the TDDI method to a more complicated transient caused by the simultaneous change. For this purpose, transient experiments with the operation of control rods and an external neutron source were conducted at the Kindai (formerly named Kinki) University Training and Research Reactor (UTR-KINKI).
Subsequent sections of the paper are structured as follows. In Section 2, the theory of the TDDI method is explained. The experimental conditions and results are described in Section 3. Finally, conclusions are presented in Section 4.
2. Time-domain decomposition-based integral method
2.1. Theory
In this section, the theory of the measurement method for the subcriticality in dollar units using the time-domain decomposition-based integral method (TDDI) is explained. The proposed methodology is based on the ‘point kinetics theory,’ which can be derived by the fundamental mode approximation for space and time-dependent neutron transport equation. By assuming time-dependent neutron flux can be expanded by forward
-eigenfunctions and the fundamental mode component is dominant,
is approximated by a product of amplitude function
and the fundamental eigenfunction
:
where satisfies the following
-eigenvalue equation:
where and
represent net neutron loss and total neutron production operators, respectively. Based on this assumption, time-dependent neutron count rate
is approximately proportional to the amplitude function
related to the fundamental mode:
where is macroscopic neutron detection cross-section; the brackets
indicate the integral over all phase space; and the factor
corresponds to the detection efficiency, which is assumed to be constant in this study. The approximation of EquationEquation (3)
(3)
(3) is appropriate for a shallow subcritical system. In the case of a deeper subcritical system, the neutron detector should be carefully located to reduce the higher-order mode components because the higher mode effect increases as the subcriticality deepens.
By applying the approximation of EquationEquation (3)(3)
(3) to the time-dependent neutron transport equation in a subcritical system with an external neutron source, the point kinetics equation with six delayed neutron precursor groups can be obtained as the following simultaneous differential equations [Citation15]:
where the notations are conventional meanings in the reactor physics. Since corresponds to the product
and
, the notations
and
are also defined by the products
and these time-dependent fundamental modes of amplitude functions for the delayed neutron precursors and the external neutron source, respectively. It is noted that the point kinetics parameters (effective delayed neutron fraction
and neutron generation time
) in EquationEquations (5)
(5)
(5) –(Equation7
(7)
(7) ) are defined by the forward and adjoint fundamental
-eigenfunctions, which depend on a state of core configuration at time
. The neutron count rate
and the amplitudes of delayed neutron precursors
vary over time, according to the temporal changes of not only the reactivity
but also the amplitude of external neutron source
and the point kinetics parameters.
Considering the steady-state before a transient (e.g. the ramp-wise state-change), the initial values of and
before the transient can be obtained as follows:
where the subscript ‘0ʹ indicates the variable at steady-state before the transient. It is assumed that the transient of state-change occurs over a certain time interval from to
. An example of a ramp-wise transient of state-change is shown in . It is noted that the transient of state-change is not necessarily linear ramp-wise as shown in , although the variation in
is assumed to be monotonically increasing or decreasing.
After the transient of state-change terminates at ,
and
converge to the saturation values
and
, respectively, in the limit of
. After the ending time
, the point kinetics equations are expressed as:
where the subscript ‘1ʹ indicates variable after the transient (). Based on the fundamental mode approximation,
and
are assumed to be constant because the forward and adjoint fundamental
-eigenfunctions are unchanged after the transient. In EquationEquations (10)
(10)
(10) and (Equation11
(11)
(11) ), the time derivatives become zero at steady-state after a sufficiently long time from
, if the system is still in the subcritical state after the transient. From EquationEquations (10)
(10)
(10) and (Equation11
(11)
(11) ), the saturation values
and
satisfy the following equations:
By subtracting EquationEquations (12)(12)
(12) and (Equation13
(13)
(13) ) from EquationEquations (10)
(10)
(10) and (Equation11
(11)
(11) ) respectively, the following two equations can be obtained to eliminate the term of
:
By integrating EquationEquations (14)(14)
(14) and (Equation15
(15)
(15) ) within the range of
, these equations are transformed into:
where and
represent the variables just at
. By substituting EquationEquation (17)
(17)
(17) into EquationEquation (16)
(16)
(16) and utilizing EquationEquation (7)
(7)
(7) , the following equation can be obtained:
The purpose of this study is to approximately estimate the subcriticality using only the time variation in
, without any information on the parameters after the state-change, i.e. it is required to eliminate
,
and
in EquationEquation (18)
(18)
(18) . For this purpose, firstly, the saturation value of
can be derived from EquationEquation (13)
(13)
(13) :
Secondly, to evaluate using only the time variation in
, both sides of EquationEquation (6)
(6)
(6) are multiplied by
and transformed into the following time differential equation:
For simplicity, the proposed method assumes that the decay of delayed neutron precursor is dominant in the time variation in , i.e.,
during the transient is smaller than
. Although the assumption of
yields the approximation error, this assumption is reasonable if the transient interval (
) is relatively long (e.g., several tens of seconds) for the change ratio of
. Based on this approximation, EquationEquation (20)
(20)
(20) can be approximately solved to obtain the solution of
at
:
where the relationship in EquationEquation (9)(9)
(9) is utilized to express
using
and
. Thirdly, by substituting EquationEquations (19)
(19)
(19) and (Equation21
(21)
(21) ) into EquationEquation (18)
(18)
(18) , the subcriticality in dollar units
after the transient of state-change can be expressed as follows:
In EquationEquation (22)(22)
(22) , the following approximation is assumed to be applicable. First, relative delayed neutron yields are known as constant, i.e.
, where
is the
th group relative delayed neutron yield [Citation5]. Second,
is negligibly small compared to the second term of the numerator, because the magnitude of
s is much smaller than
s and the following magnitude correlation holds true if the time variation in
is monotonically increasing (
) or decreasing (
):
Finally, the TDDI method can be obtained to estimate the subcriticality in dollar units for the transient as shown in EquationEquation (24)(24)
(24) :
EquationEquation (24)(24)
(24) is the measurement principle of the TDDI method that can estimate the subcriticality in dollar units using only the time variation in
for an arbitrary transient of state-change in a subcritical system. If a transient of state-change is as quick as a stepwise change, i.e.
, the TDDI method of EquationEquation (24)
(24)
(24) can be further simplified into the integral method [Citation12], which is essentially the same as the extended integral count technique [Citation16]:
Compared with EquationEquation (25)(25)
(25) , the subcriticality estimation using the TDDI method requires an additional numerical calculation for a convolution of
.
2.2. Actual experimental procedures
To measure the subcriticality using the TDDI method based on EquationEquation (24)(24)
(24) , the initial value
, saturation value
, convolution
, and integral
are necessary. In the case of an actual experiment, a neutron count rate at
is obtained from a neutron count
during a certain counting gate width
:
Since each of neutron count statistically fluctuates, the time variation in the neutron count rate has a statistical error. If instantaneous values of neutron count rates at certain times are simply chosen as
and
, the subcriticality obtained by the TDDI method will have a large statistical error owing to the statistical fluctuations of
and
.
Figure 1. Example of a ramp-wise transient.
Figure 2. Time intervals for initial value, convolution, integral, and saturation value of neutron counts.
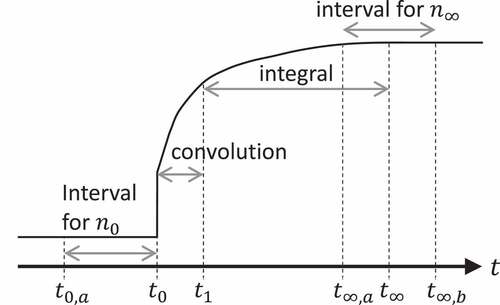
Figure 3. Top view of experimental core.
To address this problem, the mean values of the neutron count rates within two intervals are used as and
as shown in . Namely, the moving average within the range of
is used as the initial value
in the steady-state. Similarly, the moving average within the range of
is regarded as the saturation value
. Note that the neutron count rates within the range of
and
gradually approaches the ideal saturation value. Therefore, the average time
is set as
in this experimental analysis. The convolution and integral in EquationEquation (24)
(24)
(24) are numerically calculated using the trapezoidal rule.
2.3. Statistical error estimation using random sampling method
In an actual experiment, there are statistical fluctuations in measured time-series data of neutron counts , which result in the statistical error of estimated subcriticality using the TDDI method. If the probability distribution of
follows the Poisson distribution, the statistical error
can be estimated by the standard deviation of the Poisson distribution, because the variance is equal to the mean:
Note that, in a neutron multiplication system, the variance of neutron count is generally larger than the mean, i.e. the second-order neutron correlation factor is larger than zero owing to the fission chain reactions [Citation17]. The
value represents the relative difference between the mean and the variance from the Poisson distribution, thus the statistical error of EquationEquation (27)
(27)
(27) can be corrected using the
value:
Here, the magnitude of is proportional to neutron detection efficiency. If the neutron detection efficiency is relatively low or
, the variance of neutron count is nearly equal to the mean because the Poisson process of neutron-detection is dominant. Then, the statistical error of neutron count for each counting gate can be roughly estimated by EquationEquation (27)
(27)
(27) based on approximation of the Poisson distribution.
In addition, the statistical error of the subcriticality can be approximately estimated using the propagation of uncertainty:
where is the total number of neutron-count data and
is a function to evaluate the subcriticality from input variables (i.e., time-series data of neutron counts
), which corresponds to EquationEquation (24)
(24)
(24) . However, even if the statistical error of neutron count
is given by EquationEquation (27)
(27)
(27) , it is cumbersome to estimate the statistical error of the subcriticality using the propagation of uncertainty. This is because the estimation formula using EquationEquation (29)
(29)
(29) with EquationEquation (24)
(24)
(24) is complicated due to the numerical convolution and integral.
To address the cumbersome procedure of error estimation, the uncertainty quantification based on the random sampling method is applied in this study [Citation18–Citation20]. In other words, the statistical error of the TDDI method is evaluated using the random sampling method, instead of EquationEquation (29)(29)
(29) based on the propagation of uncertainty. The detailed procedures are presented below:
Original time-series data of neutron counts
are provided by arranging
A vector of the virtual time-series data
Using Equationequation (24)
To estimate the statistical error of subcriticality, steps 2–3 are repeated
Finally, the statistical error of the subcriticality by the TDDI method can be simply estimated by the 95% confidence interval (CI) of
3. Experimental conditions of subcritical transient experiments
To confirm the applicability of the TDDI method to an actual subcritical system with simultaneous reactivity and source changes, subcritical transient experiments were conducted in the UTR-KINKI [Citation21].
The UTR-KINKI reactor is a light-water-moderated and graphite-reflected two-core reactor. illustrates the top view of the experimental core with positions of a neutron detector and an external source. The reactor has four control rods in symmetrical positions. Two of them are assigned as safety rods (#1 and #2) for reactor scram and manual shutdown. Others are a ‘shim rod’ for scram and coarse adjustment of reactivity, and a ‘regulating rod’ for auto operation and fine adjustment of reactivity. Positive or negative reactivity insertion was given by withdrawing or inserting the shim and regulating rods. To change the effective neutron source strength, an external neutron source of Pu-Be was jerked or dropped through the source hole in the experimental system. Although the detection efficiency of neutron count decreases, a BF3 neutron detector was located as far from the neutron source as possible to reduce the detection of direct neutrons from the Pu-Be source. Thereby, we tried reducing to the higher mode effect due to the external neutron source. Using the detector with a list-mode data acquisition system (ANSeeN, HSDMCA), time-series data of neutron counts were successively measured during the counting gate width s, of which the discretization error seemed to be smaller than a typical statistical error of the neutron count during
in the present experiments (e.g., the relative statistical error of the neutron count is larger than 3%, as presented later in ).
Table 1. Time configurations for TDDI method.
Table 2. Measurement results of subcriticality.
Table 3. Mean, variance, and value for initial and saturation values of neutron counts.
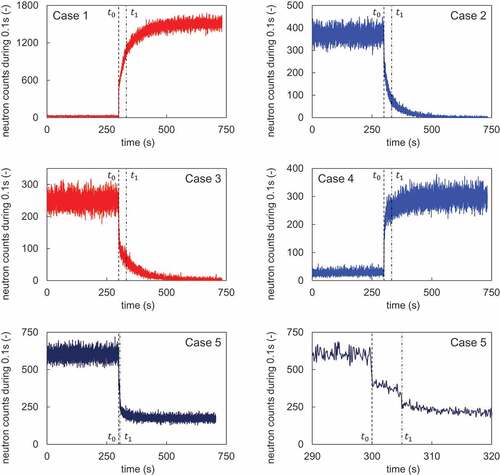
Figure 4. Time variations in neutron counts after transients.
When time-series data of neutron counts were measured from s, the following various transient experiments were carried out by operations of the shim and regulating rods, and the external neutron source in the subcritical core:
Case 1: Positive reactivity insertion and source increase. Initially, two safety rods were fully withdrawn, the shim and regulating rods were fully inserted (initial subcriticality 0.638$), and the neutron source was partially inserted. At
Case 2: Negative reactivity insertion and source reduction. The initial condition of the safety, shim, and regulating rods were the same as the last condition of Case 1, i.e. two safety rods and regulating rod were fully withdrawn, the shim rod was fully inserted (initial subcriticality 0.463$), while the neutron source was fully inserted. At
Case 3: Positive reactivity insertion and source reduction. The initial condition of the safety, shim, and regulating rods were the same as the last condition of Case 2 (initial subcriticality 0.638$), while the neutron source was fully inserted. At
Case 4: Negative reactivity insertion and source increase. The initial condition of the safety, shim, and regulating rods were the same as the last condition of Case 3 (initial subcriticality 0.463$), while the neutron source was partially inserted. At
Case 5: Two successive events of negative reactivity insertion. The initial condition of the safety, shim, and regulating rods were the same as the last condition of Case 4 (initial subcriticality 0.638$), and the neutron source was completely inserted. Initially, the safety rod #1 was dropped at
shows the time variation in neutron counts for Cases 1–5. For Case 5, two figures with different time ranges are presented to show the overall trend and the short-term variation after two successive rod drops. As can be seen from , the neutron counts after the transient in Case 3 decrease in spite of the positive reactivity insertion by withdrawing the regulating rod, because the external source was jerked. Contrarily, the neutron counts after the transient in Case 4 gradually saturates owing to the external source drop, although the negative reactivity insertion was given by the regulating rod. In Case 5, the transient behaviour was more complicated due to the two successive safety rod drops.
lists the time configurations of ,
,
,
,
, and
for the TDDI method. To confirm the improvement of the measurement accuracy by the TDDI method, the estimation using the integral method approximated by EquationEquation (25)
(25)
(25) was also performed in almost the same conditions except for
. In the integral method, the decomposition of the time-domain for the convolution and integral is not necessary, thus only one integral-interval was set from
to
. Using these conditions, evaluation of the subcriticality in dollar units by both the TDDI and integral method was performed.
Before the above-mentioned transient experiments, the excess reactivity and control rod worth were preliminarily measured by the positive period method and the rod drop method, respectively. These measurement values were utilized to evaluate reference values of the subcriticality in dollar units for each of Cases 1–5. For supplemental information, the subcriticality values after the transients were estimated by the conventional NSM method [Citation6–Citation8] using the initial subcriticality and the count ratio of to
.
4. Experimental results
lists the subcritical measurement results using the NSM, integral, and TDDI methods with these statistical errors (95% CIs). As can be seen from , the conventional NSM method for Cases 1–4 had larger discrepancies from the reference values. Especially in Cases 3 and 4, the estimated subcriticality is qualitatively inappropriate. This is because the conventional NSM method neglects the neutron-source change. Since the neutron source was unchanged in Case 5, the estimated subcriticality using the NSM method well agree with the reference value after the transient.
Interestingly, note that the integral and TDDI methods enabled estimation of subcriticality even when the increasing or decreasing trend of neutron count rate did not correspond to that of reactivity. In addition, it was confirmed that the measurement results of the TDDI method were closer to reference values than those of the integral method, because the integral method assumes a transient as a stepwise change. Although the statistical errors of estimated subcriticality using the integral method were smaller than those of the TDDI method, the difference between the estimated subcriticality using the integral method and reference values were quite larger than these statistical errors of 95% CIs.
The statistical error of the TDDI method seemed to increase as the magnitude of the integral decreases according to the subcriticality and source strength after the transient, because
could be a major contribution to the relative statistical error based on the propagation of uncertainty. Compared with the difference between the measurement results by the TDDI method and reference values, the estimated statistical errors by the 95% CIs based on the Poisson distribution seemed to be slightly underestimated. To discuss this reason, summarizes the mean, variance, and second-order neutron correlation factor
for initial and saturation values of neutron counts. Here, the values of the mean, variance, and
were estimated from the time-series data of neutron counts within the range of steady-states (
and
), therefore the estimated
value could be regarded as the correction factor for the statistical error of neutron counts in EquationEquation (28)
(28)
(28) . Although the
values were roughly less than unity, the
value tended to be larger than zero as the subcriticality became shallow. Namely, since the neutron-correlation due to the fission chain reactions in the subcritical systems was detectable, the probability distributions of neutron counts slightly differed from the Poisson distribution. If the neutron-correlation effect is considered, the statistical errors by the random sampling method seem to be underestimated by a factor of
based on EquationEquation (28)
(28)
(28) . This correction method for the statistical error by the random sampling method is future research because the issue is more difficult for time-series data of neutron counts under a transient from
to
.
In the present transient experiments, the starting time and ending time
of transient were known beforehand by the operation records. The saturation time
was determined after a sufficiently long time had passed from
. If the operation information is unknown, the automatic determination of
and
from the measured time-series data of neutron counts will be an additional issue for the present TDDI method. Furthermore, the subcriticality in the present experiments was relatively shallow; therefore, the point kinetics parameters were nearly equal to those at critical state and time variations in the point kinetics parameters seemed to be small. To investigate the applicability of the TDDI method to a situation with time variation of point kinetics parameters, for example, the actual measurement for a deeper subcritical system is important research. In the case of a deeper subcritical system, detected neutron counts tend to be generally small, which results in a large statistical error of the TDDI method. Furthermore, the spatial higher mode effect becomes larger as the subcriticality deepens. Thus, the reduction techniques of the statistical error and the higher mode effect are necessary to be developed.
5. Conclusion
For further investigation about the applicability of the TDDI method to actual subcritical measurement, the transient experiments with simultaneous changes of subcriticality and external neutron source or to two successive safety rods dropping were conducted at UTR-KINKI. To evaluate the statistical error of subcriticality using the TDDI method, the uncertainty quantification using the random sampling method was utilized based on the approximation of the Poisson distribution of neutron counts. Consequently, it was validated that the subcriticality in dollar units by the TDDI method better agreed with the reference values than the previous integral method. Thus, the superiority of the TDDI method was demonstrated for the non-stepwise transients in the present experiments.
For further improvements of the TDDI method, the following future researches are necessary: (1) the automatic determination for time configurations of ,
, and
; (2) the reduction techniques of the statistical error and the higher mode effect for a deeper subcritical system; and (3) the correction method for underestimation of the statistical error by the random sampling method based on the Poisson distribution.
Acknowledgments
This work was carried out as a joint research program of the UTR-KINKI under the support of the Graduate School of Engineering, Osaka University. The authors are grateful to all the staff at UTR-KINKI for their assistance during the experiments.
Disclosure statement
No potential conflict of interest was reported by the authors.
Additional information
Funding
References
- Tashiro S, Tojo M, Shimazu Y. Development of sub-criticality monitoring method during shutdown modes of nuclear power plants. Proc ICAPP 2017; 2017 Apr 24–28; Fukui and Kyoto, Japan.
- Tojo M, Tashiro S, Shimazu Y, et al. Verification of sub-criticality monitoring method with actual startup range neutron monitor signals during shutdown modes in a BWR. Proc ICAPP 2017; 2017 Apr 24–28; Fukui and Kyoto, Japan.
- Watanabe M, Yamamoto A, Yamane Y. Measuring the photoneutrons originating from D(γ, n)H reaction after the shutdown of an operational BWR. J Nucl Sci Technol. 2009;46(12):1099–1112.
- Morimoto Y, Akaike M, Takeo S, et al. Proposal of a statistical evaluation method for the criticality of the Fukushima Daiichi nuclear power plants. Nucl Technol. 2019;205(12):1652–1660.
- Keepin GR. Physics of nuclear kinetics. Reading (MA): Addison-Wesley Pub Co, Inc; 1965.
- Mukaiyama T, Nakano M, Mizoo N, et al. Reactivity measurement in a far-subcritical fast system: (II) neutron source multiplication method. Ibaraki: Japan Atomic Energy Agency; 1975. JAERI-M 6067.
- Naing W, Tsuji M, Shimazu Y. Subcriticality measurement of pressurized water reactors by the modified neutron source multiplication method. J Nucl Sci Technol. 2003;40(12):983–988.
- Endo T, Yamamoto A, Yamane Y. Detected-neutron multiplication factor measured by neutron source multiplication method. Ann Nucl Energy. 2011;38(11):2417–2427.
- Suzuki E, Tsunoda T. A reactivity meter and its application. J Nucl Sci Technol. 1964;1(6):210–218.
- Shimazu Y, Unesaki H, Suzuki N. Subcriticality monitoring with a digital reactivity meter. J Nucl Sci Technol. 2003;40(11):970–974.
- Naing W, Tsuji M, Shimazu Y. Subcriticality measurement of pressurized water reactors during criticality approach using a digital reactivity meter. J Nucl Sci Technol. 2005;42(2):145–152.
- Nonaka A, Endo T, Yamamoto A. Estimation of subcriticality in dollar units using integral method for subcritical system. Proc PHYSOR 2018; 2018 Apr 22–26; Cancun, Mexico.
- Nonaka A, Endo T, Yamamoto A. Estimation of subcriticality in dollar units based on integral method for arbitrary state-change in subcritical system. Trans Am Nucl Soc. 2018;119:1112–1115.
- Nonaka A, Endo T, Yamamoto A, et al. Measurement of subcriticality in dollar units using time-domain decomposition based integral method. Proc ICNC 2019; 2019 Sep 15–20; Paris, France.
- Lewins J. Nuclear reactor kinetics and control, Chapter 2, Neutron and precursor equations. Oxford (UK): Pergamon Press; 1978.
- Taninaka H, Hashimoto K, Ohsawa T. An extended rod drop method applicable to subcritical reactor system driven by neutron source. J Nucl Sci Technol. 2010;47(4):351–356.
- Feynman RP, de Hoffmann F, Serber R. Dispersion of the neutron emission in U-235 fission. J Nucl Energy. 1956;3(1–2):64–69.
- Yamamoto A, Kinoshita K, Watanabe T, et al. Uncertainty quantification of LWR core characteristics using random sampling method. Nucl Sci Eng. 2015;181(2):160–174.
- Endo T, Watanabe T, Yamamoto A. Confidence interval estimation by bootstrap method for uncertainty quantification using random sampling method. J Nucl Sci Technol. 2015;52(7–8):993–999.
- Endo T, Chiba G, van Rooijen WFG, et al. Experimental analysis and uncertainty quantification using random sampling technique for ADS experiments at KUCA. J Nucl Sci Technol. 2018;55(4):450–459.
- Sakon A, Nakajima K, Hohara S, et al. Experimental study of neutron counting in a zero-power reactor driven by a neutron source inherent in highly enriched uranium fuels. J Nucl Sci Technol. 2019;56(2):254–259.